
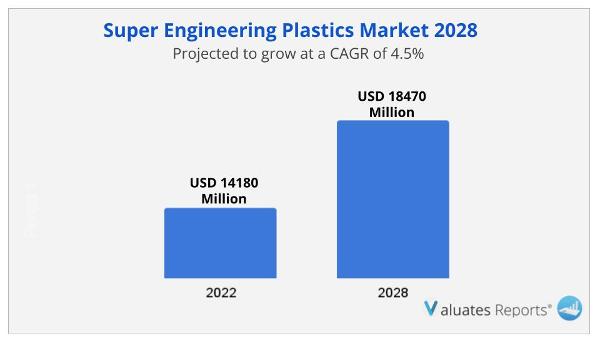
The Super Engineering Plastics market is projected to reach US$ 18470 million by 2028 from an estimated US$ 14180 million in 2022, at a CAGR of 4.5% during 2023 and 2028.
Super engineering plastics are a higher grade of engineered plastics than typical commodity plastics, such as polyethylene (PE) and polystyrene, and they have greater thermal and electrical qualities (PS). The kind of materials employed determines the uses of the super engineering plastics.
In the automobile industry, for instance, polyphenylene sulfide (PPS) is widely utilized in a variety of applications, from the fabrication of the chassis to the production of engine mounts. PPS is very resistant to heat. Similar to steel, polyamide (PA) is extremely resistant to abrasion and is popular for usage in domestic applications such as connector systems and surface mounting. This factor is expected to drive the growth of the Super Engineering Plastics market.
One of the main factors fueling the expansion of the market for super engineering plastics is the rising need for durable and high-quality plastic products. Increased use of cutting-edge manufacturing techniques, growing awareness of the environmental advantages of adopting eco-friendly materials, and increased investment in R&D projects aimed at developing plastic materials technology are all factors that are fueling the expansion of this Super Engineering Plastics market.
High-performance engineering plastics called Super Engineering Plastics (SPEs) have exceptional mechanical qualities like stiffness, strength, and heat resistance. The product is utilized in a variety of end-use industries, including consumer goods, electrical & electronics, and automotive & transportation. This in turn is expected to drive the growth of the Super Engineering Plastics market.
A variety of polymers are combined to create polyphenylene sulfide (PPS) super engineering plastics, a form of plastic. PPS is frequently used in applications requiring high stiffness and strength, like equipment and automobile parts. Super engineered polymers composed of liquid crystals are known as liquid-crystal polymer (LCP) materials. Numerous products, including machinery and parts for automobiles, electrical and electronic equipment, and other items, can be made with these polymers. LCPs are perfect for high-quality products since they are frequently more resilient than other kinds of polymers. This will further drive the Super Engineering Plastics market.
During the anticipated period, Asia Pacific is anticipated to overtake North America as the market leader for Super engineering plastics. Significant market opportunity exists in Latin America, the Middle East, and Africa for specific engineering plastics.
|
Report Metric |
Details |
|
Report Name |
Super Engineering Plastics Market |
|
The market size in 2022 |
USD 4180 Million |
|
The revenue forecast in 2028 |
USD 18470 Million |
|
Growth Rate |
Compound Annual Growth Rate (CAGR) of 4.5% from 2023 to 2028 |
|
Market size available for years |
2023-2028 |
|
Forecast units |
Value (USD) |
|
Segments covered |
By Type, Application, and Region |
|
Report coverage |
Revenue & volume forecast, company share, competitive landscape, growth factors, and trends |
|
Geographic regions covered |
North America, Europe, Asia Pacific, Latin America, Middle East & Africa |
Ans. The global Super Engineering Plastics market is projected to reach US$ 18470 million by 2028 from an estimated US$ 14180 million in 2022, at a CAGR of 4.5% during 2023 and 2028.
Ans. The global Super Engineering Plastics market is expected to grow at a compound annual growth rate of 4.5% from 2022 to 2028.
Ans. Some of the key players are Companies, PPS, Toray, DIC, Solvay S A, Celanese, Kureha, SK Chemical, Tosoh, Sumitomo Chemical, SABIC, Polyplastics Co Ltd, Evonik, Zhejiang NHU, Chongqing Glion, Others.
Ans. Yes, The Chapter Cost available for the forecasted year 2023 to 2028. You can also customised reports based on your requirements.
1 Study Coverage
1.1 Super Engineering Plastics Product Introduction
1.2 Market by Type
1.2.1 Global Super Engineering Plastics Market Size Growth Rate by Type (2017 VS 2021 VS 2028)
1.2.2 Polyphenylene Sulfide (PPS)
1.2.3 Polyimide (PI)
1.2.4 Polysulfone (PSU)
1.2.5 Liquid-Crystal Polymer (LCP)
1.2.6 Polyetheretherketone (PEEK)
1.2.7 Others
1.3 Market by Downstream Industry
1.3.1 Global Super Engineering Plastics Market Size Growth Rate by Downstream Industry (2017 VS 2021 VS 2028)
1.3.2 Automotive
1.3.3 Electrical and Electronic
1.3.4 Aerospace & Defense
1.3.5 Machinery & Equipment
1.3.6 Medical Devices
1.3.7 Other
1.4 Study Objectives
1.5 Years Considered
2 Executive Summary
2.1 Global Super Engineering Plastics Market Size Estimates and Forecasts
2.1.1 Global Super Engineering Plastics Revenue 2017-2028
2.1.2 Global Super Engineering Plastics Sales 2017-2028
2.2 Super Engineering Plastics Market Size by Region: 2022 Versus 2028
2.3 Super Engineering Plastics Sales by Region (2017-2028)
2.3.1 Global Super Engineering Plastics Sales by Region: 2017-2022
2.3.2 Global Super Engineering Plastics Sales Forecast by Region (2023-2028)
2.3.3 Global Super Engineering Plastics Sales Market Share by Region (2017-2028)
2.4 Super Engineering Plastics Market Estimates and Projections by Region (2023-2028)
2.4.1 Global Super Engineering Plastics Revenue by Region: 2017-2022
2.4.2 Global Super Engineering Plastics Revenue Forecast by Region (2023-2028)
2.4.3 Global Super Engineering Plastics Revenue Market Share by Region (2017-2028)
3 Global Super Engineering Plastics by Manufacturers
3.1 Global Top Super Engineering Plastics Manufacturers by Sales
3.1.1 Global Super Engineering Plastics Sales by Manufacturer (2017-2022)
3.1.2 Global Super Engineering Plastics Sales Market Share by Manufacturer (2017-2022)
3.2 Global Top Super Engineering Plastics Manufacturers by Revenue
3.2.1 Global Super Engineering Plastics Revenue by Manufacturer (2017-2022)
3.2.2 Global Super Engineering Plastics Revenue Share by Manufacturer (2017-2022)
3.3 Global Super Engineering Plastics Price by Manufacturer (2017-2022)
3.4 Competitive Landscape
3.4.1 Key Super Engineering Plastics Manufacturers Covered: Ranking by Revenue
3.4.2 Global Super Engineering Plastics Market Concentration Ratio (CR5 and HHI) & (2017-2022)
3.4.3 Global Super Engineering Plastics Market Share by Company Type (Tier 1, Tier 2 and Tier 3)
3.5 Global Super Engineering Plastics Manufacturing Base Distribution, Product Type
3.5.1 Super Engineering Plastics Manufacturers Manufacturing Base Distribution, Headquarters
3.5.2 Manufacturers Super Engineering Plastics Product Type
3.5.3 Date of International Manufacturers Enter into Super Engineering Plastics Market
3.6 Manufacturers Mergers & Acquisitions, Expansion Plans
4 Company Profiles
4.1 Toray
4.1.1 Toray Corporation Information
4.1.2 Toray Description, Business Overview
4.1.3 Toray Super Engineering Plastics Products Offered
4.1.4 Toray Super Engineering Plastics Sales, Revenue and Gross Margin (2017-2022)
4.1.5 Toray Super Engineering Plastics Sales by Product in 2021
4.1.6 Toray Super Engineering Plastics Sales by Downstream Industry in 2021
4.1.7 Toray Super Engineering Plastics Sales by Geographic Area in 2021
4.1.8 Toray Recent Developments
4.2 DIC
4.2.1 DIC Corporation Information
4.2.2 DIC Description, Business Overview
4.2.3 DIC Super Engineering Plastics Products Offered
4.2.4 DIC Super Engineering Plastics Sales, Revenue and Gross Margin (2017-2022)
4.2.5 DIC Super Engineering Plastics Sales by Product in 2021
4.2.6 DIC Super Engineering Plastics Sales by Downstream Industry in 2021
4.2.7 DIC Super Engineering Plastics Sales by Geographic Area in 2021
4.2.8 DIC Recent Developments
4.3 Solvay
4.3.1 Solvay Corporation Information
4.3.2 Solvay Description, Business Overview
4.3.3 Solvay Super Engineering Plastics Products Offered
4.3.4 Solvay Super Engineering Plastics Sales, Revenue and Gross Margin (2017-2022)
4.3.5 Solvay Super Engineering Plastics Sales by Product in 2021
4.3.6 Solvay Super Engineering Plastics Sales by Downstream Industry in 2021
4.3.7 Solvay Super Engineering Plastics Sales by Geographic Area in 2021
4.3.8 Solvay Recent Developments
4.4 Celanese
4.4.1 Celanese Corporation Information
4.4.2 Celanese Description, Business Overview
4.4.3 Celanese Super Engineering Plastics Products Offered
4.4.4 Celanese Super Engineering Plastics Sales, Revenue and Gross Margin (2017-2022)
4.4.5 Celanese Super Engineering Plastics Sales by Product in 2021
4.4.6 Celanese Super Engineering Plastics Sales by Downstream Industry in 2021
4.4.7 Celanese Super Engineering Plastics Sales by Geographic Area in 2021
4.4.8 Celanese Recent Developments
4.5 Kureha
4.5.1 Kureha Corporation Information
4.5.2 Kureha Description, Business Overview
4.5.3 Kureha Super Engineering Plastics Products Offered
4.5.4 Kureha Super Engineering Plastics Sales, Revenue and Gross Margin (2017-2022)
4.5.5 Kureha Super Engineering Plastics Sales by Product in 2021
4.5.6 Kureha Super Engineering Plastics Sales by Downstream Industry in 2021
4.5.7 Kureha Super Engineering Plastics Sales by Geographic Area in 2021
4.5.8 Kureha Recent Developments
4.6 SK Chemical
4.6.1 SK Chemical Corporation Information
4.6.2 SK Chemical Description, Business Overview
4.6.3 SK Chemical Super Engineering Plastics Products Offered
4.6.4 SK Chemical Super Engineering Plastics Sales, Revenue and Gross Margin (2017-2022)
4.6.5 SK Chemical Super Engineering Plastics Sales by Product in 2021
4.6.6 SK Chemical Super Engineering Plastics Sales by Downstream Industry in 2021
4.6.7 SK Chemical Super Engineering Plastics Sales by Geographic Area in 2021
4.6.8 SK Chemical Recent Development
4.7 Tosoh
4.7.1 Tosoh Corporation Information
4.7.2 Tosoh Description, Business Overview
4.7.3 Tosoh Super Engineering Plastics Products Offered
4.7.4 Tosoh Super Engineering Plastics Sales, Revenue and Gross Margin (2017-2022)
4.7.5 Tosoh Super Engineering Plastics Sales by Product in 2021
4.7.6 Tosoh Super Engineering Plastics Sales by Downstream Industry in 2021
4.7.7 Tosoh Super Engineering Plastics Sales by Geographic Area in 2021
4.7.8 Tosoh Recent Development
4.8 Sumitomo Chemical
4.8.1 Sumitomo Chemical Corporation Information
4.8.2 Sumitomo Chemical Description, Business Overview
4.8.3 Sumitomo Chemical Super Engineering Plastics Products Offered
4.8.4 Sumitomo Chemical Super Engineering Plastics Sales, Revenue and Gross Margin (2017-2022)
4.8.5 Sumitomo Chemical Super Engineering Plastics Sales by Product in 2021
4.8.6 Sumitomo Chemical Super Engineering Plastics Sales by Downstream Industry in 2021
4.8.7 Sumitomo Chemical Super Engineering Plastics Sales by Geographic Area in 2021
4.8.8 Sumitomo Chemical Recent Development
4.9 SABIC
4.9.1 SABIC Corporation Information
4.9.2 SABIC Description, Business Overview
4.9.3 SABIC Super Engineering Plastics Products Offered
4.9.4 SABIC Super Engineering Plastics Sales, Revenue and Gross Margin (2017-2022)
4.9.5 SABIC Super Engineering Plastics Sales by Product in 2021
4.9.6 SABIC Super Engineering Plastics Sales by Downstream Industry in 2021
4.9.7 SABIC Super Engineering Plastics Sales by Geographic Area in 2021
4.9.8 SABIC Recent Development
4.10 Polyplastics
4.10.1 Polyplastics Corporation Information
4.10.2 Polyplastics Description, Business Overview
4.10.3 Polyplastics Super Engineering Plastics Products Offered
4.10.4 Polyplastics Super Engineering Plastics Sales, Revenue and Gross Margin (2017-2022)
4.10.5 Polyplastics Super Engineering Plastics Sales by Product in 2021
4.10.6 Polyplastics Super Engineering Plastics Sales by Downstream Industry in 2021
4.10.7 Polyplastics Super Engineering Plastics Sales by Geographic Area in 2021
4.10.8 Polyplastics Recent Development
4.11 Evonik
4.11.1 Evonik Corporation Information
4.11.2 Evonik Description, Business Overview
4.11.3 Evonik Super Engineering Plastics Products Offered
4.11.4 Evonik Super Engineering Plastics Sales, Revenue and Gross Margin (2017-2022)
4.11.5 Evonik Super Engineering Plastics Sales by Product in 2021
4.11.6 Evonik Super Engineering Plastics Sales by Downstream Industry in 2021
4.11.7 Evonik Super Engineering Plastics Sales by Geographic Area in 2021
4.11.8 Evonik Recent Development
4.12 Zhejiang NHU
4.12.1 Zhejiang NHU Corporation Information
4.12.2 Zhejiang NHU Description, Business Overview
4.12.3 Zhejiang NHU Super Engineering Plastics Products Offered
4.12.4 Zhejiang NHU Super Engineering Plastics Sales, Revenue and Gross Margin (2017-2022)
4.12.5 Zhejiang NHU Super Engineering Plastics Sales by Product in 2021
4.12.6 Zhejiang NHU Super Engineering Plastics Sales by Downstream Industry in 2021
4.12.7 Zhejiang NHU Super Engineering Plastics Sales by Geographic Area in 2021
4.12.8 Zhejiang NHU Recent Development
4.13 Chongqing Glion
4.13.1 Chongqing Glion Corporation Information
4.13.2 Chongqing Glion Description, Business Overview
4.13.3 Chongqing Glion Super Engineering Plastics Products Offered
4.13.4 Chongqing Glion Super Engineering Plastics Sales, Revenue and Gross Margin (2017-2022)
4.13.5 Chongqing Glion Super Engineering Plastics Sales by Product in 2021
4.13.6 Chongqing Glion Super Engineering Plastics Sales by Downstream Industry in 2021
4.13.7 Chongqing Glion Super Engineering Plastics Sales by Geographic Area in 2021
4.13.8 Chongqing Glion Recent Development
5 Breakdown Data by Type
5.1 Global Super Engineering Plastics Sales by Type (2017-2028)
5.1.1 Global Super Engineering Plastics Sales by Type (2017-2022)
5.1.2 Global Super Engineering Plastics Sales Forecast by Type (2023-2028)
5.1.3 Global Super Engineering Plastics Sales Market Share by Type (2017-2028)
5.2 Global Super Engineering Plastics Revenue Forecast by Type (2017-2028)
5.2.1 Global Super Engineering Plastics Revenue by Type (2017-2022)
5.2.2 Global Super Engineering Plastics Revenue Forecast by Type (2023-2028)
5.2.3 Global Super Engineering Plastics Revenue Market Share by Type (2017-2028)
5.3 Super Engineering Plastics Average Selling Price (ASP) by Type (2017-2028)
6 Breakdown Data by Downstream Industry
6.1 Global Super Engineering Plastics Sales by Downstream Industry (2017-2028)
6.1.1 Global Super Engineering Plastics Sales by Downstream Industry (2017-2022)
6.1.2 Global Super Engineering Plastics Sales Forecast by Downstream Industry (2023-2028)
6.1.3 Global Super Engineering Plastics Sales Market Share by Downstream Industry (2017-2028)
6.2 Global Super Engineering Plastics Revenue Forecast by Downstream Industry (2017-2028)
6.2.1 Global Super Engineering Plastics Revenue by Downstream Industry (2017-2022)
6.2.2 Global Super Engineering Plastics Revenue Forecast by Downstream Industry (2023-2028)
6.2.3 Global Super Engineering Plastics Revenue Market Share by Downstream Industry (2017-2028)
6.3 Super Engineering Plastics Average Selling Price (ASP) by Downstream Industry (2017-2028)
7 North America
7.1 North America Super Engineering Plastics Market Size YoY Growth 2017-2028
7.2 North America Super Engineering Plastics Market Facts & Figures by Country
7.2.1 North America Super Engineering Plastics Sales by Country (2017-2028)
7.2.2 North America Super Engineering Plastics Revenue by Country (2017-2028)
7.3 North America Super Engineering Plastics Sales by Type
7.4 North America Super Engineering Plastics Sales by Downstream Industry
8 Asia-Pacific
8.1 Asia-Pacific Super Engineering Plastics Market Size YoY Growth 2017-2028
8.2 Asia-Pacific Super Engineering Plastics Market Facts & Figures by Region
8.2.1 Asia-Pacific Super Engineering Plastics Sales by Region (2017-2028)
8.2.2 Asia-Pacific Super Engineering Plastics Revenue by Region (2017-2028)
8.3 Asia-Pacific Super Engineering Plastics Sales by Type
8.4 Asia-Pacific Super Engineering Plastics Sales by Downstream Industry
9 Europe
9.1 Europe Super Engineering Plastics Market Size YoY Growth 2017-2028
9.2 Europe Super Engineering Plastics Market Facts & Figures by Country
9.2.1 Europe Super Engineering Plastics Sales by Country (2017-2028)
9.2.2 Europe Super Engineering Plastics Revenue by Country (2017-2028)
9.3 Europe Super Engineering Plastics Sales by Type
9.4 Europe Super Engineering Plastics Sales by Downstream Industry
10 Latin America
10.1 Latin America Super Engineering Plastics Market Size YoY Growth 2017-2028
10.2 Latin America Super Engineering Plastics Market Facts & Figures by Country
10.2.1 Latin America Super Engineering Plastics Sales by Country (2017-2028)
10.2.2 Latin America Super Engineering Plastics Revenue by Country (2017-2028)
10.3 Latin America Super Engineering Plastics Sales by Type
10.4 Latin America Super Engineering Plastics Sales by Downstream Industry
11 Middle East and Africa
11.1 Middle East and Africa Super Engineering Plastics Market Size YoY Growth 2017-2028
11.2 Middle East and Africa Super Engineering Plastics Market Facts & Figures by Country
11.2.1 Middle East and Africa Super Engineering Plastics Sales by Country (2017-2028)
11.2.2 Middle East and Africa Super Engineering Plastics Revenue by Country (2017-2028)
11.3 Middle East and Africa Super Engineering Plastics Sales by Type
11.4 Middle East and Africa Super Engineering Plastics Sales by Downstream Industry
12 Supply Chain and Sales Channel Analysis
12.1 Super Engineering Plastics Supply Chain Analysis
12.2 Super Engineering Plastics Key Raw Materials and Upstream Suppliers
12.3 Super Engineering Plastics Clients Analysis
12.4 Super Engineering Plastics Sales Channel and Sales Model Analysis
12.4.1 Super Engineering Plastics Distribution Channel Analysis: Indirect Sales VS Direct Sales
12.4.2 Super Engineering Plastics Distribution Channel Analysis: Online Sales VS Offline Sales
12.4.3 Super Engineering Plastics Distributors
13 Market Dynamics
13.1 Super Engineering Plastics Industry Trends
13.2 Super Engineering Plastics Market Drivers
13.3 Super Engineering Plastics Market Challenges
13.4 Super Engineering Plastics Market Restraints
13.5 Porter’s Five Forces Analysis
14 Research Findings and Conclusion
15 Appendix
15.1 Research Methodology
15.1.1 Methodology/Research Approach
15.1.2 Data Source
15.2 Author Details
15.3 Disclaimer
List of Tables
Table 1. Global Super Engineering Plastics Market Size Growth Rate by Type (US$ Million): 2017 VS 2021 VS 2028
Table 2. Major Manufacturers of Polyphenylene Sulfide (PPS)
Table 3. Major Manufacturers of Polyimide (PI)
Table 4. Major Manufacturers of Polysulfone (PSU)
Table 5. Major Manufacturers of Liquid-Crystal Polymer (LCP)
Table 6. Major Manufacturers of Polyetheretherketone (PEEK)
Table 7. Major Manufacturers of Others
Table 8. Global Super Engineering Plastics Market Size Growth by Downstream Industry (US$ Million): 2017 VS 2021 VS 2028
Table 9. Global Super Engineering Plastics Market Size by Region (US$ Million): 2021 VS 2022 VS 2028
Table 10. Global Super Engineering Plastics Sales by Region (2017-2022) & (Kilo MT)
Table 11. Global Super Engineering Plastics Sales Forecast by Region (2023-2028) & (Kilo MT)
Table 12. Global Super Engineering Plastics Revenue by Region (2017-2022) & (US$ Million)
Table 13. Global Super Engineering Plastics Revenue Forecast by Region (2023-2028) & (US$ Million)
Table 14. Global Super Engineering Plastics Sales by Manufacturer (2017-2022) & (Kilo MT)
Table 15. Global Super Engineering Plastics Sales Share by Manufacturer (2017-2022)
Table 16. Super Engineering Plastics Revenue by Manufacturer (2017-2022) & (US$ Million)
Table 17. Super Engineering Plastics Revenue Share by Manufacturer (2017-2022)
Table 18. Key Manufacturers Super Engineering Plastics Price (2017-2022) & (USD/MT)
Table 19. Ranking of Global Top Super Engineering Plastics Manufacturers by Revenue (US$ Million) in 2021
Table 20. Global Super Engineering Plastics Manufacturers Market Concentration Ratio (CR5 and HHI) & (2017-2022)
Table 21. Global Super Engineering Plastics by Company Type (Tier 1, Tier 2 and Tier 3) & (based on the Revenue in Super Engineering Plastics as of 2021)
Table 22. Super Engineering Plastics Manufacturers Manufacturing Base Distribution and Headquarters
Table 23. Manufacturers Super Engineering Plastics Product Type
Table 24. Date of International Manufacturers Enter into Super Engineering Plastics Market
Table 25. Manufacturers Mergers & Acquisitions, Expansion Plans
Table 26. Toray Corporation Information
Table 27. Toray Description and Business Overview
Table 28. Toray Super Engineering Plastics Sales (Kilo MT), Revenue (US$ Million), Price (USD/MT) and Gross Margin (2017-2022)
Table 29. Toray Super Engineering Plastics Product
Table 30. Toray Super Engineering Plastics Sales Proportion of Super Engineering Plastics by Product in 2021
Table 31. Toray Super Engineering Plastics Sales Proportion of Super Engineering Plastics by Downstream Industry in 2021
Table 32. Toray Super Engineering Plastics Sales Proportion of Super Engineering Plastics by Geographic Area in 2021
Table 33. Toray Recent Development
Table 34. DIC Corporation Information
Table 35. DIC Description and Business Overview
Table 36. DIC Super Engineering Plastics Sales (Kilo MT), Revenue (US$ Million), Price (USD/MT) and Gross Margin (2017-2022)
Table 37. DIC Super Engineering Plastics Product
Table 38. DIC Super Engineering Plastics Sales Proportion of Super Engineering Plastics by Product in 2021
Table 39. DIC Super Engineering Plastics Sales Proportion of Super Engineering Plastics by Downstream Industry in 2021
Table 40. DIC Super Engineering Plastics Sales Proportion of Super Engineering Plastics by Geographic Area in 2021
Table 41. DIC Recent Development
Table 42. Solvay Corporation Information
Table 43. Solvay Description and Business Overview
Table 44. Solvay Super Engineering Plastics Sales (Kilo MT), Revenue (US$ Million), Price (USD/MT) and Gross Margin (2017-2022)
Table 45. Solvay Super Engineering Plastics Product
Table 46. Solvay Super Engineering Plastics Sales Proportion of Super Engineering Plastics by Product in 2021
Table 47. Solvay Super Engineering Plastics Sales Proportion of Super Engineering Plastics by Downstream Industry in 2021
Table 48. Solvay Super Engineering Plastics Sales Proportion of Super Engineering Plastics by Geographic Area in 2021
Table 49. Solvay Recent Development
Table 50. Celanese Corporation Information
Table 51. Celanese Description and Business Overview
Table 52. Celanese Super Engineering Plastics Sales (Kilo MT), Revenue (US$ Million), Price (USD/MT) and Gross Margin (2017-2022)
Table 53. Celanese Super Engineering Plastics Product
Table 54. Celanese Super Engineering Plastics Sales Proportion of Super Engineering Plastics by Product in 2021
Table 55. Celanese Super Engineering Plastics Sales Proportion of Super Engineering Plastics by Downstream Industry in 2021
Table 56. Celanese Super Engineering Plastics Sales Proportion of Super Engineering Plastics by Geographic Area in 2021
Table 57. Celanese Recent Development
Table 58. Kureha Corporation Information
Table 59. Kureha Description and Business Overview
Table 60. Kureha Super Engineering Plastics Sales (Kilo MT), Revenue (US$ Million), Price (USD/MT) and Gross Margin (2017-2022)
Table 61. Kureha Super Engineering Plastics Product
Table 62. Kureha Super Engineering Plastics Sales Proportion of Super Engineering Plastics by Product in 2021
Table 63. Kureha Super Engineering Plastics Sales Proportion of Super Engineering Plastics by Downstream Industry in 2021
Table 64. Kureha Super Engineering Plastics Sales Proportion of Super Engineering Plastics by Geographic Area in 2021
Table 65. Kureha Recent Development
Table 66. SK Chemical Corporation Information
Table 67. SK Chemical Description and Business Overview
Table 68. SK Chemical Super Engineering Plastics Sales (Kilo MT), Revenue (US$ Million), Price (USD/MT) and Gross Margin (2017-2022)
Table 69. SK Chemical Super Engineering Plastics Product
Table 70. SK Chemical Super Engineering Plastics Sales Proportion of Super Engineering Plastics by Product in 2021
Table 71. SK Chemical Super Engineering Plastics Sales Proportion of Super Engineering Plastics by Downstream Industry in 2021
Table 72. SK Chemical Super Engineering Plastics Sales Proportion of Super Engineering Plastics by Geographic Area in 2021
Table 73. Tosoh Corporation Information
Table 74. Tosoh Description and Business Overview
Table 75. Tosoh Super Engineering Plastics Sales (Kilo MT), Revenue (US$ Million), Price (USD/MT) and Gross Margin (2017-2022)
Table 76. Tosoh Super Engineering Plastics Product
Table 77. Tosoh Super Engineering Plastics Sales Proportion of Super Engineering Plastics by Product in 2021
Table 78. Tosoh Super Engineering Plastics Sales Proportion of Super Engineering Plastics by Downstream Industry in 2021
Table 79. Tosoh Super Engineering Plastics Sales Proportion of Super Engineering Plastics by Geographic Area in 2021
Table 80. Sumitomo Chemical Corporation Information
Table 81. Sumitomo Chemical Description and Business Overview
Table 82. Sumitomo Chemical Super Engineering Plastics Sales (Kilo MT), Revenue (US$ Million), Price (USD/MT) and Gross Margin (2017-2022)
Table 83. Sumitomo Chemical Super Engineering Plastics Product
Table 84. Sumitomo Chemical Super Engineering Plastics Sales Proportion of Super Engineering Plastics by Product in 2021
Table 85. Sumitomo Chemical Super Engineering Plastics Sales Proportion of Super Engineering Plastics by Downstream Industry in 2021
Table 86. Sumitomo Chemical Super Engineering Plastics Sales Proportion of Super Engineering Plastics by Geographic Area in 2021
Table 87. SABIC Corporation Information
Table 88. SABIC Description and Business Overview
Table 89. SABIC Super Engineering Plastics Sales (Kilo MT), Revenue (US$ Million), Price (USD/MT) and Gross Margin (2017-2022)
Table 90. SABIC Super Engineering Plastics Product
Table 91. SABIC Super Engineering Plastics Sales Proportion of Super Engineering Plastics by Product in 2021
Table 92. SABIC Super Engineering Plastics Sales Proportion of Super Engineering Plastics by Downstream Industry in 2021
Table 93. SABIC Super Engineering Plastics Sales Proportion of Super Engineering Plastics by Geographic Area in 2021
Table 94. Polyplastics Corporation Information
Table 95. Polyplastics Description and Business Overview
Table 96. Polyplastics Super Engineering Plastics Sales (Kilo MT), Revenue (US$ Million), Price (USD/MT) and Gross Margin (2017-2022)
Table 97. Polyplastics Super Engineering Plastics Product
Table 98. Polyplastics Super Engineering Plastics Sales Proportion of Super Engineering Plastics by Product in 2021
Table 99. Polyplastics Super Engineering Plastics Sales Proportion of Super Engineering Plastics by Downstream Industry in 2021
Table 100. Polyplastics Super Engineering Plastics Sales Proportion of Super Engineering Plastics by Geographic Area in 2021
Table 101. Evonik Corporation Information
Table 102. Evonik Description and Business Overview
Table 103. Evonik Super Engineering Plastics Sales (Kilo MT), Revenue (US$ Million), Price (USD/MT) and Gross Margin (2017-2022)
Table 104. Evonik Super Engineering Plastics Product
Table 105. Evonik Super Engineering Plastics Sales Proportion of Super Engineering Plastics by Product in 2021
Table 106. Evonik Super Engineering Plastics Sales Proportion of Super Engineering Plastics by Downstream Industry in 2021
Table 107. Evonik Super Engineering Plastics Sales Proportion of Super Engineering Plastics by Geographic Area in 2021
Table 108. Zhejiang NHU Corporation Information
Table 109. Zhejiang NHU Description and Business Overview
Table 110. Zhejiang NHU Super Engineering Plastics Sales (Kilo MT), Revenue (US$ Million), Price (USD/MT) and Gross Margin (2017-2022)
Table 111. Zhejiang NHU Super Engineering Plastics Product
Table 112. Zhejiang NHU Super Engineering Plastics Sales Proportion of Super Engineering Plastics by Product in 2021
Table 113. Zhejiang NHU Super Engineering Plastics Sales Proportion of Super Engineering Plastics by Downstream Industry in 2021
Table 114. Zhejiang NHU Super Engineering Plastics Sales Proportion of Super Engineering Plastics by Geographic Area in 2021
Table 115. Chongqing Glion Corporation Information
Table 116. Chongqing Glion Description and Business Overview
Table 117. Chongqing Glion Super Engineering Plastics Sales (Kilo MT), Revenue (US$ Million), Price (USD/MT) and Gross Margin (2017-2022)
Table 118. Chongqing Glion Super Engineering Plastics Product
Table 119. Chongqing Glion Super Engineering Plastics Sales Proportion of Super Engineering Plastics by Product in 2021
Table 120. Chongqing Glion Super Engineering Plastics Sales Proportion of Super Engineering Plastics by Downstream Industry in 2021
Table 121. Chongqing Glion Super Engineering Plastics Sales Proportion of Super Engineering Plastics by Geographic Area in 2021
Table 122. Global Super Engineering Plastics Sales by Type (2017-2022) & (Kilo MT)
Table 123. Global Super Engineering Plastics Sales Forecast by Type (2023-2028) & (Kilo MT)
Table 124. Global Super Engineering Plastics Revenue by Type (2017-2022) & (US$ Million)
Table 125. Global Super Engineering Plastics Revenue Forecast by Type (2023-2028) & (US$ Million)
Table 126. Global Super Engineering Plastics Sales by Downstream Industry (2017-2022) & (Kilo MT)
Table 127. Global Super Engineering Plastics Sales Forecast by Downstream Industry (2023-2028) & (Kilo MT)
Table 128. Global Super Engineering Plastics Revenue by Downstream Industry (2017-2022) & (US$ Million)
Table 129. Global Super Engineering Plastics Revenue Forecast by Downstream Industry (2023-2028) & (US$ Million)
Table 130. North America Super Engineering Plastics Sales by Country (2017-2022) & (Kilo MT)
Table 131. North America Super Engineering Plastics Sales by Country (2023-2028) & (Kilo MT)
Table 132. North America Super Engineering Plastics Revenue by Country (2017-2022) & (US$ Million)
Table 133. North America Super Engineering Plastics Revenue by Country (2023-2028) & (US$ Million)
Table 134. North America Super Engineering Plastics Sales by Type (2017-2022) & (Kilo MT)
Table 135. North America Super Engineering Plastics Sales by Downstream Industry (2017-2022) & (Kilo MT)
Table 136. Asia-Pacific Super Engineering Plastics Sales by Region (2017-2022) & (Kilo MT)
Table 137. Asia-Pacific Super Engineering Plastics Sales by Region (2023-2028) & (Kilo MT)
Table 138. Asia-Pacific Super Engineering Plastics Revenue by Region (2017-2028) & (US$ Million)
Table 139. Asia-Pacific Super Engineering Plastics Revenue by Region (2023-2028) & (US$ Million)
Table 140. Asia-Pacific Super Engineering Plastics Sales by Type (2017-2022) & (Kilo MT)
Table 141. Asia-Pacific Super Engineering Plastics Sales by Downstream Industry (2017-2022) & (Kilo MT)
Table 142. Europe Super Engineering Plastics Sales by Country (2017-2022) & (Kilo MT)
Table 143. Europe Super Engineering Plastics Sales by Country (2023-2028) & (Kilo MT)
Table 144. Europe Super Engineering Plastics Revenue by Country (2017-2022) & (US$ Million)
Table 145. Europe Super Engineering Plastics Revenue by Country (2023-2028) & (US$ Million)
Table 146. Europe Super Engineering Plastics Sales by Type (2017-2022) & (Kilo MT)
Table 147. Europe Super Engineering Plastics Sales by Downstream Industry (2017-2022) & (Kilo MT)
Table 148. Latin America Super Engineering Plastics Sales by Country (2017-2022) & (Kilo MT)
Table 149. Latin America Super Engineering Plastics Sales by Country (2023-2028) & (Kilo MT)
Table 150. Latin America Super Engineering Plastics Revenue by Country (2017-2022) & (US$ Million)
Table 151. Latin America Super Engineering Plastics Revenue by Country (2023-2028) & (US$ Million)
Table 152. Latin America Super Engineering Plastics Sales by Type (2017-2022) & (Kilo MT)
Table 153. Latin America Super Engineering Plastics Sales by Downstream Industry (2017-2022) & (Kilo MT)
Table 154. Middle East and Africa Super Engineering Plastics Sales by Country (2017-2022) & (Kilo MT)
Table 155. Middle East and Africa Super Engineering Plastics Sales by Country (2023-2028) & (Kilo MT)
Table 156. Middle East and Africa Super Engineering Plastics Revenue by Country (2017-2022) & (US$ Million)
Table 157. Middle East and Africa Super Engineering Plastics Revenue by Country (2023-2028) & (US$ Million)
Table 158. Middle East and Africa Super Engineering Plastics Sales by Type (2017-2022) & (Kilo MT)
Table 159. Middle East and Africa Super Engineering Plastics Sales by Downstream Industry (2017-2022) & (Kilo MT)
Table 160. Super Engineering Plastics Key Raw Materials, Industry Status and Trend
Table 161. Super Engineering Plastics Key Raw Materials and Upstream Suppliers
Table 162. Super Engineering Plastics Clients Status and Trend
Table 163. Super Engineering Plastics Typical Clients
Table 164. Super Engineering Plastics Distributors
Table 165. Super Engineering Plastics Market Trends
Table 166. Super Engineering Plastics Market Drivers
Table 167. Super Engineering Plastics Market Challenges
Table 168. Super Engineering Plastics Market Restraints
Table 169. Research Programs/Design for This Report
Table 170. Key Data Information from Secondary Sources
Table 171. Key Data Information from Primary Sources
List of Figures
Figure 1. Super Engineering Plastics Product Picture
Figure 2. Global Super Engineering Plastics Sales Market Share by Type in 2021 & 2028
Figure 3. Polyphenylene Sulfide (PPS) Product Picture
Figure 4. Polyimide (PI) Product Picture
Figure 5. Polysulfone (PSU) Product Picture
Figure 6. Liquid-Crystal Polymer (LCP) Product Picture
Figure 7. Polyetheretherketone (PEEK) Product Picture
Figure 8. Others Product Picture
Figure 9. Global Super Engineering Plastics Sales Market Share by Downstream Industry in 2021 & 2028
Figure 10. Automotive Examples
Figure 11. Electrical and Electronic Examples
Figure 12. Aerospace & Defense Examples
Figure 13. Machinery & Equipment Examples
Figure 14. Medical Devices Examples
Figure 15. Other Examples
Figure 16. Super Engineering Plastics Report Years Considered
Figure 17. Global Super Engineering Plastics Market Size, (US$ Million), 2017 VS 2021 VS 2028
Figure 18. Global Super Engineering Plastics Market Size 2017-2028 (US$ Million)
Figure 19. Global Super Engineering Plastics Sales 2017-2028 (Kilo MT)
Figure 20. Global Super Engineering Plastics Market Size Market Share by Region: 2022 Versus 2028
Figure 21. Global Super Engineering Plastics Sales Market Share Forecast by Region (2017-2028)
Figure 22. Global Super Engineering Plastics Revenue Market Share by Region (2017-2028)
Figure 23. Global Super Engineering Plastics Sales Share by Manufacturer in 2021
Figure 24. Super Engineering Plastics Market Share by Company Type (Tier 1, Tier 2 and Tier 3): 2017 VS 2021
Figure 25. Global Super Engineering Plastics Sales Market Share Forecast by Type (2017-2028)
Figure 26. Global Super Engineering Plastics Revenue Market Share Forecast by Type (2017-2028)
Figure 27. Super Engineering Plastics Average Selling Price (ASP) by Type (2017-2022) & (USD/MT)
Figure 28. Global Super Engineering Plastics Sales Market Share Forecast by Downstream Industry (2017-2028)
Figure 29. Global Super Engineering Plastics Revenue Market Share Forecast by Downstream Industry (2017-2028)
Figure 30. Super Engineering Plastics Average Selling Price (ASP) by Downstream Industry (2017-2022) & (USD/MT)
Figure 31. North America Super Engineering Plastics Revenue 2017-2028 (US$ Million)
Figure 32. North America Super Engineering Plastics Sales Market Share by Type (2017-2022)
Figure 33. North America Super Engineering Plastics Sales Market Share by Downstream Industry (2017-2022)
Figure 34. Asia-Pacific Super Engineering Plastics Revenue 2017-2028 (US$ Million)
Figure 35. Asia-Pacific Super Engineering Plastics Sales Market Share by Region (2017-2028)
Figure 36. Asia-Pacific Super Engineering Plastics Revenue Market Share by Region (2017-2028)
Figure 37. Asia-Pacific Super Engineering Plastics Sales Market Share by Type (2017-2022)
Figure 38. Asia-Pacific Super Engineering Plastics Sales Market Share by Downstream Industry (2017-2022)
Figure 39. Europe Super Engineering Plastics Revenue Growth Rate 2017-2028 (US$ Million)
Figure 40. Europe Super Engineering Plastics Sales Market Share by Country (2017-2028)
Figure 41. Europe Super Engineering Plastics Revenue Market Share by Country (2017-2028)
Figure 42. Europe Super Engineering Plastics Sales Market Share by Type (2017-2022)
Figure 43. Europe Super Engineering Plastics Sales Market Share by Downstream Industry (2017-2022)
Figure 44. Latin America Super Engineering Plastics Revenue Growth Rate 2017-2028 (US$ Million)
Figure 45. Latin America Super Engineering Plastics Sales Market Share by Country (2017-2028)
Figure 46. Latin America Super Engineering Plastics Revenue Market Share by Country (2017-2022)
Figure 47. Latin America Super Engineering Plastics Sales Market Share by Type (2017-2022)
Figure 48. Latin America Super Engineering Plastics Sales Market Share by Downstream Industry (2017-2022)
Figure 49. Middle East and Africa Super Engineering Plastics Revenue Growth Rate 2017-2028 (US$ Million)
Figure 50. Middle East and Africa Super Engineering Plastics Sales Market Share by Country (2017-2028)
Figure 51. Middle East and Africa Super Engineering Plastics Revenue Market Share by Country (2017-2028)
Figure 52. Middle East and Africa Super Engineering Plastics Sales Market Share by Type (2017-2022)
Figure 53. Middle East and Africa Super Engineering Plastics Sales Market Share by Downstream Industry (2017-2022)
Figure 54. Super Engineering Plastics Supply Chain (Upstream and Downstream Market)
Figure 55. Global Production Market Share of Super Engineering Plastics Raw Materials by Region in 2021
Figure 56. Super Engineering Plastics Distribution Channels
Figure 57. Global Super Engineering Plastics Percentage 2017-2028: Indirect Sales VS Direct Sales
Figure 58. Global Super Engineering Plastics Percentage 2017-2028: Online Sales VS Offline Sales
Figure 59. Bottom-up and Top-down Approaches for This Report
Figure 60. Data Triangulation
$5900
$8850
$11800
HAVE A QUERY?
OUR CUSTOMER

SIMILAR REPORTS