List of Tables
Table 1. Global Location-based Ambient Intelligence Market Size Growth Rate by Type (US$ Million), 2019 VS 2023 VS 2030
Table 2. Key Players of Hardware
Table 3. Key Players of Software
Table 4. Key Players of Services
Table 5. Global Location-based Ambient Intelligence Market Size Growth Rate by Application (US$ Million), 2019 VS 2023 VS 2030
Table 6. Global Location-based Ambient Intelligence Market Size Growth Rate (CAGR) by Region (US$ Million): 2019 VS 2023 VS 2030
Table 7. Global Location-based Ambient Intelligence Market Size by Region (2019-2024) & (US$ Million)
Table 8. Global Location-based Ambient Intelligence Market Share by Region (2019-2024)
Table 9. Global Location-based Ambient Intelligence Forecasted Market Size by Region (2025-2030) & (US$ Million)
Table 10. Global Location-based Ambient Intelligence Market Share by Region (2025-2030)
Table 11. Location-based Ambient Intelligence Market Trends
Table 12. Location-based Ambient Intelligence Market Drivers
Table 13. Location-based Ambient Intelligence Market Challenges
Table 14. Location-based Ambient Intelligence Market Restraints
Table 15. Global Location-based Ambient Intelligence Revenue by Players (2019-2024) & (US$ Million)
Table 16. Global Location-based Ambient Intelligence Revenue Share by Players (2019-2024)
Table 17. Global Top Location-based Ambient Intelligence by Company Type (Tier 1, Tier 2, and Tier 3) & (based on the Revenue in Location-based Ambient Intelligence as of 2023)
Table 18. Global Location-based Ambient Intelligence Industry Ranking 2022 VS 2023 VS 2024
Table 19. Global 5 Largest Players Market Share by Location-based Ambient Intelligence Revenue (CR5 and HHI) & (2019-2024)
Table 20. Global Key Players of Location-based Ambient Intelligence, Headquarters and Area Served
Table 21. Global Key Players of Location-based Ambient Intelligence, Product and Application
Table 22. Global Key Players of Location-based Ambient Intelligence, Product and Application
Table 23. Mergers & Acquisitions, Expansion Plans
Table 24. Global Location-based Ambient Intelligence Market Size by Type (2019-2024) & (US$ Million)
Table 25. Global Location-based Ambient Intelligence Revenue Market Share by Type (2019-2024)
Table 26. Global Location-based Ambient Intelligence Forecasted Market Size by Type (2025-2030) & (US$ Million)
Table 27. Global Location-based Ambient Intelligence Revenue Market Share by Type (2025-2030)
Table 28. Global Location-based Ambient Intelligence Market Size by Application (2019-2024) & (US$ Million)
Table 29. Global Location-based Ambient Intelligence Revenue Share by Application (2019-2024)
Table 30. Global Location-based Ambient Intelligence Forecasted Market Size by Application (2025-2030) & (US$ Million)
Table 31. Global Location-based Ambient Intelligence Revenue Share by Application (2025-2030)
Table 32. North America Location-based Ambient Intelligence Market Size by Type (2019-2024) & (US$ Million)
Table 33. North America Location-based Ambient Intelligence Market Size by Type (2025-2030) & (US$ Million)
Table 34. North America Location-based Ambient Intelligence Market Size by Application (2019-2024) & (US$ Million)
Table 35. North America Location-based Ambient Intelligence Market Size by Application (2025-2030) & (US$ Million)
Table 36. North America Location-based Ambient Intelligence Growth Rate (CAGR) by Country (US$ Million): 2019 VS 2023 VS 2030
Table 37. North America Location-based Ambient Intelligence Market Size by Country (2019-2024) & (US$ Million)
Table 38. North America Location-based Ambient Intelligence Market Size by Country (2025-2030) & (US$ Million)
Table 39. Europe Location-based Ambient Intelligence Market Size by Type (2019-2024) & (US$ Million)
Table 40. Europe Location-based Ambient Intelligence Market Size by Type (2025-2030) & (US$ Million)
Table 41. Europe Location-based Ambient Intelligence Market Size by Application (2019-2024) & (US$ Million)
Table 42. Europe Location-based Ambient Intelligence Market Size by Application (2025-2030) & (US$ Million)
Table 43. Europe Location-based Ambient Intelligence Growth Rate (CAGR) by Country (US$ Million): 2019 VS 2023 VS 2030
Table 44. Europe Location-based Ambient Intelligence Market Size by Country (2019-2024) & (US$ Million)
Table 45. Europe Location-based Ambient Intelligence Market Size by Country (2025-2030) & (US$ Million)
Table 46. China Location-based Ambient Intelligence Market Size by Type (2019-2024) & (US$ Million)
Table 47. China Location-based Ambient Intelligence Market Size by Type (2025-2030) & (US$ Million)
Table 48. China Location-based Ambient Intelligence Market Size by Application (2019-2024) & (US$ Million)
Table 49. China Location-based Ambient Intelligence Market Size by Application (2025-2030) & (US$ Million)
Table 50. Asia Location-based Ambient Intelligence Market Size by Type (2019-2024) & (US$ Million)
Table 51. Asia Location-based Ambient Intelligence Market Size by Type (2025-2030) & (US$ Million)
Table 52. Asia Location-based Ambient Intelligence Market Size by Application (2019-2024) & (US$ Million)
Table 53. Asia Location-based Ambient Intelligence Market Size by Application (2025-2030) & (US$ Million)
Table 54. Asia Location-based Ambient Intelligence Growth Rate (CAGR) by Region (US$ Million): 2019 VS 2023 VS 2030
Table 55. Asia Location-based Ambient Intelligence Market Size by Region (2019-2024) & (US$ Million)
Table 56. Asia Location-based Ambient Intelligence Market Size by Region (2025-2030) & (US$ Million)
Table 57. Middle East, Africa, and Latin America Location-based Ambient Intelligence Market Size by Type (2019-2024) & (US$ Million)
Table 58. Middle East, Africa, and Latin America Location-based Ambient Intelligence Market Size by Type (2025-2030) & (US$ Million)
Table 59. Middle East, Africa, and Latin America Location-based Ambient Intelligence Market Size by Application (2019-2024) & (US$ Million)
Table 60. Middle East, Africa, and Latin America Location-based Ambient Intelligence Market Size by Application (2025-2030) & (US$ Million)
Table 61. Middle East, Africa, and Latin America Location-based Ambient Intelligence Growth Rate (CAGR) by Country (US$ Million): 2019 VS 2023 VS 2030
Table 62. Middle East, Africa, and Latin America Location-based Ambient Intelligence Market Size by Country (2019-2024) & (US$ Million)
Table 63. Middle East, Africa, and Latin America Location-based Ambient Intelligence Market Size by Country (2025-2030) & (US$ Million)
Table 64. Google, LLC Company Details
Table 65. Google, LLC Business Overview
Table 66. Google, LLC Location-based Ambient Intelligence Product
Table 67. Google, LLC Revenue in Location-based Ambient Intelligence Business (2019-2024) & (US$ Million)
Table 68. Google, LLC Recent Developments
Table 69. Apple Company Details
Table 70. Apple Business Overview
Table 71. Apple Location-based Ambient Intelligence Product
Table 72. Apple Revenue in Location-based Ambient Intelligence Business (2019-2024) & (US$ Million)
Table 73. Apple Recent Developments
Table 74. IBM Company Details
Table 75. IBM Business Overview
Table 76. IBM Location-based Ambient Intelligence Product
Table 77. IBM Revenue in Location-based Ambient Intelligence Business (2019-2024) & (US$ Million)
Table 78. IBM Recent Developments
Table 79. Microsoft Company Details
Table 80. Microsoft Business Overview
Table 81. Microsoft Location-based Ambient Intelligence Product
Table 82. Microsoft Revenue in Location-based Ambient Intelligence Business (2019-2024) & (US$ Million)
Table 83. Microsoft Recent Developments
Table 84. Huawei Technologies Company Details
Table 85. Huawei Technologies Business Overview
Table 86. Huawei Technologies Location-based Ambient Intelligence Product
Table 87. Huawei Technologies Revenue in Location-based Ambient Intelligence Business (2019-2024) & (US$ Million)
Table 88. Huawei Technologies Recent Developments
Table 89. Baidu Company Details
Table 90. Baidu Business Overview
Table 91. Baidu Location-based Ambient Intelligence Product
Table 92. Baidu Revenue in Location-based Ambient Intelligence Business (2019-2024) & (US$ Million)
Table 93. Baidu Recent Developments
Table 94. Samsung Electronics Company Details
Table 95. Samsung Electronics Business Overview
Table 96. Samsung Electronics Location-based Ambient Intelligence Product
Table 97. Samsung Electronics Revenue in Location-based Ambient Intelligence Business (2019-2024) & (US$ Million)
Table 98. Samsung Electronics Recent Developments
Table 99. ABB Company Details
Table 100. ABB Business Overview
Table 101. ABB Location-based Ambient Intelligence Product
Table 102. ABB Revenue in Location-based Ambient Intelligence Business (2019-2024) & (US$ Million)
Table 103. ABB Recent Developments
Table 104. Johnson Controls Company Details
Table 105. Johnson Controls Business Overview
Table 106. Johnson Controls Location-based Ambient Intelligence Product
Table 107. Johnson Controls Revenue in Location-based Ambient Intelligence Business (2019-2024) & (US$ Million)
Table 108. Johnson Controls Recent Developments
Table 109. Nokia Company Details
Table 110. Nokia Business Overview
Table 111. Nokia Location-based Ambient Intelligence Product
Table 112. Nokia Revenue in Location-based Ambient Intelligence Business (2019-2024) & (US$ Million)
Table 113. Nokia Recent Developments
Table 114. Schneider Electric Company Details
Table 115. Schneider Electric Business Overview
Table 116. Schneider Electric Location-based Ambient Intelligence Product
Table 117. Schneider Electric Revenue in Location-based Ambient Intelligence Business (2019-2024) & (US$ Million)
Table 118. Schneider Electric Recent Developments
Table 119. Siemens AG Company Details
Table 120. Siemens AG Business Overview
Table 121. Siemens AG Location-based Ambient Intelligence Product
Table 122. Siemens AG Revenue in Location-based Ambient Intelligence Business (2019-2024) & (US$ Million)
Table 123. Siemens AG Recent Developments
Table 124. HTC Company Details
Table 125. HTC Business Overview
Table 126. HTC Location-based Ambient Intelligence Product
Table 127. HTC Revenue in Location-based Ambient Intelligence Business (2019-2024) & (US$ Million)
Table 128. HTC Recent Developments
Table 129. Research Programs/Design for This Report
Table 130. Key Data Information from Secondary Sources
Table 131. Key Data Information from Primary Sources
List of Figures
Figure 1. Global Location-based Ambient Intelligence Market Size Growth Rate by Type, 2019 VS 2023 VS 2030 (US$ Million)
Figure 2. Global Location-based Ambient Intelligence Market Share by Type: 2023 VS 2030
Figure 3. Hardware Features
Figure 4. Software Features
Figure 5. Services Features
Figure 6. Global Location-based Ambient Intelligence Market Size Growth Rate by Application, 2019 VS 2023 VS 2030 (US$ Million)
Figure 7. Global Location-based Ambient Intelligence Market Share by Application: 2023 VS 2030
Figure 8. BFSI Case Studies
Figure 9. Retail & E-commerce Case Studies
Figure 10. Manufacturing Case Studies
Figure 11. Government & Defence Case Studies
Figure 12. Energy & Utilities Case Studies
Figure 13. IT and Telecom Case Studies
Figure 14. Education Case Studies
Figure 15. Healthcare Case Studies
Figure 16. Others Case Studies
Figure 17. Location-based Ambient Intelligence Report Years Considered
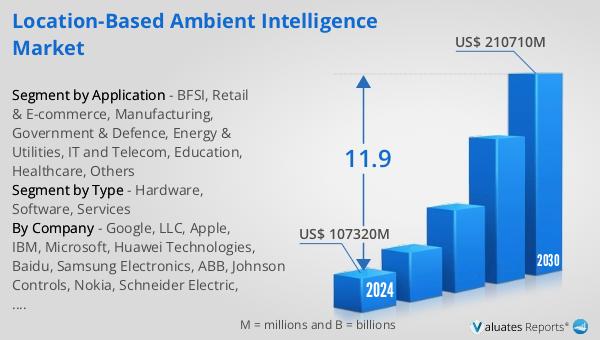
Figure 18. Global Location-based Ambient Intelligence Market Size (US$ Million), Year-over-Year: 2019-2030
Figure 19. Global Location-based Ambient Intelligence Market Size, (US$ Million), 2019 VS 2023 VS 2030
Figure 20. Global Location-based Ambient Intelligence Market Share by Region: 2023 VS 2030
Figure 21. Global Location-based Ambient Intelligence Market Share by Players in 2023
Figure 22. Global Top Location-based Ambient Intelligence Players by Company Type (Tier 1, Tier 2, and Tier 3) & (based on the Revenue in Location-based Ambient Intelligence as of 2023)
Figure 23. The Top 10 and 5 Players Market Share by Location-based Ambient Intelligence Revenue in 2023
Figure 24. North America Location-based Ambient Intelligence Market Size YoY Growth (2019-2030) & (US$ Million)
Figure 25. North America Location-based Ambient Intelligence Market Share by Type (2019-2030)
Figure 26. North America Location-based Ambient Intelligence Market Share by Application (2019-2030)
Figure 27. North America Location-based Ambient Intelligence Market Share by Country (2019-2030)
Figure 28. United States Location-based Ambient Intelligence Market Size YoY Growth (2019-2030) & (US$ Million)
Figure 29. Canada Location-based Ambient Intelligence Market Size YoY Growth (2019-2030) & (US$ Million)
Figure 30. Europe Location-based Ambient Intelligence Market Size YoY (2019-2030) & (US$ Million)
Figure 31. Europe Location-based Ambient Intelligence Market Share by Type (2019-2030)
Figure 32. Europe Location-based Ambient Intelligence Market Share by Application (2019-2030)
Figure 33. Europe Location-based Ambient Intelligence Market Share by Country (2019-2030)
Figure 34. Germany Location-based Ambient Intelligence Market Size YoY Growth (2019-2030) & (US$ Million)
Figure 35. France Location-based Ambient Intelligence Market Size YoY Growth (2019-2030) & (US$ Million)
Figure 36. U.K. Location-based Ambient Intelligence Market Size YoY Growth (2019-2030) & (US$ Million)
Figure 37. Italy Location-based Ambient Intelligence Market Size YoY Growth (2019-2030) & (US$ Million)
Figure 38. Russia Location-based Ambient Intelligence Market Size YoY Growth (2019-2030) & (US$ Million)
Figure 39. Nordic Countries Location-based Ambient Intelligence Market Size YoY Growth (2019-2030) & (US$ Million)
Figure 40. China Location-based Ambient Intelligence Market Size YoY (2019-2030) & (US$ Million)
Figure 41. China Location-based Ambient Intelligence Market Share by Type (2019-2030)
Figure 42. China Location-based Ambient Intelligence Market Share by Application (2019-2030)
Figure 43. Asia Location-based Ambient Intelligence Market Size YoY (2019-2030) & (US$ Million)
Figure 44. Asia Location-based Ambient Intelligence Market Share by Type (2019-2030)
Figure 45. Asia Location-based Ambient Intelligence Market Share by Application (2019-2030)
Figure 46. Asia Location-based Ambient Intelligence Market Share by Region (2019-2030)
Figure 47. Japan Location-based Ambient Intelligence Market Size YoY Growth (2019-2030) & (US$ Million)
Figure 48. South Korea Location-based Ambient Intelligence Market Size YoY Growth (2019-2030) & (US$ Million)
Figure 49. China Taiwan Location-based Ambient Intelligence Market Size YoY Growth (2019-2030) & (US$ Million)
Figure 50. Southeast Asia Location-based Ambient Intelligence Market Size YoY Growth (2019-2030) & (US$ Million)
Figure 51. India Location-based Ambient Intelligence Market Size YoY Growth (2019-2030) & (US$ Million)
Figure 52. Australia Location-based Ambient Intelligence Market Size YoY Growth (2019-2030) & (US$ Million)
Figure 53. Middle East, Africa, and Latin America Location-based Ambient Intelligence Market Size YoY (2019-2030) & (US$ Million)
Figure 54. Middle East, Africa, and Latin America Location-based Ambient Intelligence Market Share by Type (2019-2030)
Figure 55. Middle East, Africa, and Latin America Location-based Ambient Intelligence Market Share by Application (2019-2030)
Figure 56. Middle East, Africa, and Latin America Location-based Ambient Intelligence Market Share by Country (2019-2030)
Figure 57. Brazil Location-based Ambient Intelligence Market Size YoY Growth (2019-2030) & (US$ Million)
Figure 58. Mexico Location-based Ambient Intelligence Market Size YoY Growth (2019-2030) & (US$ Million)
Figure 59. Turkey Location-based Ambient Intelligence Market Size YoY Growth (2019-2030) & (US$ Million)
Figure 60. Saudi Arabia Location-based Ambient Intelligence Market Size YoY Growth (2019-2030) & (US$ Million)
Figure 61. Israel Location-based Ambient Intelligence Market Size YoY Growth (2019-2030) & (US$ Million)
Figure 62. GCC Countries Location-based Ambient Intelligence Market Size YoY Growth (2019-2030) & (US$ Million)
Figure 63. Google, LLC Revenue Growth Rate in Location-based Ambient Intelligence Business (2019-2024)
Figure 64. Apple Revenue Growth Rate in Location-based Ambient Intelligence Business (2019-2024)
Figure 65. IBM Revenue Growth Rate in Location-based Ambient Intelligence Business (2019-2024)
Figure 66. Microsoft Revenue Growth Rate in Location-based Ambient Intelligence Business (2019-2024)
Figure 67. Huawei Technologies Revenue Growth Rate in Location-based Ambient Intelligence Business (2019-2024)
Figure 68. Baidu Revenue Growth Rate in Location-based Ambient Intelligence Business (2019-2024)
Figure 69. Samsung Electronics Revenue Growth Rate in Location-based Ambient Intelligence Business (2019-2024)
Figure 70. ABB Revenue Growth Rate in Location-based Ambient Intelligence Business (2019-2024)
Figure 71. Johnson Controls Revenue Growth Rate in Location-based Ambient Intelligence Business (2019-2024)
Figure 72. Nokia Revenue Growth Rate in Location-based Ambient Intelligence Business (2019-2024)
Figure 73. Schneider Electric Revenue Growth Rate in Location-based Ambient Intelligence Business (2019-2024)
Figure 74. Siemens AG Revenue Growth Rate in Location-based Ambient Intelligence Business (2019-2024)
Figure 75. HTC Revenue Growth Rate in Location-based Ambient Intelligence Business (2019-2024)
Figure 76. Bottom-up and Top-down Approaches for This Report
Figure 77. Data Triangulation
Figure 78. Key Executives Interviewed