List of Tables
Table 1. Global AI Medical Imaging Solution Market Size Growth Rate by Type (US$ Million): 2021 vs 2025 vs 2032
Table 2. Key Players of Cloud and Web-Based Solutions
Table 3. Key Players of Local Solution
Table 4. Global AI Medical Imaging Solution Market Size Growth Rate by Imaging Modality Type (US$ Million): 2021 vs 2025 vs 2032
Table 5. Key Players of Ct-oriented Type
Table 6. Key Players of Mri-oriented Type
Table 7. Key Players of Multi-modality Fusion Type
Table 8. Key Players of Screening-oriented
Table 9. Key Players of Diagnostic Assistance
Table 10. Key Players of Others
Table 11. Global AI Medical Imaging Solution Market Size Growth by Application (US$ Million): 2021 vs 2025 vs 2032
Table 12. Global AI Medical Imaging Solution Market Size by Region (US$ Million): 2021 vs 2025 vs 2032
Table 13. Global AI Medical Imaging Solution Market Size by Region (US$ Million), 2021–2026
Table 14. Global AI Medical Imaging Solution Market Share by Region (2021–2026)
Table 15. Global AI Medical Imaging Solution Forecasted Market Size by Region (US$ Million), 2027–2032
Table 16. Global AI Medical Imaging Solution Market Share by Region (2027–2032)
Table 17. AI Medical Imaging Solution Market Trends
Table 18. AI Medical Imaging Solution Market Drivers
Table 19. AI Medical Imaging Solution Market Challenges
Table 20. AI Medical Imaging Solution Market Restraints
Table 21. Global AI Medical Imaging Solution Revenue by Players (US$ Million), 2021–2026
Table 22. Global AI Medical Imaging Solution Market Share by Players (2021–2026)
Table 23. Global Top AI Medical Imaging Solution Players by Tier (Tier 1, Tier 2, and Tier 3), based on AI Medical Imaging Solution Revenue, 2025
Table 24. Ranking of Global Top AI Medical Imaging Solution Companies by Revenue (US$ Million) in 2025
Table 25. Global 5 Largest Players Market Share by AI Medical Imaging Solution Revenue (CR5 and HHI), 2021–2026
Table 26. Global Key Players of AI Medical Imaging Solution, Headquarters and Area Served
Table 27. Global Key Players of AI Medical Imaging Solution, Products and Applications
Table 28. Global Key Players of AI Medical Imaging Solution, Date of General Availability (GA)
Table 29. Mergers and Acquisitions, Expansion Plans
Table 30. Global AI Medical Imaging Solution Market Size by Type (US$ Million), 2021–2026
Table 31. Global AI Medical Imaging Solution Revenue Market Share by Type (2021–2026)
Table 32. Global AI Medical Imaging Solution Forecasted Market Size by Type (US$ Million), 2027–2032
Table 33. Global AI Medical Imaging Solution Revenue Market Share by Type (2027–2032)
Table 34. Global AI Medical Imaging Solution Market Size by Application (US$ Million), 2021–2026
Table 35. Global AI Medical Imaging Solution Revenue Market Share by Application (2021–2026)
Table 36. Global AI Medical Imaging Solution Forecasted Market Size by Application (US$ Million), 2027–2032
Table 37. Global AI Medical Imaging Solution Revenue Market Share by Application (2027–2032)
Table 38. North America AI Medical Imaging Solution Market Size Growth Rate by Country (US$ Million): 2021 vs 2025 vs 2032
Table 39. North America AI Medical Imaging Solution Market Size by Country (US$ Million), 2021–2026
Table 40. North America AI Medical Imaging Solution Market Size by Country (US$ Million), 2027–2032
Table 41. Europe AI Medical Imaging Solution Market Size Growth Rate by Country (US$ Million): 2021 vs 2025 vs 2032
Table 42. Europe AI Medical Imaging Solution Market Size by Country (US$ Million), 2021–2026
Table 43. Europe AI Medical Imaging Solution Market Size by Country (US$ Million), 2027–2032
Table 44. Asia-Pacific AI Medical Imaging Solution Market Size Growth Rate by Region (US$ Million): 2021 vs 2025 vs 2032
Table 45. Asia-Pacific AI Medical Imaging Solution Market Size by Region (US$ Million), 2021–2026
Table 46. Asia-Pacific AI Medical Imaging Solution Market Size by Region (US$ Million), 2027–2032
Table 47. Latin America AI Medical Imaging Solution Market Size Growth Rate by Country (US$ Million): 2021 vs 2025 vs 2032
Table 48. Latin America AI Medical Imaging Solution Market Size by Country (US$ Million), 2021–2026
Table 49. Latin America AI Medical Imaging Solution Market Size by Country (US$ Million), 2027–2032
Table 50. Middle East & Africa AI Medical Imaging Solution Market Size Growth Rate by Country (US$ Million): 2021 vs 2025 vs 2032
Table 51. Middle East & Africa AI Medical Imaging Solution Market Size by Country (US$ Million), 2021–2026
Table 52. Middle East & Africa AI Medical Imaging Solution Market Size by Country (US$ Million), 2027–2032
Table 53. ScreenPoint Medical Company Details
Table 54. ScreenPoint Medical Business Overview
Table 55. ScreenPoint Medical AI Medical Imaging Solution Product
Table 56. ScreenPoint Medical Revenue in AI Medical Imaging Solution Business (US$ Million), 2021–2026
Table 57. ScreenPoint Medical Recent Development
Table 58. Volpara Solutions Company Details
Table 59. Volpara Solutions Business Overview
Table 60. Volpara Solutions AI Medical Imaging Solution Product
Table 61. Volpara Solutions Revenue in AI Medical Imaging Solution Business (US$ Million), 2021–2026
Table 62. Volpara Solutions Recent Development
Table 63. CureMetrix Company Details
Table 64. CureMetrix Business Overview
Table 65. CureMetrix AI Medical Imaging Solution Product
Table 66. CureMetrix Revenue in AI Medical Imaging Solution Business (US$ Million), 2021–2026
Table 67. CureMetrix Recent Development
Table 68. Densitas Company Details
Table 69. Densitas Business Overview
Table 70. Densitas AI Medical Imaging Solution Product
Table 71. Densitas Revenue in AI Medical Imaging Solution Business (US$ Million), 2021–2026
Table 72. Densitas Recent Development
Table 73. Enlitic Company Details
Table 74. Enlitic Business Overview
Table 75. Enlitic AI Medical Imaging Solution Product
Table 76. Enlitic Revenue in AI Medical Imaging Solution Business (US$ Million), 2021–2026
Table 77. Enlitic Recent Development
Table 78. Lunit Company Details
Table 79. Lunit Business Overview
Table 80. Lunit AI Medical Imaging Solution Product
Table 81. Lunit Revenue in AI Medical Imaging Solution Business (US$ Million), 2021–2026
Table 82. Lunit Recent Development
Table 83. Aidoc Company Details
Table 84. Aidoc Business Overview
Table 85. Aidoc AI Medical Imaging Solution Product
Table 86. Aidoc Revenue in AI Medical Imaging Solution Business (US$ Million), 2021–2026
Table 87. Aidoc Recent Development
Table 88. Contextflow Company Details
Table 89. Contextflow Business Overview
Table 90. Contextflow AI Medical Imaging Solution Product
Table 91. Contextflow Revenue in AI Medical Imaging Solution Business (US$ Million), 2021–2026
Table 92. Contextflow Recent Development
Table 93. Butterfly Network Company Details
Table 94. Butterfly Network Business Overview
Table 95. Butterfly Network AI Medical Imaging Solution Product
Table 96. Butterfly Network Revenue in AI Medical Imaging Solution Business (US$ Million), 2021–2026
Table 97. Butterfly Network Recent Development
Table 98. QView Medical Company Details
Table 99. QView Medical Business Overview
Table 100. QView Medical AI Medical Imaging Solution Product
Table 101. QView Medical Revenue in AI Medical Imaging Solution Business (US$ Million), 2021–2026
Table 102. QView Medical Recent Development
Table 103. Brainomix Company Details
Table 104. Brainomix Business Overview
Table 105. Brainomix AI Medical Imaging Solution Product
Table 106. Brainomix Revenue in AI Medical Imaging Solution Business (US$ Million), 2021–2026
Table 107. Brainomix Recent Development
Table 108. 4Quant Company Details
Table 109. 4Quant Business Overview
Table 110. 4Quant AI Medical Imaging Solution Product
Table 111. 4Quant Revenue in AI Medical Imaging Solution Business (US$ Million), 2021–2026
Table 112. 4Quant Recent Development
Table 113. Quibim Company Details
Table 114. Quibim Business Overview
Table 115. Quibim AI Medical Imaging Solution Product
Table 116. Quibim Revenue in AI Medical Imaging Solution Business (US$ Million), 2021–2026
Table 117. Quibim Recent Development
Table 118. Qure Company Details
Table 119. Qure Business Overview
Table 120. Qure AI Medical Imaging Solution Product
Table 121. Qure Revenue in AI Medical Imaging Solution Business (US$ Million), 2021–2026
Table 122. Qure Recent Development
Table 123. Methinks Company Details
Table 124. Methinks Business Overview
Table 125. Methinks AI Medical Imaging Solution Product
Table 126. Methinks Revenue in AI Medical Imaging Solution Business (US$ Million), 2021–2026
Table 127. Methinks Recent Development
Table 128. Blackford Analysis Company Details
Table 129. Blackford Analysis Business Overview
Table 130. Blackford Analysis AI Medical Imaging Solution Product
Table 131. Blackford Analysis Revenue in AI Medical Imaging Solution Business (US$ Million), 2021–2026
Table 132. Blackford Analysis Recent Development
Table 133. Behold Company Details
Table 134. Behold Business Overview
Table 135. Behold AI Medical Imaging Solution Product
Table 136. Behold Revenue in AI Medical Imaging Solution Business (US$ Million), 2021–2026
Table 137. Behold Recent Development
Table 138. Nanox Company Details
Table 139. Nanox Business Overview
Table 140. Nanox AI Medical Imaging Solution Product
Table 141. Nanox Revenue in AI Medical Imaging Solution Business (US$ Million), 2021–2026
Table 142. Nanox Recent Development
Table 143. Siemens Healthineers (AI-Rad Companion) Company Details
Table 144. Siemens Healthineers (AI-Rad Companion) Business Overview
Table 145. Siemens Healthineers (AI-Rad Companion) AI Medical Imaging Solution Product
Table 146. Siemens Healthineers (AI-Rad Companion) Revenue in AI Medical Imaging Solution Business (US$ Million), 2021–2026
Table 147. Siemens Healthineers (AI-Rad Companion) Recent Development
Table 148. Rad AI Company Details
Table 149. Rad AI Business Overview
Table 150. Rad AI AI Medical Imaging Solution Product
Table 151. Rad AI Revenue in AI Medical Imaging Solution Business (US$ Million), 2021–2026
Table 152. Rad AI Recent Development
Table 153. Harrison.ai Company Details
Table 154. Harrison.ai Business Overview
Table 155. Harrison.ai AI Medical Imaging Solution Product
Table 156. Harrison.ai Revenue in AI Medical Imaging Solution Business (US$ Million), 2021–2026
Table 157. Harrison.ai Recent Development
Table 158. Paxera UltimaAi Company Details
Table 159. Paxera UltimaAi Business Overview
Table 160. Paxera UltimaAi AI Medical Imaging Solution Product
Table 161. Paxera UltimaAi Revenue in AI Medical Imaging Solution Business (US$ Million), 2021–2026
Table 162. Paxera UltimaAi Recent Development
Table 163. Viz.ai Company Details
Table 164. Viz.ai Business Overview
Table 165. Viz.ai AI Medical Imaging Solution Product
Table 166. Viz.ai Revenue in AI Medical Imaging Solution Business (US$ Million), 2021–2026
Table 167. Viz.ai Recent Development
Table 168. Gleamer Company Details
Table 169. Gleamer Business Overview
Table 170. Gleamer AI Medical Imaging Solution Product
Table 171. Gleamer Revenue in AI Medical Imaging Solution Business (US$ Million), 2021–2026
Table 172. Gleamer Recent Development
Table 173. Arterys Company Details
Table 174. Arterys Business Overview
Table 175. Arterys AI Medical Imaging Solution Product
Table 176. Arterys Revenue in AI Medical Imaging Solution Business (US$ Million), 2021–2026
Table 177. Arterys Recent Development
Table 178. EnvoyAI Company Details
Table 179. EnvoyAI Business Overview
Table 180. EnvoyAI AI Medical Imaging Solution Product
Table 181. EnvoyAI Revenue in AI Medical Imaging Solution Business (US$ Million), 2021–2026
Table 182. EnvoyAI Recent Development
Table 183. ContextVision Company Details
Table 184. ContextVision Business Overview
Table 185. ContextVision AI Medical Imaging Solution Product
Table 186. ContextVision Revenue in AI Medical Imaging Solution Business (US$ Million), 2021–2026
Table 187. ContextVision Recent Development
Table 188. General Electric Company Details
Table 189. General Electric Business Overview
Table 190. General Electric AI Medical Imaging Solution Product
Table 191. General Electric Revenue in AI Medical Imaging Solution Business (US$ Million), 2021–2026
Table 192. General Electric Recent Development
Table 193. Fujifilm Company Details
Table 194. Fujifilm Business Overview
Table 195. Fujifilm AI Medical Imaging Solution Product
Table 196. Fujifilm Revenue in AI Medical Imaging Solution Business (US$ Million), 2021–2026
Table 197. Fujifilm Recent Development
Table 198. iCAD Company Details
Table 199. iCAD Business Overview
Table 200. iCAD AI Medical Imaging Solution Product
Table 201. iCAD Revenue in AI Medical Imaging Solution Business (US$ Million), 2021–2026
Table 202. iCAD Recent Development
Table 203. Nuance Communications Company Details
Table 204. Nuance Communications Business Overview
Table 205. Nuance Communications AI Medical Imaging Solution Product
Table 206. Nuance Communications Revenue in AI Medical Imaging Solution Business (US$ Million), 2021–2026
Table 207. Nuance Communications Recent Development
Table 208. Beijing Infervision Technology Company Details
Table 209. Beijing Infervision Technology Business Overview
Table 210. Beijing Infervision Technology AI Medical Imaging Solution Product
Table 211. Beijing Infervision Technology Revenue in AI Medical Imaging Solution Business (US$ Million), 2021–2026
Table 212. Beijing Infervision Technology Recent Development
Table 213. Beijing Shenrui Bolian Company Details
Table 214. Beijing Shenrui Bolian Business Overview
Table 215. Beijing Shenrui Bolian AI Medical Imaging Solution Product
Table 216. Beijing Shenrui Bolian Revenue in AI Medical Imaging Solution Business (US$ Million), 2021–2026
Table 217. Beijing Shenrui Bolian Recent Development
Table 218. RapidAI Company Details
Table 219. RapidAI Business Overview
Table 220. RapidAI AI Medical Imaging Solution Product
Table 221. RapidAI Revenue in AI Medical Imaging Solution Business (US$ Million), 2021–2026
Table 222. RapidAI Recent Development
Table 223. Research Programs/Design for This Report
Table 224. Key Data Information from Secondary Sources
Table 225. Key Data Information from Primary Sources
Table 226. Authors List of This Report
List of Figures
Figure 1. AI Medical Imaging Solution Picture
Figure 2. Global AI Medical Imaging Solution Market Size Comparison by Type (US$ Million), 2021–2032
Figure 3. Global AI Medical Imaging Solution Market Share by Type: 2025 vs 2032
Figure 4. Cloud and Web-Based Solutions Features
Figure 5. Local Solution Features
Figure 6. Global AI Medical Imaging Solution Market Size Comparison by Imaging Modality Type (US$ Million), 2021–2032
Figure 7. Ct-oriented Type Features
Figure 8. Mri-oriented Type Features
Figure 9. Multi-modality Fusion Type Features
Figure 10. Screening-oriented Features
Figure 11. Diagnostic Assistance Features
Figure 12. Others Features
Figure 13. Global AI Medical Imaging Solution Market Size by Application (US$ Million), 2021–2032
Figure 14. Global AI Medical Imaging Solution Market Share by Application: 2025 vs 2032
Figure 15. Oncology Case Studies
Figure 16. Neurology Case Studies
Figure 17. Orthopedics Case Studies
Figure 18. Cardiology Case Studies
Figure 19. Respiratory System Case Studies
Figure 20. Others Case Studies
Figure 21. AI Medical Imaging Solution Report Years Considered
Figure 22. Global AI Medical Imaging Solution Market Size (US$ Million), Year-over-Year: 2021–2032
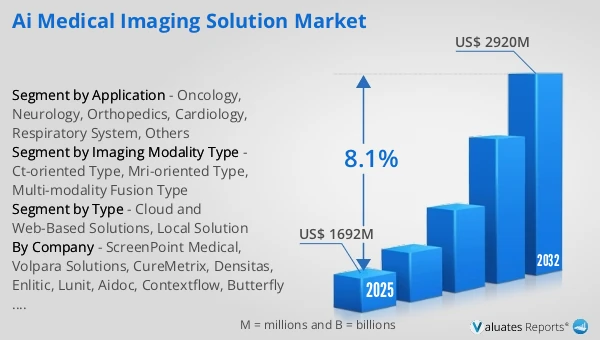
Figure 23. Global AI Medical Imaging Solution Market Size, (US$ Million), 2021 vs 2025 vs 2032
Figure 24. Global AI Medical Imaging Solution Market Share by Region: 2025 vs 2032
Figure 25. Global AI Medical Imaging Solution Market Share by Players in 2025
Figure 26. Global AI Medical Imaging Solution Market Share by Company Type (Tier 1, Tier 2, and Tier 3)
Figure 27. The Top 10 and 5 Players Market Share by AI Medical Imaging Solution Revenue in 2025
Figure 28. North America AI Medical Imaging Solution Market Size YoY Growth (US$ Million), 2021–2032
Figure 29. North America AI Medical Imaging Solution Market Share by Country (2021–2032)
Figure 30. United States AI Medical Imaging Solution Market Size YoY Growth (US$ Million), 2021–2032
Figure 31. Canada AI Medical Imaging Solution Market Size YoY Growth (US$ Million), 2021–2032
Figure 32. Europe AI Medical Imaging Solution Market Size YoY Growth (US$ Million), 2021–2032
Figure 33. Europe AI Medical Imaging Solution Market Share by Country (2021–2032)
Figure 34. Germany AI Medical Imaging Solution Market Size YoY Growth (US$ Million), 2021–2032
Figure 35. France AI Medical Imaging Solution Market Size YoY Growth (US$ Million), 2021–2032
Figure 36. U.K. AI Medical Imaging Solution Market Size YoY Growth (US$ Million), 2021–2032
Figure 37. Italy AI Medical Imaging Solution Market Size YoY Growth (US$ Million), 2021–2032
Figure 38. Russia AI Medical Imaging Solution Market Size YoY Growth (US$ Million), 2021–2032
Figure 39. Ireland AI Medical Imaging Solution Market Size YoY Growth (US$ Million), 2021–2032
Figure 40. Asia-Pacific AI Medical Imaging Solution Market Size YoY Growth (US$ Million), 2021–2032
Figure 41. Asia-Pacific AI Medical Imaging Solution Market Share by Region (2021–2032)
Figure 42. China AI Medical Imaging Solution Market Size YoY Growth (US$ Million), 2021–2032
Figure 43. Japan AI Medical Imaging Solution Market Size YoY Growth (US$ Million), 2021–2032
Figure 44. South Korea AI Medical Imaging Solution Market Size YoY Growth (US$ Million), 2021–2032
Figure 45. Southeast Asia AI Medical Imaging Solution Market Size YoY Growth (US$ Million), 2021–2032
Figure 46. India AI Medical Imaging Solution Market Size YoY Growth (US$ Million), 2021–2032
Figure 47. Australia & New Zealand AI Medical Imaging Solution Market Size YoY Growth (US$ Million), 2021–2032
Figure 48. Latin America AI Medical Imaging Solution Market Size YoY Growth (US$ Million), 2021–2032
Figure 49. Latin America AI Medical Imaging Solution Market Share by Country (2021–2032)
Figure 50. Mexico AI Medical Imaging Solution Market Size YoY Growth (US$ Million), 2021–2032
Figure 51. Brazil AI Medical Imaging Solution Market Size YoY Growth (US$ Million), 2021–2032
Figure 52. Middle East & Africa AI Medical Imaging Solution Market Size YoY Growth (US$ Million), 2021–2032
Figure 53. Middle East & Africa AI Medical Imaging Solution Market Share by Country (2021–2032)
Figure 54. Israel AI Medical Imaging Solution Market Size YoY Growth (US$ Million), 2021–2032
Figure 55. Saudi Arabia AI Medical Imaging Solution Market Size YoY Growth (US$ Million), 2021–2032
Figure 56. UAE AI Medical Imaging Solution Market Size YoY Growth (US$ Million), 2021–2032
Figure 57. ScreenPoint Medical Revenue Growth Rate in AI Medical Imaging Solution Business (2021–2026)
Figure 58. Volpara Solutions Revenue Growth Rate in AI Medical Imaging Solution Business (2021–2026)
Figure 59. CureMetrix Revenue Growth Rate in AI Medical Imaging Solution Business (2021–2026)
Figure 60. Densitas Revenue Growth Rate in AI Medical Imaging Solution Business (2021–2026)
Figure 61. Enlitic Revenue Growth Rate in AI Medical Imaging Solution Business (2021–2026)
Figure 62. Lunit Revenue Growth Rate in AI Medical Imaging Solution Business (2021–2026)
Figure 63. Aidoc Revenue Growth Rate in AI Medical Imaging Solution Business (2021–2026)
Figure 64. Contextflow Revenue Growth Rate in AI Medical Imaging Solution Business (2021–2026)
Figure 65. Butterfly Network Revenue Growth Rate in AI Medical Imaging Solution Business (2021–2026)
Figure 66. QView Medical Revenue Growth Rate in AI Medical Imaging Solution Business (2021–2026)
Figure 67. Brainomix Revenue Growth Rate in AI Medical Imaging Solution Business (2021–2026)
Figure 68. 4Quant Revenue Growth Rate in AI Medical Imaging Solution Business (2021–2026)
Figure 69. Quibim Revenue Growth Rate in AI Medical Imaging Solution Business (2021–2026)
Figure 70. Qure Revenue Growth Rate in AI Medical Imaging Solution Business (2021–2026)
Figure 71. Methinks Revenue Growth Rate in AI Medical Imaging Solution Business (2021–2026)
Figure 72. Blackford Analysis Revenue Growth Rate in AI Medical Imaging Solution Business (2021–2026)
Figure 73. Behold Revenue Growth Rate in AI Medical Imaging Solution Business (2021–2026)
Figure 74. Nanox Revenue Growth Rate in AI Medical Imaging Solution Business (2021–2026)
Figure 75. Siemens Healthineers (AI-Rad Companion) Revenue Growth Rate in AI Medical Imaging Solution Business (2021–2026)
Figure 76. Rad AI Revenue Growth Rate in AI Medical Imaging Solution Business (2021–2026)
Figure 77. Harrison.ai Revenue Growth Rate in AI Medical Imaging Solution Business (2021–2026)
Figure 78. Paxera UltimaAi Revenue Growth Rate in AI Medical Imaging Solution Business (2021–2026)
Figure 79. Viz.ai Revenue Growth Rate in AI Medical Imaging Solution Business (2021–2026)
Figure 80. Gleamer Revenue Growth Rate in AI Medical Imaging Solution Business (2021–2026)
Figure 81. Arterys Revenue Growth Rate in AI Medical Imaging Solution Business (2021–2026)
Figure 82. EnvoyAI Revenue Growth Rate in AI Medical Imaging Solution Business (2021–2026)
Figure 83. ContextVision Revenue Growth Rate in AI Medical Imaging Solution Business (2021–2026)
Figure 84. General Electric Revenue Growth Rate in AI Medical Imaging Solution Business (2021–2026)
Figure 85. Fujifilm Revenue Growth Rate in AI Medical Imaging Solution Business (2021–2026)
Figure 86. iCAD Revenue Growth Rate in AI Medical Imaging Solution Business (2021–2026)
Figure 87. Nuance Communications Revenue Growth Rate in AI Medical Imaging Solution Business (2021–2026)
Figure 88. Beijing Infervision Technology Revenue Growth Rate in AI Medical Imaging Solution Business (2021–2026)
Figure 89. Beijing Shenrui Bolian Revenue Growth Rate in AI Medical Imaging Solution Business (2021–2026)
Figure 90. RapidAI Revenue Growth Rate in AI Medical Imaging Solution Business (2021–2026)
Figure 91. Bottom-up and Top-down Approaches for This Report
Figure 92. Data Triangulation
Figure 93. Key Executives Interviewed