
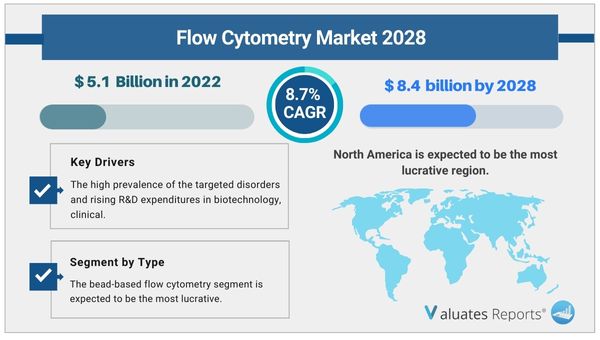
The global market for Flow Cytometry estimated at USD 5.1 billion in the year 2022, is projected to reach a revised size of USD 8.4 billion by 2028, growing at a CAGR of 8.7% during the forecast period 2022-2028.
The high frequency of the targeted illnesses and increased R&D spending in biotechnology, clinical, and life science research are expected to significantly fuel Flow Cytometry market expansion throughout the projection period.
Increased R&D efforts by many notable players for the development of multicolor assays and cutting-edge analytical reagents are propelling the flow cytometry market. The increased incidence of chronic and infectious diseases, particularly the COVID-19 outbreak, has caused the flow cytometry market to rapidly expand. Additionally, it is projected that the prevalence of diseases like cancer and HIV would rise, which will boost the growth of the Flow Cytometry market.
The growth of the flow cytometry market is anticipated to be fueled by advances in flow cytometry technology. Major competitors in the worldwide flow cytometry market are increasingly concentrating on the development and marketing of technologically advanced flow cytometry systems with streamlined workflows, straightforward operations, and quicker turnaround times. Such innovative products are predicted to experience a large increase in demand throughout the projection period, particularly in developed economies where the adoption rate of technologically cutting-edge products is high.
Immunodeficiency and rising cancer rates are anticipated to drive the flow cytometry market. The use of flow cytometry is common in the diagnosis of immunodeficiency and cancer. The increased prevalence of several ailments is one of the factors projected to fuel the Flow Cytometry market over the forecast period. The development of this sector has also been influenced by the fact that doctors now choose autologous and allogeneic stem cell therapies more than chemotherapy and radiation therapy in the treatment of cancer.
Initiatives for public-private funding in stem cell research are anticipated to grow the Flow Cytometry market. The rising use of stem cells to treat a variety of diseases and the abundance of stem cell product pipelines, along with the supportive regulatory environment in emerging nations, are some of the drivers driving global stem cell research activities. This is also supported by the expanding number of research projects and funding assistance from public and commercial organizations in the stem cell research sector.
The most profitable region is anticipated to be North America. The high prevalence of HIV/AIDS and cancer, the presence of a supportive business environment, growing government support through funds and grants, the development of treatment options for target diseases (such as cancer and immunological disorders), and the dominance of key players are all factors contributing to the growth of the flow cytometry market in the region.
Based on type, The market for bead-based flow cytometry is anticipated to be the most profitable. This is due to the fact that it efficiently analyses numerous samples at once and is frequently employed in research applications.
Based on application, The most lucrative sectors are anticipated to be academic and research institutions. The growing focus on assay development for cutting-edge applications by academic institutions is what fuels demand flow cytometry products in this end-user category.
High-impact rendering factors and drivers have been studied in this report to aid the readers to understand the general development. Moreover, the report includes restraints and challenges that may act as stumbling blocks on the way of the players. This will assist the users to be attentive and make informed decisions related to business. Specialists have also laid their focus on the upcoming business prospects.
The readers in the section will understand how the Flow Cytometry market scenario changed across the globe during the pandemic, post-pandemic and Russia-Ukraine War. The study is done keeping in view the changes in aspects such as demand, consumption, transportation, consumer behavior, supply chain management, export and import, and production. The industry experts have also highlighted the key factors that will help create opportunities for players and stabilize the overall industry in the years to come.
Informative and detailed data, sales, revenue, average price, historical and forecast data, which is analyzed to tell you why your market is set to change. Provision of market value (USD million) data for each segment and sub-segment.
This report will help stakeholders to understand the global industry status and trends of Flow Cytometry and provides them with information on key market drivers, restraints, challenges, and opportunities. This enables you to anticipate market changes to remain ahead of your competitors.
This report will help stakeholders to understand competitors better and gain more insights to strengthen their position in their businesses. The competitive landscape section includes the market share and rank (in volume and value), competitor ecosystem, new product development, expansion, and acquisition. This concise analysis, clear graph, and table format will enable you to pinpoint the information you require quickly.
This report helps stakeholders to understand the COVID-19 and Russia-Ukraine War Influence on the Flow Cytometry industry. Keeping in mind the uncertainties of COVID-19 and Russia-Ukraine War, we are continuously tracking and evaluating the direct as well as the indirect influence of the pandemic on different end use sectors. These insights are included in the report as a major market contributor.
|
Report Metric |
Details |
|
Report Name |
Flow Cytometry Market |
|
The market size in 2022 |
USD 5.1 Billion |
|
The revenue forecast in 2028 |
USD 8.4 Billion |
|
Growth Rate |
Compound Annual Growth Rate (CAGR) of 8.7% from 2022 to 2028 |
|
Market size available for years |
2022-2028 |
|
Forecast units |
Value (USD) |
|
Segments covered |
By Type, Application, and Region |
|
Report coverage |
Revenue & volume forecast, company share, competitive landscape, growth factors, and trends |
|
Geographic regions covered |
North America, Europe, Asia Pacific, Latin America, Middle East & Africa |
Ans. The global market for Flow Cytometry estimated at US$ 5.1 billion in the year 2022, is projected to reach a revised size of US$ 8.4 billion by 2028, growing at a CAGR of 8.7% during the forecast period 2022-2028.
Ans. The global Flow Cytometry market is expected to grow at a compound annual growth rate of 8.7% from 2022 to 2028.
Ans. Beckman Coulter, Sysmex, Agilent Technologies, Merck, Apogee, Bio-Rad Laboratories, Thermo Fisher, Stratedigm, Luminex, Miltenyi Biotec, GE.
Table of content:
1 Flow Cytometry Market Overview
1.1 Flow Cytometry Product Overview
1.2 Flow Cytometry Market Segment by Type
1.2.1 Cell-Based Flow Cytometry
1.2.2 Bead-Based Flow Cytometry
1.3 Global Flow Cytometry Market Size by Type
1.3.1 Global Flow Cytometry Market Size Overview by Type (2017-2028)
1.3.2 Global Flow Cytometry Historic Market Size Review by Type (2017-2022)
1.3.2.1 Global Flow Cytometry Sales Breakdown in Volume by Type (2017-2022)
1.3.2.2 Global Flow Cytometry Sales Breakdown in Value by Type (2017-2022)
1.3.2.3 Global Flow Cytometry Average Selling Price (ASP) by Type (2017-2022)
1.3.3 Global Flow Cytometry Forecasted Market Size by Type (2023-2028)
1.3.3.1 Global Flow Cytometry Sales Breakdown in Volume by Type (2023-2028)
1.3.3.2 Global Flow Cytometry Sales Breakdown in Value by Type (2023-2028)
1.3.3.3 Global Flow Cytometry Average Selling Price (ASP) by Type (2023-2028)
1.4 Key Regions Market Size Segment by Type
1.4.1 North America Flow Cytometry Sales Breakdown by Type (2017-2022)
1.4.2 Europe Flow Cytometry Sales Breakdown by Type (2017-2022)
1.4.3 Asia-Pacific Flow Cytometry Sales Breakdown by Type (2017-2022)
1.4.4 Latin America Flow Cytometry Sales Breakdown by Type (2017-2022)
1.4.5 Middle East and Africa Flow Cytometry Sales Breakdown by Type (2017-2022)
2 Global Flow Cytometry Market Competition by Company
2.1 Global Top Players by Flow Cytometry Sales (2017-2022)
2.2 Global Top Players by Flow Cytometry Revenue (2017-2022)
2.3 Global Top Players Flow Cytometry Price (2017-2022)
2.4 Global Top Manufacturers Flow Cytometry Manufacturing Base Distribution, Sales Area, Product Type
2.5 Flow Cytometry Market Competitive Situation and Trends
2.5.1 Flow Cytometry Market Concentration Rate (2017-2022)
2.5.2 Global 5 and 10 Largest Manufacturers by Flow Cytometry Sales and Revenue in 2021
2.6 Global Top Manufacturers by Company Type (Tier 1, Tier 2 and Tier 3) & (based on the Revenue in Flow Cytometry as of 2021)
2.7 Date of Key Manufacturers Enter into Flow Cytometry Market
2.8 Key Manufacturers Flow Cytometry Product Offered
2.9 Mergers & Acquisitions, Expansion
3 Flow Cytometry Status and Outlook by Region
3.1 Global Flow Cytometry Market Size and CAGR by Region: 2017 VS 2021 VS 2028
3.2 Global Flow Cytometry Historic Market Size by Region
3.2.1 Global Flow Cytometry Sales in Volume by Region (2017-2022)
3.2.2 Global Flow Cytometry Sales in Value by Region (2017-2022)
3.2.3 Global Flow Cytometry Sales (Volume & Value) Price and Gross Margin (2017-2022)
3.3 Global Flow Cytometry Forecasted Market Size by Region
3.3.1 Global Flow Cytometry Sales in Volume by Region (2023-2028)
3.3.2 Global Flow Cytometry Sales in Value by Region (2023-2028)
3.3.3 Global Flow Cytometry Sales (Volume & Value), Price and Gross Margin (2023-2028)
4 Global Flow Cytometry by Application
4.1 Flow Cytometry Market Segment by Application
4.1.1 Academic & research institutes
4.1.2 Hospitals & clinical testing laboratories
4.1.3 Pharmaceutical & biotechnology companies
4.2 Global Flow Cytometry Market Size by Application
4.2.1 Global Flow Cytometry Market Size Overview by Application (2017-2028)
4.2.2 Global Flow Cytometry Historic Market Size Review by Application (2017-2022)
4.2.2.1 Global Flow Cytometry Sales Breakdown in Volume, by Application (2017-2022)
4.2.2.2 Global Flow Cytometry Sales Breakdown in Value, by Application (2017-2022)
4.2.2.3 Global Flow Cytometry Average Selling Price (ASP) by Application (2017-2022)
4.2.3 Global Flow Cytometry Forecasted Market Size by Application (2023-2028)
4.2.3.1 Global Flow Cytometry Sales Breakdown in Volume, by Application (2023-2028)
4.2.3.2 Global Flow Cytometry Sales Breakdown in Value, by Application (2023-2028)
4.2.3.3 Global Flow Cytometry Average Selling Price (ASP) by Application (2023-2028)
4.3 Key Regions Market Size Segment by Application
4.3.1 North America Flow Cytometry Sales Breakdown by Application (2017-2022)
4.3.2 Europe Flow Cytometry Sales Breakdown by Application (2017-2022)
4.3.3 Asia-Pacific Flow Cytometry Sales Breakdown by Application (2017-2022)
4.3.4 Latin America Flow Cytometry Sales Breakdown by Application (2017-2022)
4.3.5 Middle East and Africa Flow Cytometry Sales Breakdown by Application (2017-2022)
5 North America Flow Cytometry by Country
5.1 North America Flow Cytometry Historic Market Size by Country
5.1.1 North America Flow Cytometry Sales in Volume by Country (2017-2022)
5.1.2 North America Flow Cytometry Sales in Value by Country (2017-2022)
5.2 North America Flow Cytometry Forecasted Market Size by Country
5.2.1 North America Flow Cytometry Sales in Volume by Country (2023-2028)
5.2.2 North America Flow Cytometry Sales in Value by Country (2023-2028)
6 Europe Flow Cytometry by Country
6.1 Europe Flow Cytometry Historic Market Size by Country
6.1.1 Europe Flow Cytometry Sales in Volume by Country (2017-2022)
6.1.2 Europe Flow Cytometry Sales in Value by Country (2017-2022)
6.2 Europe Flow Cytometry Forecasted Market Size by Country
6.2.1 Europe Flow Cytometry Sales in Volume by Country (2023-2028)
6.2.2 Europe Flow Cytometry Sales in Value by Country (2023-2028)
7 Asia-Pacific Flow Cytometry by Region
7.1 Asia-Pacific Flow Cytometry Historic Market Size by Region
7.1.1 Asia-Pacific Flow Cytometry Sales in Volume by Region (2017-2022)
7.1.2 Asia-Pacific Flow Cytometry Sales in Value by Region (2017-2022)
7.2 Asia-Pacific Flow Cytometry Forecasted Market Size by Region
7.2.1 Asia-Pacific Flow Cytometry Sales in Volume by Region (2023-2028)
7.2.2 Asia-Pacific Flow Cytometry Sales in Value by Region (2023-2028)
8 Latin America Flow Cytometry by Country
8.1 Latin America Flow Cytometry Historic Market Size by Country
8.1.1 Latin America Flow Cytometry Sales in Volume by Country (2017-2022)
8.1.2 Latin America Flow Cytometry Sales in Value by Country (2017-2022)
8.2 Latin America Flow Cytometry Forecasted Market Size by Country
8.2.1 Latin America Flow Cytometry Sales in Volume by Country (2023-2028)
8.2.2 Latin America Flow Cytometry Sales in Value by Country (2023-2028)
9 Middle East and Africa Flow Cytometry by Country
9.1 Middle East and Africa Flow Cytometry Historic Market Size by Country
9.1.1 Middle East and Africa Flow Cytometry Sales in Volume by Country (2017-2022)
9.1.2 Middle East and Africa Flow Cytometry Sales in Value by Country (2017-2022)
9.2 Middle East and Africa Flow Cytometry Forecasted Market Size by Country
9.2.1 Middle East and Africa Flow Cytometry Sales in Volume by Country (2023-2028)
9.2.2 Middle East and Africa Flow Cytometry Sales in Value by Country (2023-2028)
10 Company Profiles and Key Figures in Flow Cytometry Business
10.1 Beckman Coulter
10.1.1 Beckman Coulter Corporation Information
10.1.2 Beckman Coulter Introduction and Business Overview
10.1.3 Beckman Coulter Flow Cytometry Sales, Revenue and Gross Margin (2017-2022)
10.1.4 Beckman Coulter Flow Cytometry Products Offered
10.1.5 Beckman Coulter Recent Development
10.2 Sysmex
10.2.1 Sysmex Corporation Information
10.2.2 Sysmex Introduction and Business Overview
10.2.3 Sysmex Flow Cytometry Sales, Revenue and Gross Margin (2017-2022)
10.2.4 Sysmex Flow Cytometry Products Offered
10.2.5 Sysmex Recent Development
10.3 Agilent Technologies
10.3.1 Agilent Technologies Corporation Information
10.3.2 Agilent Technologies Introduction and Business Overview
10.3.3 Agilent Technologies Flow Cytometry Sales, Revenue and Gross Margin (2017-2022)
10.3.4 Agilent Technologies Flow Cytometry Products Offered
10.3.5 Agilent Technologies Recent Development
10.4 Merck
10.4.1 Merck Corporation Information
10.4.2 Merck Introduction and Business Overview
10.4.3 Merck Flow Cytometry Sales, Revenue and Gross Margin (2017-2022)
10.4.4 Merck Flow Cytometry Products Offered
10.4.5 Merck Recent Development
10.5 Apogee
10.5.1 Apogee Corporation Information
10.5.2 Apogee Introduction and Business Overview
10.5.3 Apogee Flow Cytometry Sales, Revenue and Gross Margin (2017-2022)
10.5.4 Apogee Flow Cytometry Products Offered
10.5.5 Apogee Recent Development
10.6 Bio-Rad Laboratories
10.6.1 Bio-Rad Laboratories Corporation Information
10.6.2 Bio-Rad Laboratories Introduction and Business Overview
10.6.3 Bio-Rad Laboratories Flow Cytometry Sales, Revenue and Gross Margin (2017-2022)
10.6.4 Bio-Rad Laboratories Flow Cytometry Products Offered
10.6.5 Bio-Rad Laboratories Recent Development
10.7 Thermo Fisher
10.7.1 Thermo Fisher Corporation Information
10.7.2 Thermo Fisher Introduction and Business Overview
10.7.3 Thermo Fisher Flow Cytometry Sales, Revenue and Gross Margin (2017-2022)
10.7.4 Thermo Fisher Flow Cytometry Products Offered
10.7.5 Thermo Fisher Recent Development
10.8 Stratedigm
10.8.1 Stratedigm Corporation Information
10.8.2 Stratedigm Introduction and Business Overview
10.8.3 Stratedigm Flow Cytometry Sales, Revenue and Gross Margin (2017-2022)
10.8.4 Stratedigm Flow Cytometry Products Offered
10.8.5 Stratedigm Recent Development
10.9 Luminex
10.9.1 Luminex Corporation Information
10.9.2 Luminex Introduction and Business Overview
10.9.3 Luminex Flow Cytometry Sales, Revenue and Gross Margin (2017-2022)
10.9.4 Luminex Flow Cytometry Products Offered
10.9.5 Luminex Recent Development
10.10 Miltenyi Biotec
10.10.1 Miltenyi Biotec Corporation Information
10.10.2 Miltenyi Biotec Introduction and Business Overview
10.10.3 Miltenyi Biotec Flow Cytometry Sales, Revenue and Gross Margin (2017-2022)
10.10.4 Miltenyi Biotec Flow Cytometry Products Offered
10.10.5 Miltenyi Biotec Recent Development
10.11 GE
10.11.1 GE Corporation Information
10.11.2 GE Introduction and Business Overview
10.11.3 GE Flow Cytometry Sales, Revenue and Gross Margin (2017-2022)
10.11.4 GE Flow Cytometry Products Offered
10.11.5 GE Recent Development
11 Upstream, Opportunities, Challenges, Risks and Influences Factors Analysis
11.1 Flow Cytometry Key Raw Materials
11.1.1 Key Raw Materials
11.1.2 Key Raw Materials Price
11.1.3 Raw Materials Key Suppliers
11.2 Manufacturing Cost Structure
11.2.1 Raw Materials
11.2.2 Labor Cost
11.2.3 Manufacturing Expenses
11.3 Flow Cytometry Industrial Chain Analysis
11.4 Flow Cytometry Market Dynamics
11.4.1 Flow Cytometry Industry Trends
11.4.2 Flow Cytometry Market Drivers
11.4.3 Flow Cytometry Market Challenges
11.4.4 Flow Cytometry Market Restraints
12 Market Strategy Analysis, Distributors
12.1 Sales Channel
12.2 Flow Cytometry Distributors
12.3 Flow Cytometry Downstream Customers
13 Research Findings and Conclusion
14 Appendix
14.1 Research Methodology
14.1.1 Methodology/Research Approach
14.1.1.1 Research Programs/Design
14.1.1.2 Market Size Estimation
14.1.1.3 Market Breakdown and Data Triangulation
14.1.2 Data Source
14.1.2.1 Secondary Sources
14.1.2.2 Primary Sources
14.2 Author Details
14.3 Disclaimer
Table of Figures:
List of Tables
Table 1. Major Company of Cell-Based Flow Cytometry
Table 2. Major Company of Bead-Based Flow Cytometry
Table 3. Global Flow Cytometry Sales by Type 2017 VS 2021 VS 2028 (US$ Million)
Table 4. Global Flow Cytometry Sales by Type (2017-2022) & (K Units)
Table 5. Global Flow Cytometry Sales Market Share in Volume by Type (2017-2022)
Table 6. Global Flow Cytometry Sales by Type (2017-2022) & (US& Million)
Table 7. Global Flow Cytometry Market Share in Value by Type (2017-2022)
Table 8. Global Flow Cytometry Price by Type (2017-2022) & (USD/Unit)
Table 9. Global Flow Cytometry Sales by Type (2023-2028) & (K Units)
Table 10. Global Flow Cytometry Sales Market Share in Volume by Type (2023-2028)
Table 11. Global Flow Cytometry Sales by Type (2023-2028) & (US$ Million)
Table 12. Global Flow Cytometry Sales Market Share in Value by Type (2023-2028)
Table 13. Global Flow Cytometry Price by Type (2023-2028) & (USD/Unit)
Table 14. North America Flow Cytometry Sales by Type (2017-2022) & (K Units)
Table 15. North America Flow Cytometry Sales by Type (2017-2022) & (US$ Million)
Table 16. Europe Flow Cytometry Sales (K Units) by Type (2017-2022)
Table 17. Europe Flow Cytometry Sales by Type (2017-2022) & (US$ Million)
Table 18. Asia-Pacific Flow Cytometry Sales (K Units) by Type (2017-2022)
Table 19. Asia-Pacific Flow Cytometry Sales by Type (2017-2022) & (US$ Million)
Table 20. Latin America Flow Cytometry Sales (K Units) by Type (2017-2022)
Table 21. Latin America Flow Cytometry Sales by Type (2017-2022) & (US$ Million)
Table 22. Middle East and Africa Flow Cytometry Sales (K Units) by Type (2017-2022)
Table 23. Middle East and Africa Flow Cytometry Sales by Type (2017-2022) & (US$ Million)
Table 24. Global Flow Cytometry Sales by Company (2017-2022) & (K Units)
Table 25. Global Flow Cytometry Sales Share by Company (2017-2022)
Table 26. Global Flow Cytometry Revenue by Company (2017-2022) & (US$ Million)
Table 27. Global Flow Cytometry Revenue Share by Company (2017-2022)
Table 28. Global Market Flow Cytometry Price by Company (2017-2022) & (USD/Unit)
Table 29. Global Flow Cytometry Top Manufacturers Manufacturing Base Distribution and Sales Area
Table 30. Global Flow Cytometry Manufacturers Market Concentration Ratio (CR5 and HHI)
Table 31. Global Top Manufacturers Market Share by Company Type (Tier 1, Tier 2 and Tier 3) & (based on the Revenue in Flow Cytometry as of 2021)
Table 32. Date of Key Manufacturers Enter into Flow Cytometry Market
Table 33. Key Manufacturers Flow Cytometry Product Type
Table 34. Mergers & Acquisitions, Expansion Plans
Table 35. Global Flow Cytometry Market Size Comparison by Region (US$ Million): 2017 VS 2021 VS 2028
Table 36. Global Flow Cytometry Sales by Region (2017-2022) & (K Units)
Table 37. Global Flow Cytometry Sales Market Share in Volume by Region (2017-2022)
Table 38. Global Flow Cytometry Sales by Region (2017-2022) & (US$ Million)
Table 39. Global Flow Cytometry Sales Market Share in Value by Region (2017-2022)
Table 40. Global Flow Cytometry Sales (K Units), Revenue (US$ Million), Price (USD/Unit) and Gross Margin (2017-2022)
Table 41. Global Flow Cytometry Sales by Region (2023-2028) & (K Units)
Table 42. Global Flow Cytometry Sales Market Share in Volume by Region (2023-2028)
Table 43. Global Flow Cytometry Sales by Region (2023-2028) & (US$ Million)
Table 44. Global Flow Cytometry Sales Market Share in Value by Region (2023-2028)
Table 45. Global Flow Cytometry Sales (K Units), Revenue (US$ Million), Price (USD/Unit) and Gross Margin (2023-2028)
Table 46. Global Flow Cytometry Sales by Application: 2017 VS 2021 VS 2028 (US$ Million)
Table 47. Global Flow Cytometry Sales by Application (2017-2022) & (K Units)
Table 48. Global Flow Cytometry Sales Market Share in Volume by Application (2017-2022)
Table 49. Global Flow Cytometry Sales by Application (2017-2022) & (US$ Million)
Table 50. Global Flow Cytometry Sales Market Share in Value by Application (2017-2022)
Table 51. Global Flow Cytometry Price by Application (2017-2022) & (USD/Unit)
Table 52. Global Flow Cytometry Sales by Application (2023-2028) & (K Units)
Table 53. Global Flow Cytometry Sales Market Share in Volume by Application (2023-2028)
Table 54. Global Flow Cytometry Sales by Application (2023-2028) & (US$ Million)
Table 55. Global Flow Cytometry Sales Market Share in Value by Application (2023-2028)
Table 56. Global Flow Cytometry Price by Application (2023-2028) & (USD/Unit)
Table 57. North America Flow Cytometry Sales by Application (2017-2022) (K Units)
Table 58. North America Flow Cytometry Sales by Application (2017-2022) & (US$ Million)
Table 59. North America Flow Cytometry Sales Market Share in Value by Application in 2021
Table 60. Europe Flow Cytometry Sales by Application (2017-2022) (K Units)
Table 61. Europe Flow Cytometry Sales by Application (2017-2022) & (US$ Million)
Table 62. Europe Flow Cytometry Sales Market Share in Value by Application in 2021
Table 63. Asia-Pacific Flow Cytometry Sales by Application (2017-2022) (K Units)
Table 64. Asia-Pacific Flow Cytometry Sales by Application (2017-2022) & (US$ Million)
Table 65. Asia-Pacific Flow Cytometry Sales Market Share in Value by Application in 2021
Table 66. Latin America Flow Cytometry Sales by Application (2017-2022) (K Units)
Table 67. Latin America Flow Cytometry Sales by Application (2017-2022) & (US$ Million)
Table 68. Latin America Flow Cytometry Sales Market Share in Value by Application in 2021
Table 69. Middle East and Africa Flow Cytometry Sales by Application (2017-2022) (K Units)
Table 70. Middle East and Africa Flow Cytometry Sales by Application (2017-2022) & (US$ Million)
Table 71. Middle East and Africa Flow Cytometry Sales Market Share in Value by Application in 2021
Table 72. North America Flow Cytometry Sales by Country (2017-2022) & (K Units)
Table 73. North America Flow Cytometry Sales Market Share in Volume by Country (2017-2022)
Table 74. North America Flow Cytometry Sales by Country (2017-2022) & (US$ Million)
Table 75. North America Flow Cytometry Sales Market Share in Value by Country (2017-2022)
Table 76. North America Flow Cytometry Sales by Country (2023-2028) & (K Units)
Table 77. North America Flow Cytometry Sales Market Share in Volume by Country (2023-2028)
Table 78. North America Flow Cytometry Sales by Country (2023-2028) & (US$ Million)
Table 79. North America Flow Cytometry Sales Market Share in Value by Country (2023-2028)
Table 80. Europe Flow Cytometry Sales by Country (2017-2022) & (K Units)
Table 81. Europe Flow Cytometry Sales Market Share in Volume by Country (2017-2022)
Table 82. Europe Flow Cytometry Sales by Country (2017-2022) & (US$ Million)
Table 83. Europe Flow Cytometry Sales Market Share in Value by Country (2017-2022)
Table 84. Europe Flow Cytometry Sales by Country (2023-2028) & (K Units)
Table 85. Europe Flow Cytometry Sales Market Share in Volume by Country (2023-2028)
Table 86. Europe Flow Cytometry Sales by Country (2023-2028) & (US$ Million)
Table 87. Europe Flow Cytometry Sales Market Share in Value by Country (2023-2028)
Table 88. Asia-Pacific Flow Cytometry Sales by Region (2017-2022) & (K Units)
Table 89. Asia-Pacific Flow Cytometry Sales Market Share in Volume by Region (2017-2022)
Table 90. Asia-Pacific Flow Cytometry Sales by Region (2017-2022) & (US$ Million)
Table 91. Asia-Pacific Flow Cytometry Sales Market Share in Value by Region (2017-2022)
Table 92. Asia-Pacific Flow Cytometry Sales by Region (2023-2028) & (K Units)
Table 93. Asia-Pacific Flow Cytometry Sales Market Share in Volume by Region (2023-2028)
Table 94. Asia-Pacific Flow Cytometry Sales by Region (2023-2028) & (US$ Million)
Table 95. Asia-Pacific Flow Cytometry Sales Market Share in Value by Region (2023-2028)
Table 96. Latin America Flow Cytometry Sales by Country (2017-2022) & (K Units)
Table 97. Latin America Flow Cytometry Sales Market Share in Volume by Country (2017-2022)
Table 98. Latin America Flow Cytometry Sales by Country (2017-2022) & (US$ Million)
Table 99. Latin America Flow Cytometry Sales Market Share in Value by Country (2017-2022)
Table 100. Latin America Flow Cytometry Sales by Country (2023-2028) & (K Units)
Table 101. Latin America Flow Cytometry Sales Market Share in Volume by Country (2023-2028)
Table 102. Latin America Flow Cytometry Sales by Country (2023-2028) & (US$ Million)
Table 103. Latin America Flow Cytometry Sales Market Share in Value by Country (2023-2028)
Table 104. Middle East and Africa Flow Cytometry Sales by Country (2017-2022) & (K Units)
Table 105. Middle East and Africa Flow Cytometry Sales Market Share in Volume by Country (2017-2022)
Table 106. Middle East and Africa Flow Cytometry Sales by Country (2017-2022) & (US$ Million)
Table 107. Middle East and Africa Flow Cytometry Sales Market Share in Value by Country (2017-2022)
Table 108. Middle East and Africa Flow Cytometry Sales by Country (2023-2028) & (K Units)
Table 109. Middle East and Africa Flow Cytometry Sales Market Share in Volume by Country (2023-2028)
Table 110. Middle East and Africa Flow Cytometry Sales by Country (2023-2028) & (US$ Million)
Table 111. Middle East and Africa Flow Cytometry Sales Market Share in Value by Country (2023-2028)
Table 112. Beckman Coulter Corporation Information
Table 113. Beckman Coulter Introduction and Business Overview
Table 114. Beckman Coulter Flow Cytometry Sales (K Units), Revenue (Million USD), Price (USD/Unit) and Gross Margin (2017-2022)
Table 115. Beckman Coulter Flow Cytometry Product
Table 116. Beckman Coulter Recent Development
Table 117. Sysmex Corporation Information
Table 118. Sysmex Introduction and Business Overview
Table 119. Sysmex Flow Cytometry Sales (K Units), Revenue (Million USD), Price (USD/Unit) and Gross Margin (2017-2022)
Table 120. Sysmex Flow Cytometry Product
Table 121. Sysmex Recent Development
Table 122. Agilent Technologies Corporation Information
Table 123. Agilent Technologies Introduction and Business Overview
Table 124. Agilent Technologies Flow Cytometry Sales (K Units), Revenue (Million USD), Price (USD/Unit) and Gross Margin (2017-2022)
Table 125. Agilent Technologies Flow Cytometry Product
Table 126. Agilent Technologies Recent Development
Table 127. Merck Corporation Information
Table 128. Merck Introduction and Business Overview
Table 129. Merck Flow Cytometry Sales (K Units), Revenue (Million USD), Price (USD/Unit) and Gross Margin (2017-2022)
Table 130. Merck Flow Cytometry Product
Table 131. Merck Recent Development
Table 132. Apogee Corporation Information
Table 133. Apogee Introduction and Business Overview
Table 134. Apogee Flow Cytometry Sales (K Units), Revenue (Million USD), Price (USD/Unit) and Gross Margin (2017-2022)
Table 135. Apogee Flow Cytometry Product
Table 136. Apogee Recent Development
Table 137. Bio-Rad Laboratories Corporation Information
Table 138. Bio-Rad Laboratories Introduction and Business Overview
Table 139. Bio-Rad Laboratories Flow Cytometry Sales (K Units), Revenue (Million USD), Price (USD/Unit) and Gross Margin (2017-2022)
Table 140. Bio-Rad Laboratories Flow Cytometry Product
Table 141. Bio-Rad Laboratories Recent Development
Table 142. Thermo Fisher Corporation Information
Table 143. Thermo Fisher Introduction and Business Overview
Table 144. Thermo Fisher Flow Cytometry Sales (K Units), Revenue (Million USD), Price (USD/Unit) and Gross Margin (2017-2022)
Table 145. Thermo Fisher Flow Cytometry Product
Table 146. Thermo Fisher Recent Development
Table 147. Stratedigm Corporation Information
Table 148. Stratedigm Introduction and Business Overview
Table 149. Stratedigm Flow Cytometry Sales (K Units), Revenue (Million USD), Price (USD/Unit) and Gross Margin (2017-2022)
Table 150. Stratedigm Flow Cytometry Product
Table 151. Stratedigm Recent Development
Table 152. Luminex Corporation Information
Table 153. Luminex Introduction and Business Overview
Table 154. Luminex Flow Cytometry Sales (K Units), Revenue (Million USD), Price (USD/Unit) and Gross Margin (2017-2022)
Table 155. Luminex Flow Cytometry Product
Table 156. Luminex Recent Development
Table 157. Miltenyi Biotec Corporation Information
Table 158. Miltenyi Biotec Introduction and Business Overview
Table 159. Miltenyi Biotec Flow Cytometry Sales (K Units), Revenue (Million USD), Price (USD/Unit) and Gross Margin (2017-2022)
Table 160. Miltenyi Biotec Flow Cytometry Product
Table 161. Miltenyi Biotec Recent Development
Table 162. GE Corporation Information
Table 163. GE Introduction and Business Overview
Table 164. GE Flow Cytometry Sales (K Units), Revenue (Million USD), Price (USD/Unit) and Gross Margin (2017-2022)
Table 165. GE Flow Cytometry Product
Table 166. GE Recent Development
Table 167. Key Raw Materials Lists
Table 168. Raw Materials Key Suppliers Lists
Table 169. Flow Cytometry Market Trends
Table 170. Flow Cytometry Market Drivers
Table 171. Flow Cytometry Market Challenges
Table 172. Flow Cytometry Market Restraints
Table 173. Flow Cytometry Distributors List
Table 174. Flow Cytometry Downstream Customers
Table 175. Research Programs/Design for This Report
Table 176. Key Data Information from Secondary Sources
Table 177. Key Data Information from Primary Sources
List of Figures
Figure 1. Flow Cytometry Product Picture
Figure 2. Global Flow Cytometry Market Size, 2017 VS 2021 VS 2028 (US$ Million)
Figure 3. Global Flow Cytometry Market Size Status and Outlook (2017-2028) & (US$ Million)
Figure 4. Global Flow Cytometry Sales Status and Outlook (2017-2028) & (K Units)
Figure 5. Product Picture of Cell-Based Flow Cytometry
Figure 6. Global Cell-Based Flow Cytometry Sales YoY Growth (2017-2028) & (K Units)
Figure 7. Product Picture of Bead-Based Flow Cytometry
Figure 8. Global Bead-Based Flow Cytometry Sales YoY Growth (2017-2028) & (K Units)
Figure 9. Global Flow Cytometry Sales by Type (2017-2028) & (US$ Million)
Figure 10. Global Flow Cytometry Sales Market Share in Volume by Type (2017-2022)
Figure 11. Global Flow Cytometry Sales Market Share in Value by Type (2017-2022)
Figure 12. Global Flow Cytometry Sales Market Share in Volume by Type (2023-2028)
Figure 13. Global Flow Cytometry Sales Market Share in Value by Type (2023-2028)
Figure 14. North America Flow Cytometry Sales Market Share in Volume by Type in 2021
Figure 15. North America Flow Cytometry Sales Market Share in Value by Type in 2021
Figure 16. Europe Flow Cytometry Sales Market Share in Volume by Type in 2021
Figure 17. Europe Flow Cytometry Sales Market Share in Value by Type in 2021
Figure 18. Asia-Pacific Flow Cytometry Sales Market Share in Volume by Type in 2021
Figure 19. Asia-Pacific Flow Cytometry Sales Market Share in Value by Type in 2021
Figure 20. Latin America Flow Cytometry Sales Market Share in Volume by Type in 2021
Figure 21. Latin America Flow Cytometry Sales Market Share in Value by Type in 2021
Figure 22. Middle East and Africa Flow Cytometry Sales Market Share in Volume by Type in 2021
Figure 23. Middle East and Africa Flow Cytometry Sales Market Share in Value by Type in 2021
Figure 24. The 5 and 10 Largest Manufacturers in the World: Market Share by Flow Cytometry Sales in 2021
Figure 25. The 5 and 10 Largest Manufacturers in the World: Market Share by Flow Cytometry Revenue in 2021
Figure 26. Flow Cytometry Market Share by Company Type (Tier 1, Tier 2, and Tier 3): 2017 VS 2021
Figure 27. Product Picture of Academic & research institutes
Figure 28. Global Academic & research institutes Sales YoY Growth (2017-2028) & (K Units)
Figure 29. Product Picture of Hospitals & clinical testing laboratories
Figure 30. Global Hospitals & clinical testing laboratories Sales YoY Growth (2017-2028) & (K Units)
Figure 31. Product Picture of Pharmaceutical & biotechnology companies
Figure 32. Global Pharmaceutical & biotechnology companies Sales YoY Growth (2017-2028) & (K Units)
Figure 33. Global Flow Cytometry Sales by Application (2017-2028) & (US$ Million)
Figure 34. Global Flow Cytometry Sales Market Share by Application in 2021 & 2028
Figure 35. North America Flow Cytometry Sales Market Share in Volume by Application in 2021
Figure 36. Latin America Flow Cytometry Sales Market Share in Value by Application in 2021
Figure 37. Middle East and Africa Flow Cytometry Sales Market Share in Value by Application in 2021
Figure 38. Key Raw Materials Price
Figure 39. Flow Cytometry Manufacturing Cost Structure
Figure 40. Flow Cytometry Industrial Chain Analysis
Figure 41. Channels of Distribution
Figure 42. Distributors Profiles
Figure 43. Bottom-up and Top-down Approaches for This Report
Figure 44. Data Triangulation
Figure 45. Key Executives Interviewed
$3350
$5025
$6700
HAVE A QUERY?
OUR CUSTOMER

SIMILAR REPORTS