FEATURED COMPANIES
PowerSchool
Blackboard
Instructure
Moodle
D2L
Edsby
Schoology (Acquired by PowerSchool in 2019)
K12 Education Learning Management Market
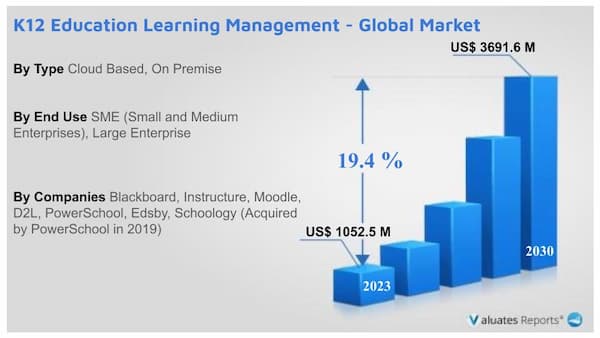
The global market for K12 Education Learning Management was estimated to be worth US$ 1052.5 million in 2023 and is forecast to a readjusted size of US$ 3691.6 million by 2030 with a CAGR of 19.4% during the forecast period 2024-2030
Major Trends
The growth of the K-12 education learning management market is primarily driven by the increasing adoption of digital learning tools and the need for more personalized educational experiences. Schools across the globe are adopting Learning Management Systems (LMS) to enhance the learning process through interactive tools, tracking progress, and offering tailored learning experiences. With the growing demand for hybrid and remote learning options, LMS platforms are gaining popularity due to their ability to provide accessibility, flexibility, and engagement. Additionally, the increasing focus on improving student outcomes, teacher efficiency, and administrative processes is further driving the demand for such platforms. The rise of AI, machine learning, and data analytics in education is also helping create more personalized learning environments, fostering market growth.
K12 Education Learning Management Market Trends
One of the major trends in the K-12 education learning management market is the increasing integration of artificial intelligence (AI) and machine learning (ML) into LMS platforms. AI-powered learning systems are able to personalize content delivery, track student progress in real-time, and offer feedback tailored to each student’s learning style and pace. This technology enables educators to provide targeted support, ensuring better educational outcomes. As a result, schools are more inclined to adopt such systems to meet the demands of personalized education, which is expected to continue growing in the coming years.
Another significant trend is the rise in cloud-based LMS platforms. Cloud technology offers scalability, cost-effectiveness, and easy access to educational content for students and educators. The ability to store and manage vast amounts of data on the cloud helps in real-time monitoring, assessment, and communication. Schools and educational institutions, particularly those in emerging markets, are increasingly turning to cloud-based solutions due to the minimal infrastructure required. This shift toward cloud solutions is expected to significantly enhance the growth of the LMS market in K-12 education.
Mobile learning is becoming another major trend in the K-12 education space. The proliferation of smartphones and tablets has led to the rise of mobile-based learning management systems, allowing students to access educational content on-the-go. With mobile devices now ubiquitous, the ability for students to learn anytime, anywhere, has transformed traditional learning. This trend toward mobile-first LMS platforms is expected to continue as schools look for more flexible and convenient ways to engage students, particularly in remote or hybrid learning environments.
Finally, the growing demand for data-driven insights and analytics is a significant trend in the K-12 education market. LMS platforms are now integrated with advanced analytics tools that allow educators to assess student performance, track learning behaviors, and predict outcomes. These data-driven insights help in identifying areas where students need improvement and provide valuable information to guide teaching strategies. As schools and districts continue to focus on improving student performance, the demand for LMS platforms with strong analytics capabilities will continue to rise.
K12 Education Learning Management Market Share
The global well-known brands in K12 Dducation Learning Management include Blackboard(13.46%), Instructure(4.51%), Moodle(0.75%), D2L(2.46%), PowerSchool(11.60%), Edsby(0.56%), Schoology (Acquired by PowerSchool in 2019)(3.24%) and Others(63.42%).
The application area of K12 Dducation Learning Management includes SME (Small and Medium Enterprises) and Large Enterprise.
In terms of types, K12 Dducation Learning Management can be divided into Cloud-Based and On-Premise.
On basis of geography, K12 Dducation Learning Management is manufactured in North America and Australia.
K12 Education Learning Management Market by Type
K12 Education Learning Management Market by Application
- SME (Small and Medium Enterprises)
- Large Enterprise
K12 Education Learning Management Market by Regional Analysis
- United States
- Europe
- China
- Japan
- Southeast Asia
- India
- Other Regions
Leading Players in the K12 Education Learning Management Market
- Blackboard
- Instructure
- Moodle
- D2L
- PowerSchool
- Edsby
- Schoology (Acquired by PowerSchool in 2019)
Scope of K12 Education LMS Market Report
| Report Metric |
Details |
| Report Name |
K12 Education LMS Market |
| The market size in 2023 |
USD 1052.5 Million |
| The revenue forecast in 2030 |
USD 3691.6 Million |
| Growth Rate |
CAGR of 19.4% |
| Market size available for years |
2022-2028 |
| Forecast units |
Value (USD) |
| Segments covered |
Type, Application, Industry, Regions |
| Report coverage |
Revenue & volume forecast, company share, competitive landscape, growth factors, and trends |
| Geographic regions covered |
North America, Europe, Asia Pacific, Latin America, Middle East & Africa |
Frequently Asked Questions About This Report
1. Do you provide chapter wise report data?
Ans. Yes, we do provide the option to buy chapters in a report. We also can customize the report based on your specific requirements.
2. What is the current size of the global k12 education learning management market?
Ans. The global market for K12 Education Learning Management was estimated to be worth US$ 1052.5 million in 2023 and is forecast to a readjusted size of US$ 3691.6 million by 2030 with a CAGR of 19.4% during the forecast period 2024-2030
3. Who are the key companies/players in the k12 education learning management market?
Ans. The global well-known brands in k12 education learning management market include Blackboard(13.46%), Instructure(4.51%), Moodle(0.75%), D2L(2.46%), PowerSchool(11.60%), Edsby(0.56%), Schoology (Acquired by PowerSchool in 2019)(3.24%) and Others(63.42%).
4. Which region holds the maximum market share of the global k12 education learning management market?
Ans. Based on region, the North Americas occupied the maximum share of the k12 education learning management market.
5. What would be the forecast period in the k12 education learning management market report?
Ans. The forecast period for k12 education learning management market is 2024 to 2030
5. How can I get report sample of k12 education learning management market?
Ans. To get latest version of k12 education learning management market report can be obtained on demand from the website.
Recommended Reports
K-12 Learning Systems
Education Management Tools
Digital Learning Platforms
07/22/25
1 Market Overview
1.1 K12 Education Learning Management Product Introduction
1.2 Global K12 Education Learning Management Market Size Forecast
1.3 K12 Education Learning Management Market Trends & Drivers
1.3.1 K12 Education Learning Management Industry Trends
1.3.2 K12 Education Learning Management Market Drivers & Opportunity
1.3.3 K12 Education Learning Management Market Challenges
1.3.4 K12 Education Learning Management Market Restraints
1.4 Assumptions and Limitations
1.5 Study Objectives
1.6 Years Considered
2 Competitive Analysis by Company
2.1 Global K12 Education Learning Management Players Revenue Ranking (2023)
2.2 Global K12 Education Learning Management Revenue by Company (2019-2024)
2.3 Key Companies K12 Education Learning Management Manufacturing Base Distribution and Headquarters
2.4 Key Companies K12 Education Learning Management Product Offered
2.5 Key Companies Time to Begin Mass Production of K12 Education Learning Management
2.6 K12 Education Learning Management Market Competitive Analysis
2.6.1 K12 Education Learning Management Market Concentration Rate (2019-2024)
2.6.2 Global 5 and 10 Largest Companies by K12 Education Learning Management Revenue in 2023
2.6.3 Global Top Companies by Company Type (Tier 1, Tier 2, and Tier 3) & (based on the Revenue in K12 Education Learning Management as of 2023)
2.7 Mergers & Acquisitions, Expansion
3 Segmentation by Type
3.1 Introduction by Type
3.1.1 Cloud-Based
3.1.2 On-Premise
3.2 Global K12 Education Learning Management Sales Value by Type
3.2.1 Global K12 Education Learning Management Sales Value by Type (2019 VS 2023 VS 2030)
3.2.2 Global K12 Education Learning Management Sales Value, by Type (2019-2030)
3.2.3 Global K12 Education Learning Management Sales Value, by Type (%) (2019-2030)
4 Segmentation by Application
4.1 Introduction by Application
4.1.1 SME (Small and Medium Enterprises)
4.1.2 Large Enterprise
4.2 Global K12 Education Learning Management Sales Value by Application
4.2.1 Global K12 Education Learning Management Sales Value by Application (2019 VS 2023 VS 2030)
4.2.2 Global K12 Education Learning Management Sales Value, by Application (2019-2030)
4.2.3 Global K12 Education Learning Management Sales Value, by Application (%) (2019-2030)
5 Segmentation by Region
5.1 Global K12 Education Learning Management Sales Value by Region
5.1.1 Global K12 Education Learning Management Sales Value by Region: 2019 VS 2023 VS 2030
5.1.2 Global K12 Education Learning Management Sales Value by Region (2019-2024)
5.1.3 Global K12 Education Learning Management Sales Value by Region (2025-2030)
5.1.4 Global K12 Education Learning Management Sales Value by Region (%), (2019-2030)
5.2 North America
5.2.1 North America K12 Education Learning Management Sales Value, 2019-2030
5.2.2 North America K12 Education Learning Management Sales Value by Country (%), 2023 VS 2030
5.3 Europe
5.3.1 Europe K12 Education Learning Management Sales Value, 2019-2030
5.3.2 Europe K12 Education Learning Management Sales Value by Country (%), 2023 VS 2030
5.4 Asia Pacific
5.4.1 Asia Pacific K12 Education Learning Management Sales Value, 2019-2030
5.4.2 Asia Pacific K12 Education Learning Management Sales Value by Country (%), 2023 VS 2030
5.5 South America
5.5.1 South America K12 Education Learning Management Sales Value, 2019-2030
5.5.2 South America K12 Education Learning Management Sales Value by Country (%), 2023 VS 2030
5.6 Middle East & Africa
5.6.1 Middle East & Africa K12 Education Learning Management Sales Value, 2019-2030
5.6.2 Middle East & Africa K12 Education Learning Management Sales Value by Country (%), 2023 VS 2030
6 Segmentation by Key Countries/Regions
6.1 Key Countries/Regions K12 Education Learning Management Sales Value Growth Trends, 2019 VS 2023 VS 2030
6.2 Key Countries/Regions K12 Education Learning Management Sales Value
6.3 United States
6.3.1 United States K12 Education Learning Management Sales Value, 2019-2030
6.3.2 United States K12 Education Learning Management Sales Value by Type (%), 2023 VS 2030
6.3.3 United States K12 Education Learning Management Sales Value by Application, 2023 VS 2030
6.4 Europe
6.4.1 Europe K12 Education Learning Management Sales Value, 2019-2030
6.4.2 Europe K12 Education Learning Management Sales Value by Type (%), 2023 VS 2030
6.4.3 Europe K12 Education Learning Management Sales Value by Application, 2023 VS 2030
6.5 China
6.5.1 China K12 Education Learning Management Sales Value, 2019-2030
6.5.2 China K12 Education Learning Management Sales Value by Type (%), 2023 VS 2030
6.5.3 China K12 Education Learning Management Sales Value by Application, 2023 VS 2030
6.6 Japan
6.6.1 Japan K12 Education Learning Management Sales Value, 2019-2030
6.6.2 Japan K12 Education Learning Management Sales Value by Type (%), 2023 VS 2030
6.6.3 Japan K12 Education Learning Management Sales Value by Application, 2023 VS 2030
6.7 South Korea
6.7.1 South Korea K12 Education Learning Management Sales Value, 2019-2030
6.7.2 South Korea K12 Education Learning Management Sales Value by Type (%), 2023 VS 2030
6.7.3 South Korea K12 Education Learning Management Sales Value by Application, 2023 VS 2030
6.8 Southeast Asia
6.8.1 Southeast Asia K12 Education Learning Management Sales Value, 2019-2030
6.8.2 Southeast Asia K12 Education Learning Management Sales Value by Type (%), 2023 VS 2030
6.8.3 Southeast Asia K12 Education Learning Management Sales Value by Application, 2023 VS 2030
6.9 India
6.9.1 India K12 Education Learning Management Sales Value, 2019-2030
6.9.2 India K12 Education Learning Management Sales Value by Type (%), 2023 VS 2030
6.9.3 India K12 Education Learning Management Sales Value by Application, 2023 VS 2030
7 Company Profiles
7.1 Blackboard
7.1.1 Blackboard Profile
7.1.2 Blackboard Main Business
7.1.3 Blackboard K12 Education Learning Management Products, Services and Solutions
7.1.4 Blackboard K12 Education Learning Management Revenue (US$ Million) & (2019-2024)
7.1.5 Blackboard Recent Developments
7.2 Instructure
7.2.1 Instructure Profile
7.2.2 Instructure Main Business
7.2.3 Instructure K12 Education Learning Management Products, Services and Solutions
7.2.4 Instructure K12 Education Learning Management Revenue (US$ Million) & (2019-2024)
7.2.5 Instructure Recent Developments
7.3 Moodle
7.3.1 Moodle Profile
7.3.2 Moodle Main Business
7.3.3 Moodle K12 Education Learning Management Products, Services and Solutions
7.3.4 Moodle K12 Education Learning Management Revenue (US$ Million) & (2019-2024)
7.3.5 D2L Recent Developments
7.4 D2L
7.4.1 D2L Profile
7.4.2 D2L Main Business
7.4.3 D2L K12 Education Learning Management Products, Services and Solutions
7.4.4 D2L K12 Education Learning Management Revenue (US$ Million) & (2019-2024)
7.4.5 D2L Recent Developments
7.5 PowerSchool
7.5.1 PowerSchool Profile
7.5.2 PowerSchool Main Business
7.5.3 PowerSchool K12 Education Learning Management Products, Services and Solutions
7.5.4 PowerSchool K12 Education Learning Management Revenue (US$ Million) & (2019-2024)
7.5.5 PowerSchool Recent Developments
7.6 Edsby
7.6.1 Edsby Profile
7.6.2 Edsby Main Business
7.6.3 Edsby K12 Education Learning Management Products, Services and Solutions
7.6.4 Edsby K12 Education Learning Management Revenue (US$ Million) & (2019-2024)
7.6.5 Edsby Recent Developments
7.7 Schoology (Acquired by PowerSchool in 2019)
7.7.1 Schoology (Acquired by PowerSchool in 2019) Profile
7.7.2 Schoology (Acquired by PowerSchool in 2019) Main Business
7.7.3 Schoology (Acquired by PowerSchool in 2019) K12 Education Learning Management Products, Services and Solutions
7.7.4 Schoology (Acquired by PowerSchool in 2019) K12 Education Learning Management Revenue (US$ Million) & (2019-2024)
7.7.5 Schoology (Acquired by PowerSchool in 2019) Recent Developments
8 Industry Chain Analysis
8.1 K12 Education Learning Management Industrial Chain
8.2 K12 Education Learning Management Upstream Analysis
8.2.1 Key Raw Materials
8.2.2 Raw Materials Key Suppliers
8.2.3 Manufacturing Cost Structure
8.3 Midstream Analysis
8.4 Downstream Analysis (Customers Analysis)
8.5 Sales Model and Sales Channels
8.5.1 K12 Education Learning Management Sales Model
8.5.2 Sales Channel
8.5.3 K12 Education Learning Management Distributors
9 Research Findings and Conclusion
10 Appendix
10.1 Research Methodology
10.1.1 Methodology/Research Approach
10.1.2 Data Source
10.2 Author Details
10.3 Disclaimer
FEATURED COMPANIES
PowerSchool
Blackboard
Instructure
Moodle
D2L
Edsby
Schoology (Acquired by PowerSchool in 2019)
List of Tables
Table 1. K12 Education Learning Management Market Trends
Table 2. K12 Education Learning Management Market Drivers & Opportunity
Table 3. K12 Education Learning Management Market Challenges
Table 4. K12 Education Learning Management Market Restraints
Table 5. Global K12 Education Learning Management Revenue by Company (2019-2024) & (US$ Million)
Table 6. Global K12 Education Learning Management Revenue Market Share by Company (2019-2024)
Table 7. Key Companies K12 Education Learning Management Manufacturing Base Distribution and Headquarters
Table 8. Key Companies K12 Education Learning Management Product Type
Table 9. Key Companies Time to Begin Mass Production of K12 Education Learning Management
Table 10. Global K12 Education Learning Management Companies Market Concentration Ratio (CR5 and HHI)
Table 11. Global Top Companies Market Share by Company Type (Tier 1, Tier 2, and Tier 3) & (based on the Revenue in K12 Education Learning Management as of 2023)
Table 12. Mergers & Acquisitions, Expansion Plans
Table 13. Global K12 Education Learning Management Sales Value by Type: 2019 VS 2023 VS 2030 (US$ Million)
Table 14. Global K12 Education Learning Management Sales Value by Type (2019-2024) & (US$ Million)
Table 15. Global K12 Education Learning Management Sales Value by Type (2025-2030) & (US$ Million)
Table 16. Global K12 Education Learning Management Sales Market Share in Value by Type (2019-2024) & (%)
Table 17. Global K12 Education Learning Management Sales Market Share in Value by Type (2025-2030) & (%)
Table 18. Global K12 Education Learning Management Sales Value by Application: 2019 VS 2023 VS 2030 (US$ Million)
Table 19. Global K12 Education Learning Management Sales Value by Application (2019-2024) & (US$ Million)
Table 20. Global K12 Education Learning Management Sales Value by Application (2025-2030) & (US$ Million)
Table 21. Global K12 Education Learning Management Sales Market Share in Value by Application (2019-2024) & (%)
Table 22. Global K12 Education Learning Management Sales Market Share in Value by Application (2025-2030) & (%)
Table 23. Global K12 Education Learning Management Sales Value by Region: 2019 VS 2023 VS 2030 (US$ Million)
Table 24. Global K12 Education Learning Management Sales Value by Region (2019-2024) & (US$ Million)
Table 25. Global K12 Education Learning Management Sales Value by Region (2025-2030) & (US$ Million)
Table 26. Global K12 Education Learning Management Sales Value by Region (2019-2024) & (%)
Table 27. Global K12 Education Learning Management Sales Value by Region (2025-2030) & (%)
Table 28. Key Countries/Regions K12 Education Learning Management Sales Value Growth Trends, (US$ Million): 2019 VS 2023 VS 2030
Table 29. Key Countries/Regions K12 Education Learning Management Sales Value, (2019-2024) & (US$ Million)
Table 30. Key Countries/Regions K12 Education Learning Management Sales Value, (2025-2030) & (US$ Million)
Table 31. Blackboard Basic Information List
Table 32. Blackboard Description and Business Overview
Table 33. Blackboard K12 Education Learning Management Products, Services and Solutions
Table 34. Revenue (US$ Million) in K12 Education Learning Management Business of Blackboard (2019-2024)
Table 35. Blackboard Recent Developments
Table 36. Instructure Basic Information List
Table 37. Instructure Description and Business Overview
Table 38. Instructure K12 Education Learning Management Products, Services and Solutions
Table 39. Revenue (US$ Million) in K12 Education Learning Management Business of Instructure (2019-2024)
Table 40. Instructure Recent Developments
Table 41. Moodle Basic Information List
Table 42. Moodle Description and Business Overview
Table 43. Moodle K12 Education Learning Management Products, Services and Solutions
Table 44. Revenue (US$ Million) in K12 Education Learning Management Business of Moodle (2019-2024)
Table 45. Moodle Recent Developments
Table 46. D2L Basic Information List
Table 47. D2L Description and Business Overview
Table 48. D2L K12 Education Learning Management Products, Services and Solutions
Table 49. Revenue (US$ Million) in K12 Education Learning Management Business of D2L (2019-2024)
Table 50. D2L Recent Developments
Table 51. PowerSchool Basic Information List
Table 52. PowerSchool Description and Business Overview
Table 53. PowerSchool K12 Education Learning Management Products, Services and Solutions
Table 54. Revenue (US$ Million) in K12 Education Learning Management Business of PowerSchool (2019-2024)
Table 55. PowerSchool Recent Developments
Table 56. Edsby Basic Information List
Table 57. Edsby Description and Business Overview
Table 58. Edsby K12 Education Learning Management Products, Services and Solutions
Table 59. Revenue (US$ Million) in K12 Education Learning Management Business of Edsby (2019-2024)
Table 60. Edsby Recent Developments
Table 61. Schoology (Acquired by PowerSchool in 2019) Basic Information List
Table 62. Schoology (Acquired by PowerSchool in 2019) Description and Business Overview
Table 63. Schoology (Acquired by PowerSchool in 2019) K12 Education Learning Management Products, Services and Solutions
Table 64. Revenue (US$ Million) in K12 Education Learning Management Business of Schoology (Acquired by PowerSchool in 2019) (2019-2024)
Table 65. Schoology (Acquired by PowerSchool in 2019) Recent Developments
Table 66. Key Raw Materials Lists
Table 67. Raw Materials Key Suppliers Lists
Table 68. K12 Education Learning Management Downstream Customers
Table 69. K12 Education Learning Management Distributors List
Table 70. Research Programs/Design for This Report
Table 71. Key Data Information from Secondary Sources
Table 72. Key Data Information from Primary Sources
Table 73. Business Unit and Senior & Team Lead Analysts
List of Figures
Figure 1. K12 Education Learning Management Product Picture
Figure 2. Global K12 Education Learning Management Sales Value, 2019 VS 2023 VS 2030 (US$ Million)
Figure 3. Global K12 Education Learning Management Sales Value (2019-2030) & (US$ Million)
Figure 4. K12 Education Learning Management Report Years Considered
Figure 5. Global K12 Education Learning Management Players Revenue Ranking (2023) & (US$ Million)
Figure 6. The 5 and 10 Largest Manufacturers in the World: Market Share by K12 Education Learning Management Revenue in 2023
Figure 7. K12 Education Learning Management Market Share by Company Type (Tier 1, Tier 2, and Tier 3): 2019 VS 2023
Figure 8. Cloud-Based Picture
Figure 9. On-Premise Picture
Figure 10. Global K12 Education Learning Management Sales Value by Type (2019 VS 2023 VS 2030) & (US$ Million)
Figure 11. Global K12 Education Learning Management Sales Value Market Share by Type, 2023 & 2030
Figure 12. Product Picture of SME (Small and Medium Enterprises)
Figure 13. Product Picture of Large Enterprise
Figure 14. Global K12 Education Learning Management Sales Value by Application (2019 VS 2023 VS 2030) & (US$ Million)
Figure 15. Global K12 Education Learning Management Sales Value Market Share by Application, 2023 & 2030
Figure 16. North America K12 Education Learning Management Sales Value (2019-2030) & (US$ Million)
Figure 17. North America K12 Education Learning Management Sales Value by Country (%), 2023 VS 2030
Figure 18. Europe K12 Education Learning Management Sales Value (2019-2030) & (US$ Million)
Figure 19. Europe K12 Education Learning Management Sales Value by Country (%), 2023 VS 2030
Figure 20. Asia Pacific K12 Education Learning Management Sales Value (2019-2030) & (US$ Million)
Figure 21. Asia Pacific K12 Education Learning Management Sales Value by Country (%), 2023 VS 2030
Figure 22. South America K12 Education Learning Management Sales Value (2019-2030) & (US$ Million)
Figure 23. South America K12 Education Learning Management Sales Value by Country (%), 2023 VS 2030
Figure 24. Middle East & Africa K12 Education Learning Management Sales Value (2019-2030) & (US$ Million)
Figure 25. Middle East & Africa K12 Education Learning Management Sales Value by Country (%), 2023 VS 2030
Figure 26. Key Countries/Regions K12 Education Learning Management Sales Value (%), (2019-2030)
Figure 27. United States K12 Education Learning Management Sales Value, (2019-2030) & (US$ Million)
Figure 28. United States K12 Education Learning Management Sales Value by Type (%), 2023 VS 2030
Figure 29. United States K12 Education Learning Management Sales Value by Application (%), 2023 VS 2030
Figure 30. Europe K12 Education Learning Management Sales Value, (2019-2030) & (US$ Million)
Figure 31. Europe K12 Education Learning Management Sales Value by Type (%), 2023 VS 2030
Figure 32. Europe K12 Education Learning Management Sales Value by Application (%), 2023 VS 2030
Figure 33. China K12 Education Learning Management Sales Value, (2019-2030) & (US$ Million)
Figure 34. China K12 Education Learning Management Sales Value by Type (%), 2023 VS 2030
Figure 35. China K12 Education Learning Management Sales Value by Application (%), 2023 VS 2030
Figure 36. Japan K12 Education Learning Management Sales Value, (2019-2030) & (US$ Million)
Figure 37. Japan K12 Education Learning Management Sales Value by Type (%), 2023 VS 2030
Figure 38. Japan K12 Education Learning Management Sales Value by Application (%), 2023 VS 2030
Figure 39. South Korea K12 Education Learning Management Sales Value, (2019-2030) & (US$ Million)
Figure 40. South Korea K12 Education Learning Management Sales Value by Type (%), 2023 VS 2030
Figure 41. South Korea K12 Education Learning Management Sales Value by Application (%), 2023 VS 2030
Figure 42. Southeast Asia K12 Education Learning Management Sales Value, (2019-2030) & (US$ Million)
Figure 43. Southeast Asia K12 Education Learning Management Sales Value by Type (%), 2023 VS 2030
Figure 44. Southeast Asia K12 Education Learning Management Sales Value by Application (%), 2023 VS 2030
Figure 45. India K12 Education Learning Management Sales Value, (2019-2030) & (US$ Million)
Figure 46. India K12 Education Learning Management Sales Value by Type (%), 2023 VS 2030
Figure 47. India K12 Education Learning Management Sales Value by Application (%), 2023 VS 2030
Figure 48. K12 Education Learning Management Industrial Chain
Figure 49. K12 Education Learning Management Manufacturing Cost Structure
Figure 50. Channels of Distribution (Direct Sales, and Distribution)
Figure 51. Bottom-up and Top-down Approaches for This Report
Figure 52. Data Triangulation
