
The outbreak of COVID-19 began in late 2019, and has spread throughout the world in early 2020. After the diseases was declared a pandemic, affected countries declared complete lockdown, which resulted in the closure of schools. Classes were shifted online, which caused a reduction in the sale of clothes, shoes, lunch boxes, water bottles, and art & craft supplies. The sales of stationeries were reduced, as students were staying at home, as the study material was recorded and shared in a digital format, which led to major losses for stationary brands. Moreover, schools remained closed for months, and were reopened periodically for a few weeks or a months, depending on the various conditions of the pandemic in the region. Thus, closure of schools was a major setback for the growth of the back-to-school market.
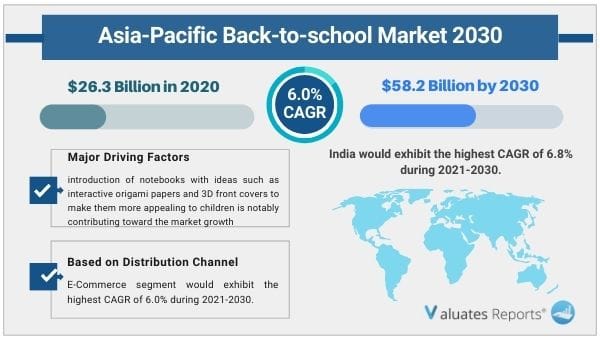
The Asia-Pacific back to school market is segmented on the basis of product type, distribution channels, and countries. Based on product type, the Asia-Pacific market is divided into bagpack, electronic, stationery, clothing, shoes, and other. The report also segments the market on the basis of distribution channels mainly hypermarket/supermarket, e-commerce, dollar stores, specialty stores, and others. Furthermore, it includes revenue generated from the sales of Asia-Pacific back to school market across China, India, Japan, Australia, South Korea, Indonesia, Malaysia, Singapore, Vietnam, and Rest of Asia-Pacific.
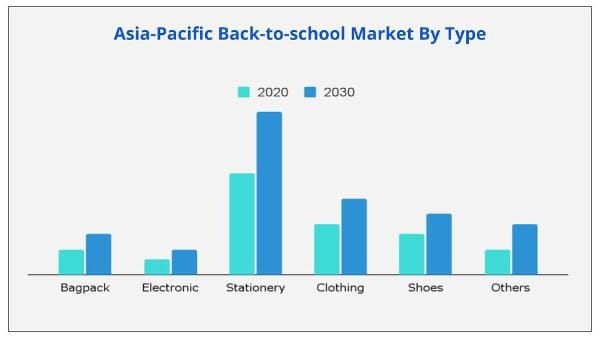
By product type, the Asia-Pacific back to school market is segmented into bagpack, electronic, stationery, clothing, shoes, and other. Stationery is the largest segment in the market due to the fact that stationery is the primary tool used for education and learning. Stationery is expected to remain the dominant segment at the end of the forecast period.
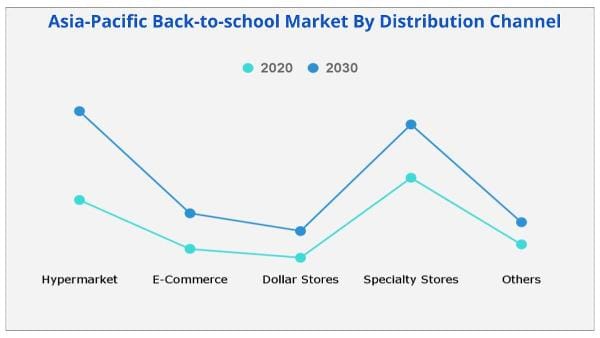
Depending on the distribution channel, the Asia-Pacific back to school market is divided into hypermarket/supermarket, e-commerce, dollar stores, specialty stores, and others. Specialty store are the most predominant channel for the purchase of back to school products and the e-commerce segment is expected to have the highest growth.
The report focuses on the Asia-Pacific back to school market growth prospects, restraints, and opportunities of the Asia-Pacific back to school market. The study provides Porter’s five forces analysis to understand the impact of various factors such as competitive intensity of competitors, bargaining power of suppliers, threat of substitutes, threat of new entrants, and bargaining power of buyers of the Asia-Pacific back to school market.
Some of the major players profiled for in the Asia-Pacific back to school market analysis include Acco Brands, Adidas AG, Harlequin International Group Pty Ltd., ITC Limited, Kokuyo Camlin Ltd., Mitsubishi Pencil Co., Ltd., Pelikan International Corporation Berhad, Puma Se, Wh Smith Plc, and Zebra Pen Corp. Other prominent players analyzed in the report are Faber-Castell, Nike, Skybags., Izod, Staedtler., Canson, and Wildcraft.
|
Report Metric |
Details |
|
Report Name |
Asia-Pacific Back-to-school Market |
|
The market size in 2020 |
USD 26.3 Billion |
|
The revenue forecast in 2030 |
USD 58.2 Billion |
|
Growth Rate |
CAGR of 6.0% from 2021 to 2030 |
|
Market size available for years |
2021-2030 |
|
Forecast units |
Value (USD) |
|
Segments covered |
By Product Type, Sales Channel, and Region |
|
Report coverage |
Revenue & volume forecast, company share, competitive landscape, growth factors, and trends |
|
Geographic regions covered |
North America, Europe, Asia Pacific, Latin America, Middle East & Africa |
|
Key Companies |
Acco Brands, Adidas AG, Harlequin International Group Pty Ltd., ITC Limited, Kokuyo Camlin Ltd., Mitsubishi Pencil Co., Ltd., Pelikan International Corporation Berhad, Puma Se, Wh Smith Plc, and Zebra Pen Corp. Other prominent players analyzed in the report are Faber-Castell, Nike, Skybags., Izod, Staedtler., Canson, and Wildcraft. |
Ans. The Asia-Pacific back to school market size was valued at $26.3 billion in 2020, and is projected reach $58.2 billion by 2030, registering a CAGR of 6.0% from 2021 to 2030.
Ans. The Asia-Pacific back to school market is likely to witness robust growth in the post Covid-19 world.
Ans. The stationery segment holds the maximum market share Asia-Pacific back to school market.
Ans. Some of the major players operating in the Asia-Pacific back to school market include Acco Brands, Adidas AG, Harlequin International Group Pty Ltd., ITC Limited, Kokuyo Camlin Ltd., Mitsubishi Pencil Co., Ltd., Pelikan International Corporation Berhad, Puma Se, Wh Smith Plc, and Zebra Pen Corp.
Table of Content
CHAPTER 1:INTRODUCTION
1.1.Report description
1.2.Key benefits for stakeholders
1.3.Key market segments
1.4.Research methodology
1.4.1.Primary research
1.4.2.Secondary research
1.4.3.Analyst tools and models
CHAPTER 2:EXECUTIVE SUMMARY
2.1.Key findings
2.1.1.Top impacting factors
2.1.2.Top investment pockets
2.2.CXO perspective
CHAPTER 3:MARKET OVERVIEW
3.1.Market definition and scope
3.2.Porter's five forces analysis
3.2.1.Bargaining power of suppliers
3.2.2.Bargaining power of buyers
3.2.3.Threat of substitution
3.2.4.Threat of new entrants
3.2.5.Intensity of competitive rivalry
3.3.Market dynamics
3.3.1.Drivers
3.3.1.1.Innovation in back-to-school products
3.3.1.2.Increase in government expenditure and emphasis on primary education
3.3.1.3.Removal of one-child policy by China and reduction of infant mortality rate in the region
3.3.2.Restraints
3.3.2.1.Choking hazard of small components and toxicity of certain stationery products
3.3.2.2.Outbreak of COVID-19
3.3.3.Opportunities
3.3.3.1.Increase in popularity of online shopping
3.3.3.2.Increase in trend of social media and digital marketing
3.4.COVID-19 analysis
3.4.1.Overview
3.4.2.Impact on consumer goods sector
3.4.3.Impact on back-to-school market
CHAPTER 4:ASIA-PACIFIC BACK-TO-SCHOOL MARKET, BY PRODUCT TYPE
4.1.Overview
4.1.1.Market size and forecast, by product type
4.2.Backpack
4.2.1.Key market trends, growth factors, and opportunities
4.2.2.Market size and forecast, by region
4.2.3.Market analysis, by country
4.3.Electronic
4.3.1.Key market trends, growth factors, and opportunities
4.3.2.Market size and forecast, by region
4.3.3.Market analysis, by country
4.4.Stationery
4.4.1.Key market trends, growth factors, and opportunities
4.4.2.Market size and forecast, by region
4.4.3.Market analysis, by country
4.5.Clothing
4.5.1.Key market trends, growth factors, and opportunities
4.5.2.Market size and forecast, by region
4.5.3.Market analysis, by country
4.6.Shoes
4.6.1.Key market trends, growth factors, and opportunities
4.6.2.Market size and forecast, by region
4.6.3.Market analysis, by country
4.7.Others
4.7.1.Key market trends, growth factors, and opportunities
4.7.2.Market size and forecast, by region
4.7.3.Market analysis, by country
CHAPTER 5:ASIA-PACIFIC BACK-TO-SCHOOL MARKET, BY DISTRIBUTION CHANNEL
5.1.Overview
5.1.1.Market size and forecast, by distribution channel
5.2.Hypermarket/supermarket
5.2.1.Key market trends, growth factors, and opportunities
5.2.2.Market size and forecast, by region
5.2.3.Market analysis, by country
5.3.E-commerce
5.3.1.Key market trends, growth factors, and opportunities
5.3.2.Market size and forecast, by region
5.3.3.Market analysis, by country
5.4.Dollar stores
5.4.1.Key market trends, growth factors, and opportunities
5.4.2.Market size and forecast, by region
5.4.3.Market analysis, by country
5.5.Specialty stores
5.5.1.Key market trends, growth factors, and opportunities
5.5.2.Market size and forecast, by region
5.5.3.Market analysis, by country
5.6.Others
5.6.1.Key market trends, growth factors, and opportunities
5.6.2.Market size and forecast, by region
5.6.3.Market analysis, by country
CHAPTER 6:ASIA-PACIFIC BACK-TO-SCHOOL MARKET, BY COUNTRY
6.1.Overview
6.1.1.Market size and forecast, by country
6.1.1.1.China
6.1.1.1.1.Market size and forecast, by product type
6.1.1.1.2.Market size and forecast, by distribution channel
6.1.1.2.India
6.1.1.2.1.Market size and forecast, by product type
6.1.1.2.2.Market size and forecast, by distribution channel
6.1.1.3.Japan
6.1.1.3.1.Market size and forecast, by product type
6.1.1.3.2.Market size and forecast, by distribution channel
6.1.1.4.Australia
6.1.1.4.1.Market size and forecast, by product type
6.1.1.4.2.Market size and forecast, by distribution channel
6.1.1.5.South Korea
6.1.1.5.1.Market size and forecast, by product type
6.1.1.5.2.Market size and forecast, by distribution channel
6.1.1.6.Indonesia
6.1.1.6.1.Market size and forecast, by product type
6.1.1.6.2.Market size and forecast, by distribution channel
6.1.1.7.Malaysia
6.1.1.7.1.Market size and forecast, by product type
6.1.1.7.2.Market size and forecast, by distribution channel
6.1.1.8.Singapore
6.1.1.8.1.Market size and forecast, by product type
6.1.1.8.2.Market size and forecast, by distribution channel
6.1.1.9.Vietnam
6.1.1.9.1.Market size and forecast, by product type
6.1.1.9.2.Market size and forecast, by distribution channel
6.1.1.10.Rest of Asia-Pacific
6.1.1.10.1.Market size and forecast, by product type
6.1.1.10.2.Market size and forecast, by distribution channel
CHAPTER 7:COMPETITION LANDSCAPE
7.1.Overview
7.2.Competitive dashboard
7.3.Competitive heatmap
7.4.Product mapping
7.5.Top winning strategies
7.6.Key developments
7.6.1.Acquisition
7.6.2.Business expansion
7.6.3.Partnership
7.6.4.Product launch
7.7.Top player positioning
CHAPTER 8:COMPANY PROFILES
8.1.ACCO BRANDS
8.1.1.Company overview
8.1.2.Key executives
8.1.3.Company snapshot
8.1.4.Operating business segments
8.1.5.Product portfolio
8.1.6.R&D expenditure
8.1.7.Business performance
8.1.8.Key strategic moves and developments
8.2.ADIDAS AG (REEBOK)
8.2.1.Company overview
8.2.2.Key executives
8.2.3.Company snapshot
8.2.4.Product portfolio
8.2.5.R&D expenditure
8.2.6.Business performance
8.3.HARLEQUIN INTERNATIONAL GROUP PTY LTD.
8.3.1.Company overview
8.3.2.Key executives
8.3.3.Company snapshot
8.3.4.Product portfolio
8.4.ITC LIMITED
8.4.1.Company overview
8.4.2.Key executives
8.4.3.Company snapshot
8.4.4.Operating business segments
8.4.5.Product portfolio
8.4.6.R&D expenditure
8.4.7.Business performance
8.4.8.Key strategic moves and developments
8.5.KOKUYO CAMLIN LTD.
8.5.1.Company overview
8.5.2.Key executives
8.5.3.Company snapshot
8.5.4.Product portfolio
8.5.5.R&D expenditure
8.5.6.Business performance
8.5.7.Key strategic moves and developments
8.6.MITSUBISHI PENCIL CO., LTD.
8.6.1.Company overview
8.6.2.Key executives
8.6.3.Company snapshot
8.6.4.Product portfolio
8.6.5.Business performance
8.7.PELIKAN INTERNATIONAL CORPORATION BERHAD
8.7.1.Company overview
8.7.2.Key executives
8.7.3.Company snapshot
8.7.4.Operating business segments
8.7.5.Product portfolio
8.7.6.R&D expenditure
8.7.7.Business performance
8.8.PUMA SE
8.8.1.Company overview
8.8.2.Key executives
8.8.3.Company snapshot
8.8.4.Operating business segments
8.8.5.Product portfolio
8.8.6.R&D expenditure
8.8.7.Business performance
8.8.8.Key strategic moves and developments
8.9.WH SMITH PLC.
8.9.1.Company overview
8.9.2.Key executives
8.9.3.Company snapshot
8.9.4.Operating business segments
8.9.5.Product portfolio
8.9.6.Business performance
8.9.7.Key strategic moves and developments
8.10.ZEBRA PEN CORP.
8.10.1.Company overview
8.10.2.Key executives
8.10.3.Company snapshot
8.10.4.Product portfolio
8.10.5.Key strategic moves and developments
List of Tables & Figures
Table 01.Asia-Pacific Back-To-School Market, By Product Type, 2020–2030 ($Million)
Table 02.Asia-Pacific Back-To-School Market For Backpack, By Country, 2020–2030 ($Million)
Table 03.Asia-Pacific Back-To-School Market For Electronic, By Country, 2020–2030 ($Million)
Table 04.Asia-Pacific Back-To-School Market For Stationery, By Country, 2020–2030 ($Million)
Table 05.Asia-Pacific Back-To-School Market For Clothing, By Country, 2020–2030 ($Million)
Table 06.Asia-Pacific Back-To-School Market For Shoes, By Country, 2020–2030 ($Million)
Table 07.Asia-Pacific Back-To-School Market For Others, By Country, 2020–2030 ($Million)
Table 08.Asia-Pacific Back-To-School Market Value, By Distribution Channel, 2020–2030 ($Million)
Table 09.Asia-Pacific Back-To-School Market For Hypermarket/Supermarket, By Country, 2020–2030 ($Million)
Table 10.Asia-Pacific Back-To-School Market For E-Commerce, By Country, 2020–2030 ($Million)
Table 11.Asia-Pacific Back-To-School Market For Dollar Stores, By Country, 2020–2030 ($Million)
Table 12.Asia-Pacific Back-To-School Market For Specialty Stores, By Country, 2020–2030 ($Million)
Table 13.Asia-Pacific Back-To-School Market For Others, By Country, 2020–2030 ($Million)
Table 14.Asia-Pacific Back-To-School Market, By Country, 2020–2030 ($Million)
Table 15.China Back-To-School Market Value, By Product Type, 2020–2030 ($Million)
Table 16.China Back-To-School Market Value, By Distribution Channel, 2020–2030 ($Million)
Table 17.India Back-To-School Market Value, By Product Type, 2020–2030 ($Million)
Table 18.India Back-To-School Market Value, By Distribution Channel, 2020–2030 ($Million)
Table 19.Japan Back-To-School Market Value, By Product Type, 2020–2030 ($Million)
Table 20.Japan Back-To-School Market Value, By Distribution Channel, 2020–2030 ($Million)
Table 21.Australia Back-To-School Market Value, By Product Type, 2020–2030 ($Million)
Table 22.Australia Back-To-School Market Value, By Distribution Channel, 2020–2030 ($Million)
Table 23.South Korea Back-To-School Market Value, By Product Type, 2020–2030 ($Million)
Table 24.South Korea Back-To-School Market Value, By Distribution Channel, 2020–2030 ($Million)
Table 25.Indonesia Back-To-School Market Value, By Product Type, 2020–2030 ($Million)
Table 26.Indonesia Back-To-School Market Value, By Distribution Channel, 2020–2030 ($Million)
Table 27.Malaysia Back-To-School Market Value, By Product Type, 2020–2030 ($Million)
Table 28.Malaysia Back-To-School Market Value, By Distribution Channel, 2020–2030 ($Million)
Table 29.Singapore Back-To-School Market Value, By Product Type, 2020–2030 ($Million)
Table 30.Singapore Back-To-School Market Value, By Distribution Channel, 2020–2030 ($Million)
Table 31.Vietnam Back-To-School Market Value, By Product Type, 2020–2030 ($Million)
Table 32.Vietnam Back-To-School Market Value, By Distribution Channel, 2020–2030 ($Million)
Table 33.Rest Of Asia-Pacific Back-To-School Market Value, By Product Type, 2020–2030 ($Million)
Table 34.Rest Of Asia-Pacific Back-To-School Market Value, By Distribution Channel, 2020–2030 ($Million)
Table 35.Acco Brands: Key Executives
Table 36.Acco Brands: Company Snapshot
Table 37.Acco Brands: Operating Segments
Table 38.Acco Brands: Product Portfolio
Table 39.Acco Brands: R&D Expenditure, 2018–2020 ($Million)
Table 40.Acco Brands: Net Sales, 2018–2020 ($Million)
Table 41.Adidas Ag: Key Executives
Table 42.Adidas Ag: Company Snapshot
Table 43.Adidas Ag: Product Portfolio
Table 44.Adidas Ag: R&D Expenditure, 2018–2020 ($Million)
Table 45.Adidas Ag: Net Sales, 2018–2020 ($Million)
Table 46.Harlequin International Group Pty Ltd.: Key Executives
Table 47.Harlequin International Group Pty Ltd.: Company Snapshot
Table 48.Harlequin International Group Pty Ltd.: Product Portfolio
Table 49.Itc Limited: Key Executives
Table 50.Itc Limited: Company Snapshot
Table 51.Itc Limited: Operating Segments
Table 52.Itc Limited: Product Portfolio
Table 53.Itc Limited: R&D Expenditure, 2018–2020 ($Million)
Table 54.Itc Limited: Net Sales, 2018–2020 ($Million)
Table 55.Kokuyo Camlin Ltd.: Key Executives
Table 56.Kokuyo Camlin Ltd.: Company Snapshot
Table 57.Kokuyo Camlin Ltd.: Product Portfolio
Table 58.Kokuyo Camlin Ltd.: R&D Expenditure, 2018–2020 ($Million)
Table 59.Kokuyo Camlin Ltd.: Net Sales, 2018–2020 ($Million)
Table 60.Mitsubishi Pencil Co., Ltd.: Key Executives
Table 61.Mitsubishi Pencil Co., Ltd.: Company Snapshot
Table 62.Mitsubishi Pencil Co., Ltd.: Product Portfolio
Table 63.Mitsubishi Pencil Co., Ltd.: Net Sales, 2018–2020 ($Million)
Table 64.Pelikan International Corporation Berhad: Key Executives
Table 65.Pelikan International Corporation Berhad: Company Snapshot
Table 66.Pelikan International Corporation Berhad: Operating Segments
Table 67.Pelikan International Corporation Berhad: Product Portfolio
Table 68.Pelikan International Corporation Berhad: R&D Expenditure, 2018–2020 ($Million)
Table 69.Pelikan International Corporation Berhad: Net Sales, 2018–2020 ($Million)
Table 70.Puma Se: Key Executives
Table 71.Puma Se: Company Snapshot
Table 72.Puma Se: Operating Segments
Table 73.Puma Se: Product Portfolio
Table 74.Puma Se: R&D Expenditure, 2018–2020 ($Million)
Table 75.Puma Se: Net Sales, 2018–2020 ($Million)
Table 76.Wh Smith Plc: Key Executives
Table 77.Wh Smith Plc: Company Snapshot
Table 78.Wh Smith Plc: Operating Segments
Table 79.Wh Smith Plc: Product Portfolio
Table 80.Wh Smith Plc: Net Sales, 2018–2020 ($Million)
Table 81.Zebra Pen Corp.: Key Executives
Table 82.Zebra Pen Corp.: Company Snapshot
Table 83.Zebra Pen Corp.: Product Portfolio
List Of Figures
Figure 01.Key Market Segments
Figure 02.Asia-Pacific Back-To-School Market Snapshot, 2021–2030
Figure 03.Top Impacting Factors
Figure 04.Top Investment Pockets
Figure 05.Moderate Bargaining Power Of Suppliers
Figure 06.High Bargaining Power Of Buyers
Figure 07.Low Threat Of Substitution
Figure 08.Moderate Threat Of New Entrants
Figure 09.High Intensity Of Competitive Rivalry
Figure 10.Asia-Pacific Back-To-School Market, By Product Type, 2020 (%)
Figure 11.Comparative Value Share Analysis Of Asia-Pacific Back-To-School Market For Backpack, By Country, 2020 & 2030 (%)
Figure 12.Comparative Value Share Analysis Of Back-To-School Market For Electronic, By Country, 2020 & 2030 (%)
Figure 13.Comparative Value Share Analysis Of Back-To-School Market For Stationery, By Country, 2020 & 2030 (%)
Figure 14.Comparative Value Share Analysis Of Back-To-School Market For Clothing, By Country, 2020 & 2030 (%)
Figure 15.Comparative Value Share Analysis Of Back-To-School Market For Shoes, By Country, 2020 & 2030 (%)
Figure 16.Comparative Value Share Analysis Of Back-To-School Market For Others, By Country, 2020 & 2030 (%)
Figure 17.Asia-Pacific Back-To-School Market, By Distribution Channel, 2020 (%)
Figure 18.Comparative Value Share Analysis Of Back-To-School For Hypermarket/Supermarket, By Country, 2020 & 2030 (%)
Figure 19.Comparative Value Share Analysis Of Back-To-School For E-Commerce, By Country, 2020 & 2030 (%)
Figure 20.Comparative Value Share Analysis Of Back-To-School Via Dollar Stores, By Country, 2020 & 2030 (%)
Figure 21.Comparative Value Share Analysis Of Back-To-School For Specialty Stores, By Country, 2020 & 2030 (%)
Figure 22.Comparative Value Share Analysis Of Back-To-School For Others, By Country, 2020 & 2030 (%)
Figure 23.Asia-Pacific Back-To-School Market, By Country, 2020 (%)
Figure 24.China Back-To-School Market Value, 2020-2030 ($Million)
Figure 25.India Back-To-School Market Value, 2020-2030 ($Million)
Figure 26.Japan Back-To-School Market Value, 2020-2030 ($Million)
Figure 27.Australia Back-To-School Market Value, 2020-2030 ($Million)
Figure 28.South Korea Back-To-School Market Value, 2020-2030 ($Million)
Figure 29.Indonesia Back-To-School Market Value, 2020-2030 ($Million)
Figure 30.Malaysia Back-To-School Market Value, 2020-2030 ($Million)
Figure 31.Singapore Back-To-School Market Value, 2020-2030 ($Million)
Figure 32.Vietnam Back-To-School Market Value, 2020-2030 ($Million)
Figure 33.Rest Of Asia-Pacific Back-To-School Market Value, 2020-2030 ($Million)
Figure 34.Competitive Dashboard Of Top 10 Key Players
Figure 35.Competitive Heatmap Of Top 10 Key Players
Figure 36.Product Mapping Of Top 10 Key Players
Figure 37.Top Winning Strategies, By Year, 2018–2021*
Figure 38.Top Winning Strategies, By Development, 2018–2021* (%)
Figure 39.Top Winning Strategies, By Company, 2018–2021*
Figure 40.Player Positioning Of Top 10 Key Players
Figure 41.Acco Brands: R&D Expenditure, 2018–2020 ($Million)
Figure 42.Acco Brands: Net Sales, 2018–2020 ($Million)
Figure 43.Acco Brands: Revenue Share By Segment, 20120 (%)
Figure 44.Acco Brands: Revenue Share By Region, 2020 (%)
Figure 45.Adidas Ag: R&D Expenditure, 2018–2020 ($Million)
Figure 46.Adidas Ag: Net Sales, 2018–2020 ($Million)
Figure 47.Adidas Ag: Revenue Share By Segment, 2020 (%)
Figure 48.Itc Limited: R&D Expenditure, 2018–2020 ($Million)
Figure 49.Itc Limited: Net Sales, 2018–2020 ($Million)
Figure 50.Itc Limited: Revenue Share By Segment, 2020 (%)
Figure 51.Itc Limited: Revenue Share By Region, 2020 (%)
Figure 52.Kokuyo Camlin Ltd.: R&D Expenditure, 2018–2020 ($Million)
Figure 53.Kokuyo Camlin Ltd.: Net Sales, 2018–2020 ($Million)
Figure 54.Mitsubishi Pencil Co., Ltd.: Net Sales, 2018–2020 ($Million)
Figure 55.Pelikan International Corporation Berhad: R&D Expenditure, 2018–2020 ($Million)
Figure 56.Pelikan International Corporation Berhad: Net Sales, 2018–2020 ($Million)
Figure 57.Pelikan International Corporation Berhad: Revenue Share By Segment, 2019 (%)
Figure 58.Puma Se: R&D Expenditure, 2018–2020 ($Million)
Figure 59.Puma Se: Net Sales, 2018–2020 ($Million)
Figure 60.Puma Se: Revenue Share By Segment, 2020 (%)
Figure 61.Wh Smith Plc: Net Sales, 2018–2020 ($Million)
Figure 62.Wh Smith Plc: Revenue Share By Segment, 2020 (%
$6169
$10665
HAVE A QUERY?
OUR CUSTOMER

SIMILAR REPORTS