IoT in Retail Market Statistics 2029
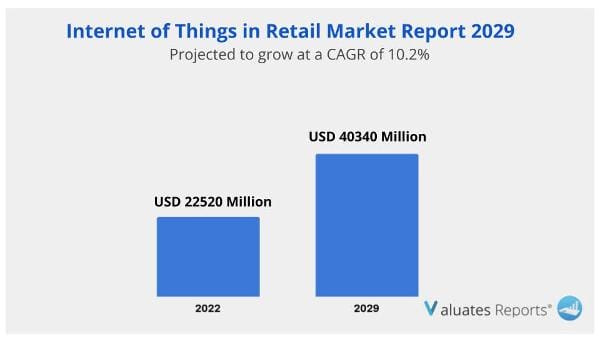
The global Internet of Things in Retail market was valued at US$ 22520 million in 2022 and is anticipated to reach US$ 40340 million by 2029, witnessing a CAGR of 10.2% during the forecast period 2023-2029. Major factors that are expected to drive the growth of IoT in Retail Market size include steadily declining IoT-based sensor and connectivity prices, increased acceptance of smart payment solutions, and consumer demand for a seamless shopping experience.
IoT in Retail refers to the use of a range of Internet of Things technologies and management methods in the retail industry. IoT offers retailers opportunities for the development of an ecosystem that connects the physical and digital world. The retail industry has witnessed wide utilization of connected products by adopting an integrated platform.
IoT in Retail Market Growth Factors
The utilization of IoT in Predictive Equipment Maintenance by retailers is expected to increase the IoT in Retail Market size. Warehouses will often experience equipment failure or fault detection issues. Cooling systems specifically used for cold storage purposes are now equipped with sensors that aid in the retail analytics of the products.
Since every product undergoes a long value chain journey, it is important to keep track of where it stands. IoT has made it easier to know exactly how near or far the product from its destination store is with sensors and GPS technology. This use of IoT in Smart Transportation is expected to increase the IoT in Retail Market size.
The declining cost of sensors worldwide helps businesses to deploy them in even smaller web-based solutions and, in turn, increases the IoT in retail market size. In enhanced devices, the main function of these modules is to collect the surrounding information and forward it to management systems.
It is expected that Bluetooth Low Energy (BLE) will see the highest growth over the forecast period as this technology is gaining popularity in pre-tailing, payments, and post-payment operations.
Over the forecast period, APAC is projected to have the highest growth potential in the IoT in the retail market. This rise can be attributed to ongoing smart city projects and the region's fast-declining sensor costs. China's adoption of IoT technologies is enormous, and India is showing significant growth.
Leading Players in the IoT in Retail Market
- IBM Corporation
- Impinj
- Allerin Tech Pvt
- RetailNext
- Others
IoT in Retail Market by Type
IoT in Retail Market by Application
- Physical Business
- E-commerce
IoT in Retail Market by Region
- United States
- Europe
- China
- Japan
- South Korea
- Other Regions
IoT in Retail Market by Consumption by Region
- North America
- United States
- Canada
- Mexico
- Asia-Pacific
- China
- India
- Japan
- South Korea
- Australia
- Indonesia
- Malaysia
- Philippines
- Thailand
- Vietnam
- Europe
- Germany
- France
- UK
- Italy
- Russia
- Rest of Europe
- Central & South America
- Brazil
- Rest of South America
- Middle East & Africa
- GCC Countries
- Turkey
- Egypt
- South Africa
- Rest of Middle East & Africa
Scope of the IoT in Retail Market Report
| Report Metric |
Details |
| Report Name |
IoT in Retail Market |
| The market size in 2022 |
USD 22520 Million |
| The revenue forecast in 2029 |
USD 40340 Million |
| Growth Rate |
Compound Annual Growth Rate (CAGR) of 10.2% from 2023 to 2029 |
| Market size available for years |
2023-2029 |
| Forecast units |
Value (USD) |
| Segments covered |
Type, Application and Region |
| Report coverage |
Revenue & volume forecast, company share, competitive landscape, growth factors, and trends |
| Geographic regions covered |
North America, Europe, Asia Pacific, Latin America, Middle East & Africa |
Frequently Asked Questions About This Report
1. How big is the IoT in Retail Market?
Ans. The global Internet of Things in Retail market was valued at US$ 22520 million in 2022 and is anticipated to reach US$ 40340 million by 2029, witnessing a CAGR of 10.2% during the forecast period 2023-2029.
2. What is the IoT in Retail Market Growth?
Ans. The global IoT in Retail Market is expected to witness a compound annual growth rate of 10.2% during the forecast period 2023-2029.
3. Who are the leading players in IoT in Retail Market?
Ans. Some key players operating in the IoT in Retail Market are IBM Corporation, Impinj, Allerin Tech Pvt, RetailNext & Others.
4. What factors will drive the growth of the IoT in Retail Market?
Ans. Major factors that are expected to drive the growth of IoT in Retail Market size include steadily declining IoT-based sensor and connectivity prices, increased acceptance of smart payment solutions, and consumer demand for a seamless shopping experience.
Recommended Reports
Retail & Smart Systems
IoT Chips & Hardware
IoT Sensors & Devices
07/24/25
1 Report Overview
1.1 Study Scope
1.2 Market Analysis by Type
1.2.1 Global Internet of Things in Retail Market Size Growth Rate by Type: 2018 VS 2022 VS 2029
1.2.2 Beacons
1.2.3 RFID Tags
1.2.4 Sensors
1.2.5 Wearables
1.2.6 Others
1.3 Market by Application
1.3.1 Global Internet of Things in Retail Market Growth by Application: 2018 VS 2022 VS 2029
1.3.2 Physical Business
1.3.3 E-commerce
1.4 Study Objectives
1.5 Years Considered
1.6 Years Considered
2 Global Growth Trends
2.1 Global Internet of Things in Retail Market Perspective (2018-2029)
2.2 Internet of Things in Retail Growth Trends by Region
2.2.1 Global Internet of Things in Retail Market Size by Region: 2018 VS 2022 VS 2029
2.2.2 Internet of Things in Retail Historic Market Size by Region (2018-2023)
2.2.3 Internet of Things in Retail Forecasted Market Size by Region (2024-2029)
2.3 Internet of Things in Retail Market Dynamics
2.3.1 Internet of Things in Retail Industry Trends
2.3.2 Internet of Things in Retail Market Drivers
2.3.3 Internet of Things in Retail Market Challenges
2.3.4 Internet of Things in Retail Market Restraints
3 Competition Landscape by Key Players
3.1 Global Top Internet of Things in Retail Players by Revenue
3.1.1 Global Top Internet of Things in Retail Players by Revenue (2018-2023)
3.1.2 Global Internet of Things in Retail Revenue Market Share by Players (2018-2023)
3.2 Global Internet of Things in Retail Market Share by Company Type (Tier 1, Tier 2, and Tier 3)
3.3 Players Covered: Ranking by Internet of Things in Retail Revenue
3.4 Global Internet of Things in Retail Market Concentration Ratio
3.4.1 Global Internet of Things in Retail Market Concentration Ratio (CR5 and HHI)
3.4.2 Global Top 10 and Top 5 Companies by Internet of Things in Retail Revenue in 2022
3.5 Internet of Things in Retail Key Players Head office and Area Served
3.6 Key Players Internet of Things in Retail Product Solution and Service
3.7 Date of Enter into Internet of Things in Retail Market
3.8 Mergers & Acquisitions, Expansion Plans
4 Internet of Things in Retail Breakdown Data by Type
4.1 Global Internet of Things in Retail Historic Market Size by Type (2018-2023)
4.2 Global Internet of Things in Retail Forecasted Market Size by Type (2024-2029)
5 Internet of Things in Retail Breakdown Data by Application
5.1 Global Internet of Things in Retail Historic Market Size by Application (2018-2023)
5.2 Global Internet of Things in Retail Forecasted Market Size by Application (2024-2029)
6 North America
6.1 North America Internet of Things in Retail Market Size (2018-2029)
6.2 North America Internet of Things in Retail Market Growth Rate by Country: 2018 VS 2022 VS 2029
6.3 North America Internet of Things in Retail Market Size by Country (2018-2023)
6.4 North America Internet of Things in Retail Market Size by Country (2024-2029)
6.5 United States
6.6 Canada
7 Europe
7.1 Europe Internet of Things in Retail Market Size (2018-2029)
7.2 Europe Internet of Things in Retail Market Growth Rate by Country: 2018 VS 2022 VS 2029
7.3 Europe Internet of Things in Retail Market Size by Country (2018-2023)
7.4 Europe Internet of Things in Retail Market Size by Country (2024-2029)
7.5 Germany
7.6 France
7.7 U.K.
7.8 Italy
7.9 Russia
7.10 Nordic Countries
8 Asia-Pacific
8.1 Asia-Pacific Internet of Things in Retail Market Size (2018-2029)
8.2 Asia-Pacific Internet of Things in Retail Market Growth Rate by Region: 2018 VS 2022 VS 2029
8.3 Asia-Pacific Internet of Things in Retail Market Size by Region (2018-2023)
8.4 Asia-Pacific Internet of Things in Retail Market Size by Region (2024-2029)
8.5 China
8.6 Japan
8.7 South Korea
8.8 Southeast Asia
8.9 India
8.10 Australia
9 Latin America
9.1 Latin America Internet of Things in Retail Market Size (2018-2029)
9.2 Latin America Internet of Things in Retail Market Growth Rate by Country: 2018 VS 2022 VS 2029
9.3 Latin America Internet of Things in Retail Market Size by Country (2018-2023)
9.4 Latin America Internet of Things in Retail Market Size by Country (2024-2029)
9.5 Mexico
9.6 Brazil
10 Middle East & Africa
10.1 Middle East & Africa Internet of Things in Retail Market Size (2018-2029)
10.2 Middle East & Africa Internet of Things in Retail Market Growth Rate by Country: 2018 VS 2022 VS 2029
10.3 Middle East & Africa Internet of Things in Retail Market Size by Country (2018-2023)
10.4 Middle East & Africa Internet of Things in Retail Market Size by Country (2024-2029)
10.5 Turkey
10.6 Saudi Arabia
10.7 UAE
11 Key Players Profiles
11.1 IBM Corporation
11.1.1 IBM Corporation Company Detail
11.1.2 IBM Corporation Business Overview
11.1.3 IBM Corporation Internet of Things in Retail Introduction
11.1.4 IBM Corporation Revenue in Internet of Things in Retail Business (2018-2023)
11.1.5 IBM Corporation Recent Development
11.2 Impinj
11.2.1 Impinj Company Detail
11.2.2 Impinj Business Overview
11.2.3 Impinj Internet of Things in Retail Introduction
11.2.4 Impinj Revenue in Internet of Things in Retail Business (2018-2023)
11.2.5 Impinj Recent Development
11.3 Allerin Tech Pvt
11.3.1 Allerin Tech Pvt Company Detail
11.3.2 Allerin Tech Pvt Business Overview
11.3.3 Allerin Tech Pvt Internet of Things in Retail Introduction
11.3.4 Allerin Tech Pvt Revenue in Internet of Things in Retail Business (2018-2023)
11.3.5 Allerin Tech Pvt Recent Development
11.4 RetailNext
11.4.1 RetailNext Company Detail
11.4.2 RetailNext Business Overview
11.4.3 RetailNext Internet of Things in Retail Introduction
11.4.4 RetailNext Revenue in Internet of Things in Retail Business (2018-2023)
11.4.5 RetailNext Recent Development
12 Analyst's Viewpoints/Conclusions
13 Appendix
13.1 Research Methodology
13.1.1 Methodology/Research Approach
13.1.2 Data Source
13.2 Disclaimer
13.3 Author Details
List of Tables
Table 1. Global Internet of Things in Retail Market Size Growth Rate by Type (US$ Million): 2018 VS 2022 VS 2029
Table 2. Key Players of Beacons
Table 3. Key Players of RFID Tags
Table 4. Key Players of Sensors
Table 5. Key Players of Wearables
Table 6. Key Players of Others
Table 7. Global Internet of Things in Retail Market Size Growth by Application (US$ Million): 2018 VS 2022 VS 2029
Table 8. Global Internet of Things in Retail Market Size by Region (US$ Million): 2018 VS 2022 VS 2029
Table 9. Global Internet of Things in Retail Market Size by Region (2018-2023) & (US$ Million)
Table 10. Global Internet of Things in Retail Market Share by Region (2018-2023)
Table 11. Global Internet of Things in Retail Forecasted Market Size by Region (2024-2029) & (US$ Million)
Table 12. Global Internet of Things in Retail Market Share by Region (2024-2029)
Table 13. Internet of Things in Retail Market Trends
Table 14. Internet of Things in Retail Market Drivers
Table 15. Internet of Things in Retail Market Challenges
Table 16. Internet of Things in Retail Market Restraints
Table 17. Global Internet of Things in Retail Revenue by Players (2018-2023) & (US$ Million)
Table 18. Global Internet of Things in Retail Market Share by Players (2018-2023)
Table 19. Global Top Internet of Things in Retail Players by Company Type (Tier 1, Tier 2, and Tier 3) & (based on the Revenue in Internet of Things in Retail as of 2022)
Table 20. Ranking of Global Top Internet of Things in Retail Companies by Revenue (US$ Million) in 2022
Table 21. Global 5 Largest Players Market Share by Internet of Things in Retail Revenue (CR5 and HHI) & (2018-2023)
Table 22. Key Players Headquarters and Area Served
Table 23. Key Players Internet of Things in Retail Product Solution and Service
Table 24. Date of Enter into Internet of Things in Retail Market
Table 25. Mergers & Acquisitions, Expansion Plans
Table 26. Global Internet of Things in Retail Market Size by Type (2018-2023) & (US$ Million)
Table 27. Global Internet of Things in Retail Revenue Market Share by Type (2018-2023)
Table 28. Global Internet of Things in Retail Forecasted Market Size by Type (2024-2029) & (US$ Million)
Table 29. Global Internet of Things in Retail Revenue Market Share by Type (2024-2029)
Table 30. Global Internet of Things in Retail Market Size by Application (2018-2023) & (US$ Million)
Table 31. Global Internet of Things in Retail Revenue Market Share by Application (2018-2023)
Table 32. Global Internet of Things in Retail Forecasted Market Size by Application (2024-2029) & (US$ Million)
Table 33. Global Internet of Things in Retail Revenue Market Share by Application (2024-2029)
Table 34. North America Internet of Things in Retail Market Size Growth Rate by Country (US$ Million): 2018 VS 2022 VS 2029
Table 35. North America Internet of Things in Retail Market Size by Country (2018-2023) & (US$ Million)
Table 36. North America Internet of Things in Retail Market Size by Country (2024-2029) & (US$ Million)
Table 37. Europe Internet of Things in Retail Market Size Growth Rate by Country (US$ Million): 2018 VS 2022 VS 2029
Table 38. Europe Internet of Things in Retail Market Size by Country (2018-2023) & (US$ Million)
Table 39. Europe Internet of Things in Retail Market Size by Country (2024-2029) & (US$ Million)
Table 40. Asia-Pacific Internet of Things in Retail Market Size Growth Rate by Region (US$ Million): 2018 VS 2022 VS 2029
Table 41. Asia-Pacific Internet of Things in Retail Market Size by Region (2018-2023) & (US$ Million)
Table 42. Asia-Pacific Internet of Things in Retail Market Size by Region (2024-2029) & (US$ Million)
Table 43. Latin America Internet of Things in Retail Market Size Growth Rate by Country (US$ Million): 2018 VS 2022 VS 2029
Table 44. Latin America Internet of Things in Retail Market Size by Country (2018-2023) & (US$ Million)
Table 45. Latin America Internet of Things in Retail Market Size by Country (2024-2029) & (US$ Million)
Table 46. Middle East & Africa Internet of Things in Retail Market Size Growth Rate by Country (US$ Million): 2018 VS 2022 VS 2029
Table 47. Middle East & Africa Internet of Things in Retail Market Size by Country (2018-2023) & (US$ Million)
Table 48. Middle East & Africa Internet of Things in Retail Market Size by Country (2024-2029) & (US$ Million)
Table 49. IBM Corporation Company Detail
Table 50. IBM Corporation Business Overview
Table 51. IBM Corporation Internet of Things in Retail Product
Table 52. IBM Corporation Revenue in Internet of Things in Retail Business (2018-2023) & (US$ Million)
Table 53. IBM Corporation Recent Development
Table 54. Impinj Company Detail
Table 55. Impinj Business Overview
Table 56. Impinj Internet of Things in Retail Product
Table 57. Impinj Revenue in Internet of Things in Retail Business (2018-2023) & (US$ Million)
Table 58. Impinj Recent Development
Table 59. Allerin Tech Pvt Company Detail
Table 60. Allerin Tech Pvt Business Overview
Table 61. Allerin Tech Pvt Internet of Things in Retail Product
Table 62. Allerin Tech Pvt Revenue in Internet of Things in Retail Business (2018-2023) & (US$ Million)
Table 63. Allerin Tech Pvt Recent Development
Table 64. RetailNext Company Detail
Table 65. RetailNext Business Overview
Table 66. RetailNext Internet of Things in Retail Product
Table 67. RetailNext Revenue in Internet of Things in Retail Business (2018-2023) & (US$ Million)
Table 68. RetailNext Recent Development
Table 69. Research Programs/Design for This Report
Table 70. Key Data Information from Secondary Sources
Table 71. Key Data Information from Primary Sources
List of Figures
Figure 1. Global Internet of Things in Retail Market Size Comparison by Type (2023-2029) & (US$ Million)
Figure 2. Global Internet of Things in Retail Market Share by Type: 2022 VS 2029
Figure 3. Beacons Features
Figure 4. RFID Tags Features
Figure 5. Sensors Features
Figure 6. Wearables Features
Figure 7. Others Features
Figure 8. Global Internet of Things in Retail Market Size Comparison by Application (2023-2029) & (US$ Million)
Figure 9. Global Internet of Things in Retail Market Share by Application: 2022 VS 2029
Figure 10. Physical Business Case Studies
Figure 11. E-commerce Case Studies
Figure 12. Internet of Things in Retail Report Years Considered
Figure 13. Global Internet of Things in Retail Market Size (US$ Million), Year-over-Year: 2018-2029
Figure 14. Global Internet of Things in Retail Market Size, (US$ Million), 2018 VS 2022 VS 2029
Figure 15. Global Internet of Things in Retail Market Share by Region: 2022 VS 2029
Figure 16. Global Internet of Things in Retail Market Share by Players in 2022
Figure 17. Global Top Internet of Things in Retail Players by Company Type (Tier 1, Tier 2, and Tier 3) & (based on the Revenue in Internet of Things in Retail as of 2022)
Figure 18. The Top 10 and 5 Players Market Share by Internet of Things in Retail Revenue in 2022
Figure 19. North America Internet of Things in Retail Market Size YoY Growth (2018-2029) & (US$ Million)
Figure 20. North America Internet of Things in Retail Market Share by Country (2018-2029)
Figure 21. United States Internet of Things in Retail Market Size YoY Growth (2018-2029) & (US$ Million)
Figure 22. Canada Internet of Things in Retail Market Size YoY Growth (2018-2029) & (US$ Million)
Figure 23. Europe Internet of Things in Retail Market Size YoY Growth (2018-2029) & (US$ Million)
Figure 24. Europe Internet of Things in Retail Market Share by Country (2018-2029)
Figure 25. Germany Internet of Things in Retail Market Size YoY Growth (2018-2029) & (US$ Million)
Figure 26. France Internet of Things in Retail Market Size YoY Growth (2018-2029) & (US$ Million)
Figure 27. U.K. Internet of Things in Retail Market Size YoY Growth (2018-2029) & (US$ Million)
Figure 28. Italy Internet of Things in Retail Market Size YoY Growth (2018-2029) & (US$ Million)
Figure 29. Russia Internet of Things in Retail Market Size YoY Growth (2018-2029) & (US$ Million)
Figure 30. Nordic Countries Internet of Things in Retail Market Size YoY Growth (2018-2029) & (US$ Million)
Figure 31. Asia-Pacific Internet of Things in Retail Market Size YoY Growth (2018-2029) & (US$ Million)
Figure 32. Asia-Pacific Internet of Things in Retail Market Share by Region (2018-2029)
Figure 33. China Internet of Things in Retail Market Size YoY Growth (2018-2029) & (US$ Million)
Figure 34. Japan Internet of Things in Retail Market Size YoY Growth (2018-2029) & (US$ Million)
Figure 35. South Korea Internet of Things in Retail Market Size YoY Growth (2018-2029) & (US$ Million)
Figure 36. Southeast Asia Internet of Things in Retail Market Size YoY Growth (2018-2029) & (US$ Million)
Figure 37. India Internet of Things in Retail Market Size YoY Growth (2018-2029) & (US$ Million)
Figure 38. Australia Internet of Things in Retail Market Size YoY Growth (2018-2029) & (US$ Million)
Figure 39. Latin America Internet of Things in Retail Market Size YoY Growth (2018-2029) & (US$ Million)
Figure 40. Latin America Internet of Things in Retail Market Share by Country (2018-2029)
Figure 41. Mexico Internet of Things in Retail Market Size YoY Growth (2018-2029) & (US$ Million)
Figure 42. Brazil Internet of Things in Retail Market Size YoY Growth (2018-2029) & (US$ Million)
Figure 43. Middle East & Africa Internet of Things in Retail Market Size YoY Growth (2018-2029) & (US$ Million)
Figure 44. Middle East & Africa Internet of Things in Retail Market Share by Country (2018-2029)
Figure 45. Turkey Internet of Things in Retail Market Size YoY Growth (2018-2029) & (US$ Million)
Figure 46. Saudi Arabia Internet of Things in Retail Market Size YoY Growth (2018-2029) & (US$ Million)
Figure 47. IBM Corporation Revenue Growth Rate in Internet of Things in Retail Business (2018-2023)
Figure 48. Impinj Revenue Growth Rate in Internet of Things in Retail Business (2018-2023)
Figure 49. Allerin Tech Pvt Revenue Growth Rate in Internet of Things in Retail Business (2018-2023)
Figure 50. RetailNext Revenue Growth Rate in Internet of Things in Retail Business (2018-2023)
Figure 51. Bottom-up and Top-down Approaches for This Report
Figure 52. Data Triangulation
Figure 53. Key Executives Interviewed

