
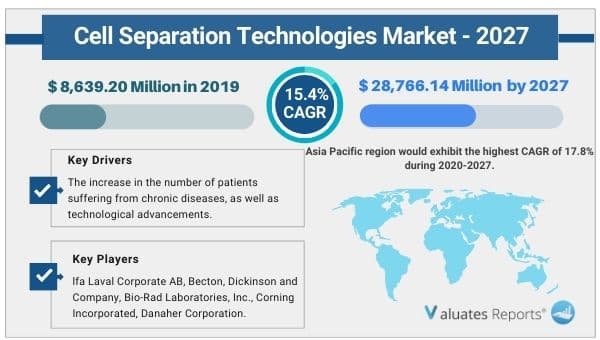
The global cell separation technologies market size was valued at USD 8,639.20 Million in 2019 and is projected to reach USD 28,766.14 Million by 2027, registering a CAGR of 15.4% from 2020 to 2027.
Cell separation is the process of removing one cell population from another within a biological sample, such as blood or tissue. The separation of one or more cell types from other cells is a critical step in biological research and clinical testing. Moreover, cell separation is a key part of many life sciences, from stem cell and oncology research to routine clinical diagnosis. Additionally, cell separation technology preferred over pathological treatment and conventional diagnostic procedures. Using cell separation technique, root cause of any disease is predicted. And later, treatment is provided on the same basis. The technique aims at removal of disease from cell level, leaving no trace for reoccurrence of disease in future. The recent expansion of the field of cell separation is linked to an increase the mortality rate due to chronic diseases as majority of these diseases can be treated using cell-based therapies.
The COVID-19 outbreak that started from Wuhan city of China has now wide spread globally. Almost every nation is dealing with the outbreak. Researchers around the world are working earnestly to study SARS CoV-2, the coronavirus responsible for the COVID-19 pandemic. The emergence of COVID-19 has changed life. This is a fast-moving and deadly pandemic that requires novel, next-generation technology to enable ongoing research and advanced diagnostic testing. Many cell separation technology companies are offering their products to study COVID-19 infection and also helps in vaccine development, which includes Stemcell Technologies Inc., Akadeum Life Sciences, Miltenyi Biotec, Nanocellect Biomedical and others. For instance, Nanocellect Biomedical offers WOLF benchtop cell sorter uses sterile, disposable cartridges with no cross-contamination between samples and fits inside a biosafety cabinet ensuring the safe handling of biohazard materials. COVID-19 researchers can utilize the WOLF cell sorter for optimal sample preparation in single-cell “-omics”, cell isolation for culturing, or antibody discovery. Whether performing immune profiling, antibody discovery, or functional assays, the WOLF in lab can ensure the ability to continue while core facilities are still shut down in this situation.
The growth of the global cell separation technologies market is majorly driven by increase in number of patients suffering from chronic disease and technological advancements in cell technologies. In addition, surge in focus on personalized medicines for early detection of disease, selection of appropriate treatment, and determination of the prognosis of the therapy. However, ethical issues related to embryonic stem cell separation and high cost of cell based research hinder the market growth. Conversely, high market potential in untapped emerging economies are expected to provide lucrative growth opportunities for the cell separation technologies market growth.
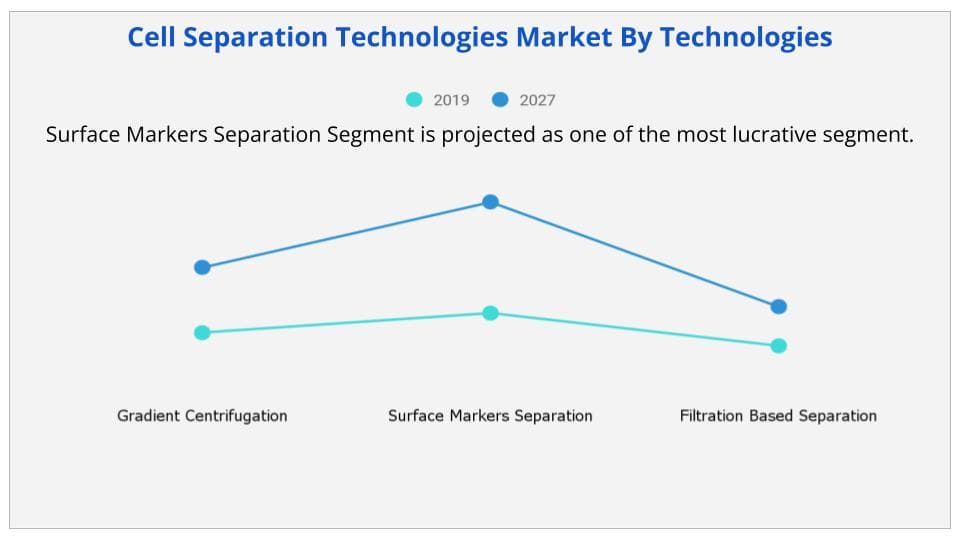
The cell separation technologies market is segmented on the basis of technology, product, application, end user, and region. By product, the market is bifurcated into instruments and consumables. On the basis of technology, the cell separation technologies market is divided into gradient centrifugation, surface markers separation, and filtration based separation. Surface markers separation is further classified into fluorescence activated cell sorting and magnetic cell sorting. On the basis of application, the market is classified into oncology research, neuroscience research, stem cell research, microbiology, immunology research and other application. By end user, the market is segmented into academic institute, biotechnology & biopharmaceutical companies, and cell banks. Region wise, it is analyzed across North America, Europe, Asia-Pacific, and LAMEA.
By product, the consumable segment accounted for the largest market share in 2019, and is expected to maintain its dominance during the forecast period, owing to increase in investments by the major players in the development of technologically advanced consumable products as well as the frequent use of consumables are the major factors which fuels the growth of this segment.
On the basis of technology, the surface markers separation segment is expected to register highest CAGR during the forecast period, owing to the fact that fluorescence activated cell sorting (FACS) technology is highly versatile and has a high throughput, as well as fluorescence activated cell sorting technology is now the standard in many clinical and research labs.
North America accounted for the largest share of revenue in 2019, and is anticipated to maintain its dominance from 2020 to 2027, due to high expenditure on R&D, presence of major players & their product availability, and well-established healthcare infrastructure in the region. However, Asia-Pacific is expected to register highest CAGR during the forecast period, as Governments of Asian countries are investing in the development of healthcare infrastructure for continuous research in stem cell and targeted therapies, as well as rise is medical tourism.
Some of the key players operating in the market include Alfa Laval Corporate AB, Becton, Dickinson and Company, Bio-Rad Laboratories, Inc., Corning Incorporated, Danaher Corporation, Merck KGaA, Miltenyi Biotec Inc., Pluriselect GmbH, Stemcell Technologies Inc., and Thermo Fisher Scientific. The other players (not profiled in the report) in the value chain include Akadeum Life Sciences, Cytiva Lifesciences, Terumo, 10X Genomics, Zeiss, PerkinElmer, Inc., and among others.
|
Report Metric |
Details |
|
Report Name |
Cell Separation Technologies Market |
|
Market size value in 2019 |
USD 8,639.20 Million |
|
Revenue forecast in 2027 |
USD 28,766.14 Million |
|
Growth Rate |
15.4% |
|
Base year considered |
2019 |
|
Forecast Period |
2020-2027 |
|
By Product |
Instruments and Consumables |
|
By Technology |
Gradient Centrifugation, Surface Markers Separation, and Filtration Based Separation |
|
By Application |
Oncology Research, Neuroscience Research, Stem Cell Research, Microbiology, Immunology Research and Other Application |
|
By End User |
Research Laboratories & Institutes, Biotechnology & Biopharmaceutical Companies and Cell Banks |
|
Report Coverage |
Revenue & volume forecast, company share, competitive landscape, growth factors, and trends |
|
Segments Covered |
By Type, Application, and Region |
|
Geographic Regions Covered |
North America, Europe, Asia Pacific, Latin America, Middle East & Africa |
Ans. The global cell separation technologies market size was valued at USD 8,639.20 Million in 2019 and is projected to reach USD 28,766.14 Million by 2027, registering a CAGR of 15.4% from 2020 to 2027.
Ans. Some of the key players operating in the market include Alfa Laval Corporate AB, Becton, Dickinson and Company, Bio-Rad Laboratories, Inc., Corning Incorporated, Danaher Corporation, Merck KGaA, Miltenyi Biotec Inc., Pluriselect GmbH, Stemcell Technologies Inc
Ans. Yes, the report includes a COVID-19 impact analysis. Also, it is further extended into every individual segment of the report.
CHAPTER 1:INTRODUCTION
1.1.Report description
1.2.Key benefits for stakeholders
1.3.Key market segments
1.4.Research methodology
1.4.1.Secondary research
1.4.2.Primary research
1.4.3.Analyst tools and models
1.4.4.Primary research
CHAPTER 2:EXECUTIVE SUMMARY
2.1.Key findings of the study
2.2.CXO perspective
CHAPTER 3:MARKET OVERVIEW
3.1.Market definition and scope
3.2.Key findings
3.2.1.Top investment pockets
3.2.2.Top player positioning, 2019
3.3.Top winning strategies
3.4.Porter’s five forces analysis
3.5.Market dynamics
3.5.1.Drivers
3.5.1.1.Increasing number of patients suffering from chronic disease
3.5.1.2.Technological advancements
3.5.1.3.Rise in focus on personalized medicine
3.5.2.Restraints
3.5.2.1.Ethical issues related to embryonic stem cell separation
3.5.2.2.High cost of cell based research
3.5.3.Opportunity
3.5.3.1.Emerging market
3.6.COVID-19 impact analysis for cell separation technologies market
CHAPTER 4:CELL SEPARATION TECHNOLOGIES MARKET, BY PRODUCT
4.1.Overview
4.1.1.Market size and forecast
4.2.Instruments
4.2.1.Key market trends, growth factors, and opportunities
4.2.2.Market size and forecast, by region
4.2.3.Market analysis, by country
4.3.Consumables
4.3.1.Key market trends, growth factors, and opportunities
4.3.2.Market size and forecast, by region
4.3.3.Market analysis, by country
CHAPTER 5:CELL SEPARATION TECHNOLOGIES MARKET, BY TECHNOLOGY
5.1.Overview
5.1.1.Market size and forecast
5.2.Gradient Centrifugation
5.2.1.Market size and forecast, by region
5.2.2.Market analysis, by country
5.3.Surface Markers Separation
5.3.1.Market size and forecast, by type
5.3.1.1.Fluorescence activated cell sorting
5.3.1.1.1.Market size and forecast
5.3.1.2.Magnetic cell sorting
5.3.1.2.1.Market size and forecast
5.3.2.Market size and forecast, by region
5.3.3.Market analysis, by country
5.4.Filtration Based Separation
5.4.1.Market size and forecast, by region
5.4.2.Market analysis, by country
CHAPTER 6:CELL SEPARATION TECHNOLOGIES MARKET, BY APPLICATION
6.1.Overview
6.1.1.Market size and forecast
6.2.Oncology Research
6.2.1.Market size and forecast, by region
6.2.2.Market analysis, by country
6.3.Neuroscience Research
6.3.1.Market size and forecast, by region
6.3.2.Market analysis, by country
6.4.Stem Cell Research
6.4.1.Market size and forecast, by region
6.4.2.Market analysis, by country
6.5.Microbiology
6.5.1.Market size and forecast, by region
6.5.2.Market analysis, by country
6.6.Immunology Research
6.6.1.Market size and forecast, by region
6.6.2.Market analysis, by country
6.7.Others
6.7.1.Market size and forecast, by region
6.7.2.Market analysis, by country
CHAPTER 7:CELL SEPARATION TECHNOLOGIES MARKET, BY END USER
7.1.Overview
7.1.1.Market size and forecast
7.2.Research Laboratories & Institutes
7.2.1.Market size and forecast, by region
7.2.2.Market analysis, by country
7.3.Biotechnology & Biopharmaceutical Companies
7.3.1.Market size and forecast, by region
7.3.2.Market analysis, by country
7.4.Cell Banks
7.4.1.Market size and forecast, by region
7.4.2.Market analysis, by country
CHAPTER 8:CELL SEPARATION TECHNOLOGY MARKET, BY REGION
8.1.Overview
8.1.1.Market size and forecast
8.2.North America
8.2.1.Key market trends, growth factors, and opportunities
8.2.2.North America Cell Separation Technology Market, by country
8.2.2.1.U.S.
8.2.2.1.1.Market size and forecast, by product
8.2.2.1.2.Market size and forecast, by technology
8.2.2.1.3.Market size and forecast, by application
8.2.2.1.4.Market size and forecast, by end user
8.2.2.2.Canada
8.2.2.2.1.Market size and forecast, by product
8.2.2.2.2.Market size and forecast, by technology
8.2.2.2.3.Market size and forecast, by application
8.2.2.2.4.Market size and forecast, by end user
8.2.2.3.Mexico
8.2.2.3.1.Market size and forecast, by product
8.2.2.3.2.Market size and forecast, by technology
8.2.2.3.3.Market size and forecast, by application
8.2.2.3.4.Market size and forecast, by end user
8.2.3.North America market size and forecast, by product type
8.2.4.North America market size and forecast, by technology
8.2.5.North America Market size and forecast, by application
8.2.6.North America market size and forecast, by end user
8.3.Europe
8.3.1.Key market trends, growth factors, and opportunities
8.3.2.Europe Cell Separation Technology Market, by country
8.3.2.1.Germany
8.3.2.1.1.Market size and forecast, by product
8.3.2.1.2.Market size and forecast, by technology
8.3.2.1.3.Market size and forecast, by application
8.3.2.1.4.Market size and forecast, by end user
8.3.2.2.UK
8.3.2.2.1.Market size and forecast, by product
8.3.2.2.2.Market size and forecast, by technology
8.3.2.2.3.Market size and forecast, by application
8.3.2.2.4.Market size and forecast, by end user
8.3.2.3.France
8.3.2.3.1.Market size and forecast, by product
8.3.2.3.2.Market size and forecast, by technology
8.3.2.3.3.Market size and forecast, by application
8.3.2.3.4.Market size and forecast, by end user
8.3.2.4.Italy
8.3.2.4.1.Market size and forecast, by product
8.3.2.4.2.Market size and forecast, by technology
8.3.2.4.3.Market size and forecast, by application
8.3.2.4.4.Market size and forecast, by end user
8.3.2.5.Spain
8.3.2.5.1.Market size and forecast, by product
8.3.2.5.2.Market size and forecast, by technology
8.3.2.5.3.Market size and forecast, by application
8.3.2.5.4.Market size and forecast, by end user
8.3.2.6.Rest of Europe
8.3.2.6.1.Market size and forecast, by product
8.3.2.6.2.Market size and forecast, by technology
8.3.2.6.3.Market size and forecast, by application
8.3.2.6.4.Market size and forecast, by end user
8.3.3.Europe market size and forecast, by product
8.3.4.Europe market size and forecast, by technology
8.3.5.Europe market size and forecast, by application
8.3.6.Europe market size and forecast, by end user
8.4.Asia-Pacific
8.4.1.Key market trends, growth factors, and opportunities
8.4.2.Asia-Pacific Cell Separation Technology Market, by country
8.4.2.1.China
8.4.2.1.1.Market size and forecast, by product
8.4.2.1.2.Market size and forecast, by technology
8.4.2.1.3.Market size and forecast, by application
8.4.2.1.4.Market size and forecast, by end user
8.4.2.2.Japan
8.4.2.2.1.Market size and forecast, by product
8.4.2.2.2.Market size and forecast, by technology
8.4.2.2.3.Market size and forecast, by application
8.4.2.2.4.Market size and forecast, by end user
8.4.2.3.Australia
8.4.2.3.1.Market size and forecast, by product
8.4.2.3.2.Market size and forecast, by technology
8.4.2.3.3.Market size and forecast, by application
8.4.2.3.4.Market size and forecast, by end user
8.4.2.4.India
8.4.2.4.1.Market size and forecast, by product
8.4.2.4.2.Market size and forecast, by technology
8.4.2.4.3.Market size and forecast, by application
8.4.2.4.4.Market size and forecast, by end user
8.4.2.5.Rest of Asia-Pacific
8.4.2.5.1.Market size and forecast, by product
8.4.2.5.2.Market size and forecast, by technology
8.4.2.5.3.Market size and forecast, by application
8.4.2.5.4.Market size and forecast, by end user
8.4.3.Asia-Pacific market size and forecast, by product
8.4.4.Asia-Pacific Market size and forecast, by technology
8.4.5.Asia-Pacific market size and forecast, by application
8.4.6.Asia-Pacific market size and forecast, by end user
8.5.LAMEA
8.5.1.Key market trends, growth factors, and opportunities
8.5.2.LAMEA Cell Separation Technology Market, by country
8.5.2.1.Brazil
8.5.2.1.1.Market size and forecast, by product
8.5.2.1.2.Market size and forecast, by technology
8.5.2.1.3.Market size and forecast, by application
8.5.2.1.4.Market size and forecast, by end user
8.5.2.2.Saudi Arabia
8.5.2.2.1.Market size and forecast, by product
8.5.2.2.2.Market size and forecast, by technology
8.5.2.2.3.Market size and forecast, by application
8.5.2.2.4.Market size and forecast, by end user
8.5.2.3.South Africa
8.5.2.3.1.Market size and forecast, by product
8.5.2.3.2.Market size and forecast, by technology
8.5.2.3.3.Market size and forecast, by application
8.5.2.3.4.Market size and forecast, by end user
8.5.2.4.Rest of LAMEA
8.5.2.4.1.Market size and forecast, by product
8.5.2.4.2.Market size and forecast, by technology
8.5.2.4.3.Market size and forecast, by application
8.5.2.4.4.Market size and forecast, by end user
8.5.3.LAMEA market size and forecast, by product
8.5.4.LAMEA market size and forecast, by technology
8.5.5.LAMEA market size and forecast, by application
8.5.6.LAMEA market size and forecast, by end user
CHAPTER 9:COMPANY PROFILES
9.1.ALFA LAVAL CORPORATE AB
9.1.1.Company overview
9.1.2.Company snapshot
9.1.3.Operating business segments
9.1.4.Product portfolio
9.1.5.Business performance
9.1.6.Key strategic moves and developments
9.2.BECTON, DICKINSON AND COMPANY
9.2.1.Company overview
9.2.2.Company snapshot
9.2.3.Operating business segments
9.2.4.Product portfolio
9.2.5.Business performance
9.2.6.Key strategic moves and developments
9.3.BIO-RAD LABORATORIES, INC.
9.3.1.1.Company overview
9.3.1.2.Company snapshot
9.3.1.3.Operating business segments
9.3.1.4.Product portfolio
9.3.1.5.Business performance
9.4.CORNING INCORPORATED
9.4.1.Company overview
9.4.2.Company snapshot
9.4.3.Operating business segments
9.4.4.Product portfolio
9.4.5.Business performance
9.4.6.Key strategic moves and developments
9.5.DANAHER CORPORATION.
9.5.1.Company overview
9.5.2.Company snapshot
9.5.3.Operating business segments
9.5.4.Product portfolio
9.5.5.Business performance
9.5.6.Key strategic moves and developments
9.6.MERCK KGAA
9.6.1.Company overview
9.6.2.Company snapshot
9.6.3.Operating business segments
9.6.4.Product portfolio
9.6.5.Business performance
9.6.6.Key strategic moves and developments
9.7.MILTENYI BIOTEC INC.
9.7.1.Company overview
9.7.2.Company snapshot
9.7.3.Operating business segments
9.7.4.Product portfolio
9.7.5.Key strategic moves and developments
9.8.PLURISELECT GmbH
9.8.1.Company overview
9.8.2.Company snapshot
9.8.3.Operating business segments
9.8.4.Product portfolio
9.9.STEMCELL TECHNOLOGIES INC
9.9.1.Company overview
9.9.2.Company snapshot
9.9.3.Operating business segments
9.9.4.Product portfolio
9.10.THERMO FISHER SCIENTIFIC, INC.
9.10.1.Company overview
9.10.2.Company snapshot
9.10.3.Operating business segments
9.10.4.Product portfolio
9.10.5.Business performance
LIST OF TABLES
TABLE 01.CELL SEPARATION TECHNOLOGIES MARKET, BY PRODUCT, 2019–2027 ($MILLION)
TABLE 02.CELL SEPARATION TECHNOLOGIES MARKET FOR INSTRUMENTS, BY REGION, 2019–2027 ($MILLION)
TABLE 03.CELL SEPARATION TECHNOLOGIES MARKET FOR CONSUMABLES, BY REGION, 2019–2027 ($MILLION)
TABLE 04.CELL SEPARATION TECHNOLOGIES MARKET, BY TECHNOLOGY, 2019–2027 ($MILLION)
TABLE 05.CELL SEPARATION TECHNOLOGIES MARKET FOR GRADIENT CENTRIFUGATION, BY REGION, 2019–2027 ($MILLION)
TABLE 06.SURFACE MARKERS SEPARATION MARKET, BY TYPE, 2019–2027 ($MILLION)
TABLE 07.CELL SEPARATION TECHNOLOGIES MARKET FOR SURFACE MARKERS SEPARATION, BY REGION, 2019–2027 ($MILLION)
TABLE 08.CELL SEPARATION TECHNOLOGIES MARKET FOR FILTRATION BASED SEPARATION, BY REGION, 2019–2027 ($MILLION)
TABLE 09.CELL SEPARATION TECHNOLOGIES MARKET, BY APPLICATION, 2019–2027 ($MILLION)
TABLE 10.CELL SEPARATION TECHNOLOGIES MARKET FOR ONCOLOGY RESEARCH, BY REGION, 2019–2027 ($MILLION)
TABLE 11.CELL SEPARATION TECHNOLOGIES MARKET FOR NEUROSCIENCE RESEARCH, BY REGION, 2019–2027 ($MILLION)
TABLE 12.CELL SEPARATION TECHNOLOGIES MARKET FOR STEM CELL RESEARCH, BY REGION, 2019–2027 ($MILLION)
TABLE 13.CELL SEPARATION TECHNOLOGIES MARKET FOR MICROBIOLOGY, BY REGION, 2019–2027 ($MILLION)
TABLE 14.CELL SEPARATION TECHNOLOGIES MARKET FOR IMMUNOLOGY RESEARCH, BY REGION, 2019–2027 ($MILLION)
TABLE 15.CELL SEPARATION TECHNOLOGIES MARKET FOR OTHER APPLICATIONS, BY REGION, 2019–2027 ($MILLION)
TABLE 16.CELL SEPARATION TECHNOLOGIES MARKET, BY END USER, 2019–2027 ($MILLION)
TABLE 17.CELL SEPARATION TECHNOLOGIES MARKET FOR RESEARCH LABORATORIES & INSTITUTES, BY REGION, 2019–2027 ($MILLION)
TABLE 18.CELL SEPARATION TECHNOLOGIES MARKET FOR BIOTECHNOLOGY & BIOPHARMACEUTICAL COMPANIES, BY REGION, 2019–2027 ($MILLION)
TABLE 19.CELL SEPARATION TECHNOLOGIES MARKET FOR CELL BANKS, BY REGION, 2019–2027 ($MILLION)
TABLE 20.CELL SEPARATION TECHNOLOGY MARKET, BY REGION, 2019–2027 ($MILLION)
TABLE 21.NORTH AMERICA CELL SEPARATION TECHNOLOGY MARKET, BY COUNTRY, 2019–2027 ($MILLION)
TABLE 22.U.S. CELL SEPARATION TECHNOLOGY MARKET, BY PRODUCT, 2019–2027 ($MILLION)
TABLE 23.U.S. CELL SEPARATION TECHNOLOGY MARKET, BY TECHNOLOGY, 2019–2027 ($MILLION)
TABLE 24.U.S. CELL SEPARATION TECHNOLOGY MARKET, BY APPLICATION, 2019–2027 ($MILLION)
TABLE 25.U.S. CELL SEPARATION TECHNOLOGY MARKET, BY END USER, 2019–2027 ($MILLION)
TABLE 26.CANADA CELL SEPARATION TECHNOLOGY MARKET, BY PRODUCT, 2019–2027 ($MILLION)
TABLE 27.CANADA CELL SEPARATION TECHNOLOGY MARKET, BY TECHNOLOGY, 2019–2027 ($MILLION)
TABLE 28.CANADA CELL SEPARATION TECHNOLOGY MARKET, BY APPLICATION, 2019–2027 ($MILLION)
TABLE 29.CANADA CELL SEPARATION TECHNOLOGY MARKET, BY END USER, 2019–2027 ($MILLION)
TABLE 30.MEXICO CELL SEPARATION TECHNOLOGY MARKET, BY PRODUCT, 2019–2027 ($MILLION)
TABLE 31.MEXICO CELL SEPARATION TECHNOLOGY MARKET, BY TECHNOLOGY, 2019–2027 ($MILLION)
TABLE 32.MEXICO CELL SEPARATION TECHNOLOGY MARKET, BY APPLICATION, 2019–2027 ($MILLION)
TABLE 33.MEXICO CELL SEPARATION TECHNOLOGY MARKET, BY END USER, 2019–2027 ($MILLION)
TABLE 34.NORTH AMERICA CELL SEPARATION TECHNOLOGY MARKET, BY PRODUCT, 2019–2027 ($MILLION)
TABLE 35.NORTH AMERICA CELL SEPARATION TECHNOLOGY MARKET, BY TECHNOLOGY, 2019–2027 ($MILLION)
TABLE 36.NORTH AMERICA CELL SEPARATION TECHNOLOGY MARKET, BY APPLICATION, 2019–2027 ($MILLION)
TABLE 37.NORTH AMERICA CELL SEPARATION TECHNOLOGY MARKET, BY END USER, 2019–2027 ($MILLION)
TABLE 38.EUROPE CELL SEPARATION TECHNOLOGY MARKET, BY COUNTRY, 2019–2027 ($MILLION)
TABLE 39.GERMANY CELL SEPARATION TECHNOLOGY MARKET, BY PRODUCT, 2019–2027 ($MILLION)
TABLE 40.GERMANY CELL SEPARATION TECHNOLOGY MARKET, BY TECHNOLOGY, 2019–2027 ($MILLION)
TABLE 41.GERMANY CELL SEPARATION TECHNOLOGY MARKET, BY APPLICATION, 2019–2027 ($MILLION)
TABLE 42.GERMANY CELL SEPARATION TECHNOLOGY MARKET, BY END USER, 2019–2027 ($MILLION)
TABLE 43.UK CELL SEPARATION TECHNOLOGY MARKET, BY PRODUCT, 2019–2027 ($MILLION)
TABLE 44.UK CELL SEPARATION TECHNOLOGY MARKET, BY TECHNOLOGY, 2019–2027 ($MILLION)
TABLE 45.UK CELL SEPARATION TECHNOLOGY MARKET, BY APPLICATION, 2019–2027 ($MILLION)
TABLE 46.UK CELL SEPARATION TECHNOLOGY MARKET, BY END USER, 2019–2027 ($MILLION)
TABLE 47.FRANCE CELL SEPARATION TECHNOLOGY MARKET, BY PRODUCT, 2019–2027 ($MILLION)
TABLE 48.FRANCE CELL SEPARATION TECHNOLOGY MARKET, BY TECHNOLOGY, 2019–2027 ($MILLION)
TABLE 49.FRANCE CELL SEPARATION TECHNOLOGY MARKET, BY APPLICATION, 2019–2027 ($MILLION)
TABLE 50.FRANCE CELL SEPARATION TECHNOLOGY MARKET, BY END USER, 2019–2027 ($MILLION)
TABLE 51.ITALY CELL SEPARATION TECHNOLOGY MARKET, BY PRODUCT, 2019–2027 ($MILLION)
TABLE 52.ITALY CELL SEPARATION TECHNOLOGY MARKET, BY TECHNOLOGY, 2019–2027 ($MILLION)
TABLE 53.ITALY CELL SEPARATION TECHNOLOGY MARKET, BY APPLICATION, 2019–2027 ($MILLION)
TABLE 54.ITALY CELL SEPARATION TECHNOLOGY MARKET, BY END USER, 2019–2027 ($MILLION)
TABLE 55.SPAIN CELL SEPARATION TECHNOLOGY MARKET, BY PRODUCT, 2019–2027 ($MILLION)
TABLE 56.SPAIN CELL SEPARATION TECHNOLOGY MARKET, BY TECHNOLOGY, 2019–2027 ($MILLION)
TABLE 57.SPAIN CELL SEPARATION TECHNOLOGY MARKET, BY APPLICATION, 2019–2027 ($MILLION)
TABLE 58.SPAIN CELL SEPARATION TECHNOLOGY MARKET, BY END USER, 2019–2027 ($MILLION)
TABLE 59.REST OF EUROPE CELL SEPARATION TECHNOLOGY MARKET, BY PRODUCT, 2019–2027 ($MILLION)
TABLE 60.REST OF EUROPE CELL SEPARATION TECHNOLOGY MARKET, BY TECHNOLOGY, 2019–2027 ($MILLION)
TABLE 61.REST OF EUROPE CELL SEPARATION TECHNOLOGY MARKET, BY APPLICATION, 2019–2027 ($MILLION)
TABLE 62.REST OF EUROPE CELL SEPARATION TECHNOLOGY MARKET, BY END USER, 2019–2027 ($MILLION)
TABLE 63.EUROPE CELL SEPARATION TECHNOLOGY MARKET, BY PRODUCT, 2019–2027 ($MILLION)
TABLE 64.EUROPE CELL SEPARATION TECHNOLOGY MARKET, BY TECHNOLOGY, 2019–2027 ($MILLION)
TABLE 65.EUROPE CELL SEPARATION TECHNOLOGY MARKET, BY APPLICATION, 2019–2027 ($MILLION)
TABLE 66.EUROPE CELL SEPARATION TECHNOLOGY MARKET, BY END USER, 2019–2027 ($MILLION)
TABLE 67.ASIA-PACIFIC CELL SEPARATION TECHNOLOGY MARKET, BY COUNTRY, 2019–2027 ($MILLION)
TABLE 68.CHINA CELL SEPARATION TECHNOLOGY MARKET, BY PRODUCT, 2019–2027 ($MILLION)
TABLE 69.CHINA CELL SEPARATION TECHNOLOGY MARKET, BY TECHNOLOGY, 2019–2027 ($MILLION)
TABLE 70.CHINA CELL SEPARATION TECHNOLOGY MARKET, BY APPLICATION, 2019–2027 ($MILLION)
TABLE 71.CHINA CELL SEPARATION TECHNOLOGY MARKET, BY END USER, 2019–2027 ($MILLION)
TABLE 72.JAPAN CELL SEPARATION TECHNOLOGY MARKET, BY PRODUCT, 2019–2027 ($MILLION)
TABLE 73.JAPAN CELL SEPARATION TECHNOLOGY MARKET, BY TECHNOLOGY, 2019–2027 ($MILLION)
TABLE 74.JAPAN CELL SEPARATION TECHNOLOGY MARKET, BY APPLICATION, 2019–2027 ($MILLION)
TABLE 75.JAPAN CELL SEPARATION TECHNOLOGY MARKET, BY END USER, 2019–2027 ($MILLION)
TABLE 76.AUSTRALIA CELL SEPARATION TECHNOLOGY MARKET, BY PRODUCT, 2019–2027 ($MILLION)
TABLE 77.AUSTRALIA CELL SEPARATION TECHNOLOGY MARKET, BY TECHNOLOGY, 2019–2027 ($MILLION)
TABLE 78.AUSTRALIA CELL SEPARATION TECHNOLOGY MARKET, BY APPLICATION, 2019–2027 ($MILLION)
TABLE 79.AUSTRALIA CELL SEPARATION TECHNOLOGY MARKET, BY END USER, 2019–2027 ($MILLION)
TABLE 80.INDIA CELL SEPARATION TECHNOLOGY MARKET, BY PRODUCT, 2019–2027 ($MILLION)
TABLE 81.INDIA CELL SEPARATION TECHNOLOGY MARKET, BY TECHNOLOGY, 2019–2027 ($MILLION)
TABLE 82.INDIA CELL SEPARATION TECHNOLOGY MARKET, BY APPLICATION, 2019–2027 ($MILLION)
TABLE 83.INDIA CELL SEPARATION TECHNOLOGY MARKET, BY END USER, 2019–2027 ($MILLION)
TABLE 84.REST OF ASIA-PACIFIC CELL SEPARATION TECHNOLOGY MARKET, BY PRODUCT, 2019–2027 ($MILLION)
TABLE 85.REST OF ASIA-PACIFIC CELL SEPARATION TECHNOLOGY MARKET, BY TECHNOLOGY, 2019–2027 ($MILLION)
TABLE 86.REST OF ASIA-PACIFIC CELL SEPARATION TECHNOLOGY MARKET, BY APPLICATION, 2019–2027 ($MILLION)
TABLE 87.REST OF ASIA-PACIFIC CELL SEPARATION TECHNOLOGY MARKET, BY END USER, 2019–2027 ($MILLION)
TABLE 88.ASIA-PACIFIC CELL SEPARATION TECHNOLOGY MARKET, BY PRODUCT, 2019–2027 ($MILLION)
TABLE 89.ASIA-PACIFIC CELL SEPARATION TECHNOLOGY MARKET, BY TECHNOLOGY, 2019–2027 ($MILLION)
TABLE 90.ASIA-PACIFIC CELL SEPARATION TECHNOLOGY MARKET, BY APPLICATION, 2019–2027 ($MILLION)
TABLE 91.ASIA-PACIFIC CELL SEPARATION TECHNOLOGY MARKET, BY END USER, 2019–2027 ($MILLION)
TABLE 92.LAMEA CELL SEPARATION TECHNOLOGY MARKET, BY COUNTRY, 2019–2027 ($MILLION)
TABLE 93.BRAZIL CELL SEPARATION TECHNOLOGY MARKET, BY PRODUCT, 2019–2027 ($MILLION)
TABLE 94.BRAZIL CELL SEPARATION TECHNOLOGY MARKET, BY TECHNOLOGY, 2019–2027 ($MILLION)
TABLE 95.BRAZIL CELL SEPARATION TECHNOLOGY MARKET, BY APPLICATION, 2019–2027 ($MILLION)
TABLE 96.BRAZIL CELL SEPARATION TECHNOLOGY MARKET, BY END USER, 2019–2027 ($MILLION)
TABLE 97.SAUDI ARABIA CELL SEPARATION TECHNOLOGY MARKET, BY PRODUCT, 2019–2027 ($MILLION)
TABLE 98.SAUDI ARABIA CELL SEPARATION TECHNOLOGY MARKET, BY TECHNOLOGY, 2019–2027 ($MILLION)
TABLE 99.SAUDI ARABIA CELL SEPARATION TECHNOLOGY MARKET, BY APPLICATION, 2019–2027 ($MILLION)
TABLE 100.SAUDI ARABIA CELL SEPARATION TECHNOLOGY MARKET, BY END USER, 2019–2027 ($MILLION)
TABLE 101.SOUTH AFRICA CELL SEPARATION TECHNOLOGY MARKET, BY PRODUCT, 2019–2027 ($MILLION)
TABLE 102.SOUTH AFRICA CELL SEPARATION TECHNOLOGY MARKET, BY TECHNOLOGY, 2019–2027 ($MILLION)
TABLE 103.SOUTH AFRICA CELL SEPARATION TECHNOLOGY MARKET, BY APPLICATION, 2019–2027 ($MILLION)
TABLE 104.SOUTH AFRICA CELL SEPARATION TECHNOLOGY MARKET, BY END USER, 2019–2027 ($MILLION)
TABLE 105.REST OF LAMEA CELL SEPARATION TECHNOLOGY MARKET, BY PRODUCT, 2019–2027 ($MILLION)
TABLE 106.REST OF LAMEA CELL SEPARATION TECHNOLOGY MARKET, BY TECHNOLOGY, 2019–2027 ($MILLION)
TABLE 107.REST OF LAMEA CELL SEPARATION TECHNOLOGY MARKET, BY APPLICATION, 2019–2027 ($MILLION)
TABLE 108.REST OF LAMEA CELL SEPARATION TECHNOLOGY MARKET, BY END USER, 2019–2027 ($MILLION)
TABLE 109.LAMEA CELL SEPARATION TECHNOLOGY MARKET, BY PRODUCT, 2019–2027 ($MILLION)
TABLE 110.LAMEA CELL SEPARATION TECHNOLOGY MARKET, BY TECHNOLOGY, 2019–2027 ($MILLION)
TABLE 111.LAMEA CELL SEPARATION TECHNOLOGY MARKET, BY APPLICATION, 2019–2027 ($MILLION)
TABLE 112.LAMEA CELL SEPARATION TECHNOLOGY MARKET, BY END USER, 2019–2027 ($MILLION)
TABLE 113.ALFA LAVAL: COMPANY SNAPSHOT
TABLE 114.ALFA LAVAL: OPERATING SEGMENTS
TABLE 115.ALFA LAVAL: PRODUCT PORTFOLIO
TABLE 116.BD: COMPANY SNAPSHOT
TABLE 117.BD: OPERATING SEGMENTS
TABLE 118.BD: PRODUCT PORTFOLIO
TABLE 119.BIO-RAD: COMPANY SNAPSHOT
TABLE 120.BIO-RAD: OERATING SEGMENT
TABLE 121.BIO-RAD: PRODUCT PORTFOLIO
TABLE 122.CORNING.: COMPANY SNAPSHOT
TABLE 123.CORNING: PRODUCT SEGMENTS
TABLE 124.CORNING: PRODUCT PORTFOLIO
TABLE 125.DANAHER: COMPANY SNAPSHOT
TABLE 126.DANAHER: OPERATING SEGMENTS
TABLE 127.DANAHER: PRODUCT PORTFOLIO
TABLE 128.MERCK: COMPANY SNAPSHOT
TABLE 129.MERCK: OPERATING SEGMENTS
TABLE 130.MERCK: PRODUCT PORTFOLIO
TABLE 131.MILTENYI: COMPANY SNAPSHOT
TABLE 132.MILTENYI: OPERATING SEGMENTS
TABLE 133.MILTENYI: PRODUCT PORTFOLIO
TABLE 134.MILTENYI: KEY STRATEGIC MOVES AND DEVELOPMENTS
TABLE 135.PLURISELECT: COMPANY SNAPSHOT
TABLE 136.PLURISELECT: OPERATING SEGMENTS
TABLE 137.PLURISELECT: PRODUCT PORTFOLIO
TABLE 138.STEMCELL: COMPANY SNAPSHOT
TABLE 139.STEMCELL: OPERATING SEGMENTS
TABLE 140.STEMCELL: PRODUCT PORTFOLIO
TABLE 141.THERMO FISHER SCIENTIFIC.: COMPANY SNAPSHOT
TABLE 142.THERMO FISHER SCIENTIFIC: PRODUCT SEGMENTS
TABLE 143.THERMO FISHER SCIENTIFIC: PRODUCT PORTFOLIO
LIST OF FIGURES
FIGURE 01.CELL SEPARATION TECHNOLOGIES MARKET SEGMENTATION
FIGURE 02.TOP INVESTMENT POCKETS IN CELL SEPARATION TECHNOLOGIESMARKET
FIGURE 03.TOP PLAYER POSITIONING, 2019
FIGURE 04.TOP WINNING STRATEGIES, BY YEAR, 2017-2020*
FIGURE 05.TOP WINNING STRATEGIES, BY DEVELOPMENT, 2017-2020* (%)
FIGURE 06.TOP WINNING STRATEGIES, BY COMPANY, 2017-2020*
FIGURE 07.MODERATE BARGAINING POWER OF SUPPLIERS
FIGURE 08.MODERATE BARGAINING POWER OF BUYERS
FIGURE 09.HIGH THREAT OF NEW ENTRANTS
FIGURE 10.MODERATE THREAT OF SUBSTITUTION
FIGURE 11.MODERATE COMPETITIVE RIVALRY
FIGURE 12.DRIVERS, RESTRAINTS, AND OPPORTUNITY
FIGURE 13.COMPARATIVE ANALYSIS OF CELL SEPARATION TECHNOLOGIES MARKET, FOR INSTRUMENTS BY COUNTRY, 2019–2027 (%)
FIGURE 14.COMPARATIVE ANALYSIS OF CELL SEPARATION TECHNOLOGIES MARKET, FOR CONSUMABLE BY COUNTRY, 2019–2027 (%)
FIGURE 15.COMPARATIVE ANALYSIS OF CELL SEPARATION TECHNOLOGIES MARKET, FOR GRADIENT CENTRIFUGATION BY COUNTRY, 2019–2027 (%)
FIGURE 16.SURFACE MARKERS SEPARATION MARKET FOR FLUORESCENCE ACTIVATED CELL SORTING, 2019-2027 ($MILLION)
FIGURE 17.SURFACE MARKERS SEPARATION MARKET FOR MAGNETIC CELL SORTING, 2019-2027 ($MILLION)
FIGURE 18.COMPARATIVE ANALYSIS OF CELL SEPARATION TECHNOLOGIES MARKET, FOR SURFACE MARKERS SEPARATION BY COUNTRY, 2019–2027 (%)
FIGURE 19.COMPARATIVE ANALYSIS OF CELL SEPARATION TECHNOLOGIES MARKET, FOR FILTRATION BASED SEPARATION BY COUNTRY, 2019–2027 (%)
FIGURE 20.COMPARATIVE ANALYSIS OF CELL SEPARATION TECHNOLOGIES MARKET, FOR ONCOLOGY RESEARCH BY COUNTRY, 2019–2027 (%)
FIGURE 21.COMPARATIVE ANALYSIS OF CELL SEPARATION TECHNOLOGIES MARKET, FOR NEUROSCIENCE RESEARCH BY COUNTRY, 2019–2027 (%)
FIGURE 22.COMPARATIVE ANALYSIS OF CELL SEPARATION TECHNOLOGIES MARKET, FOR STEM CELL RESEARCH BY COUNTRY, 2019–2027 (%)
FIGURE 23.COMPARATIVE ANALYSIS OF CELL SEPARATION TECHNOLOGIES MARKET, FOR MICROBIOLOGY BY COUNTRY, 2019–2027 (%)
FIGURE 24.COMPARATIVE ANALYSIS OF CELL SEPARATION TECHNOLOGIES MARKET, FOR IMMUNOLOGY RESEARCH BY COUNTRY, 2019–2027 (%)
FIGURE 25.COMPARATIVE ANALYSIS OF CELL SEPARATION TECHNOLOGIES MARKET, FOR OTHERS BY COUNTRY, 2019–2027 (%)
FIGURE 26.COMPARATIVE ANALYSIS OF CELL SEPARATION TECHNOLOGIES MARKET, FOR RESEARCH LABORATORIES AND INSTITUTES, BY COUNTRY, 2019–2027 (%)
FIGURE 27.COMPARATIVE ANALYSIS OF CELL SEPARATION TECHNOLOGIES MARKET, FOR BIOTECHNOLOGY & BIOPHARMACEUTICAL COMPANIES, BY COUNTRY, 2019–2027 (%)
FIGURE 28.COMPARATIVE ANALYSIS OF CELL SEPARATION TECHNOLOGIES MARKET, FOR CELL BANKS BY COUNTRY, 2019–2027 (%)
FIGURE 29.ALFA LAVAL: NET SALES, 2017–2019 ($MILLION)
FIGURE 30.ALFA LAVAL: REVENUE SHARE BY SEGMENT, 2019 (%)
FIGURE 31.ALFA LAVAL: REVENUE SHARE BY GEOGRAPHY, 2019 (%)
FIGURE 32.BD: NET SALES, 2017–2019 ($MILLION)
FIGURE 33.BD: REVENUE SHARE BY SEGMENT, 2019 (%)
FIGURE 34.BD: REVENUE SHARE BY GEOGRAPHY, 2019 (%)
FIGURE 35.BIO-RAD: NET SALES, 2017–2019 ($MILLION)
FIGURE 36.BIO-RAD: REVENUE SHARE BY SEGMENT, 2019 (%)
FIGURE 37.BIO-RAD: REVENUE SHARE BY REGION, 2019 (%)
FIGURE 38.CORNING.: NET SALES, 2017–2019 ($MILLION)
FIGURE 39.CORNING: REVENUE SHARE BY SEGMENTS, 2019 (%)
FIGURE 40.CORNING. REVENUE SHARE BY REGION, 2019 (%)
FIGURE 41.DANAHER: NET SALES, 2017–2019 ($MILLION)
FIGURE 42.DANAHER: REVENUE SHARE BY SEGMENT, 2019 (%)
FIGURE 43.DANAHER: REVENUE SHARE BY GEOGRAPHY, 2019 (%)
FIGURE 44.MERCK: NET SALES, 2017–2019 ($MILLION)
FIGURE 45.MERCK: REVENUE SHARE, BY SEGMENT, 2019 (%)
FIGURE 46.MERCK: REVENUE SHARE, BY REGION, 2019 (%)
FIGURE 47.THERMO FISHER SCIENTIFIC, INC.: NET SALES, 2017–2019 ($MILLION)
FIGURE 48.THERMO FISHER SCIENTIFIC, INC.: REVENUE SHARE BY SEGMENTS, 2019 (%)
FIGURE 49.THERMO FISHER SCIENTIFIC. REVENUE SHARE BY REGION, 2019 (%)
$5243
$7997
$5543
