
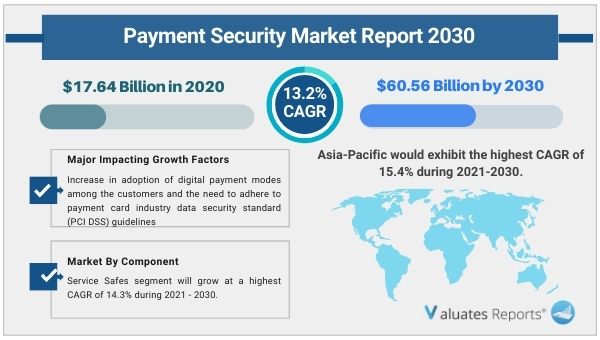
The global payment security market size was valued at $17.64 billion in 2020 and is projected to reach $60.56 billion by 2030, growing at a Compound Annual Growth Rate (CAGR) of 13.2% from 2021 to 2030. Payment security software is a type of information protection technology that reveals vulnerabilities, threats, and risks in a payment transaction system and prevents malicious attacks from intruders.
Payment security software is used to protect the customer’s confidential data from different types of vulnerabilities. Payment security software companies are increasingly designing next-generation solutions for consumer and enterprise-oriented services. In addition, government agencies are also demanding for a need to shift toward modern payment processing tools and techniques.
The report focuses on growth prospects, restraints, and trends of the global payment security market analysis. The study provides Porter’s five forces analysis to understand impact of various factors, such as bargaining power of suppliers, competitive intensity of competitors, threat of new entrants, threat of substitutes, and bargaining power of buyers, on the global payment security market share.
The outbreak of COVID-19 is anticipated to have a positive impact on growth of payment security market trends. This is attributed to increase in demand for online banking and adoption of cashless transaction caused due to pandemic. However, the pandemic has led to increase in the number of cybercrimes, which increased the adoption of payment security software.
In addition, increase in the adoption of e-commerce has also increased the online payment method, which increases the demand for payment security software across the globe. Furthermore, the FinTech & banking industry is increasingly adopting & investing in digitalized payments solutions, which is technology-driven transformation in payments industry to deal with the new directives & regulations of governments. This, as a result is accelerating the demand for payment security software globally.
Furthermore, payment security software is adopted in various banking and insurance organizations in their production units to identify the threats in the payment system and measure its potential vulnerabilities Furthermore, increase in adoption of digital payment modes among the customers and the need to adhere to payment card industry data security standard (PCI DSS) guidelines are some of the important factor that boost the growth of the market across the globe.
In addition, rising in fraudulent activities in e-commerce payment system positively impacts the growth of the payment security market. However, lack of trust on online banking is hampering the payment security market growth. On the contrary, increase in demand for advanced payment security solutions for digital ecommerce and rise in use of payment applications across different industry verticals are expected to offer remunerative opportunities for expansion of the market during the forecast period.
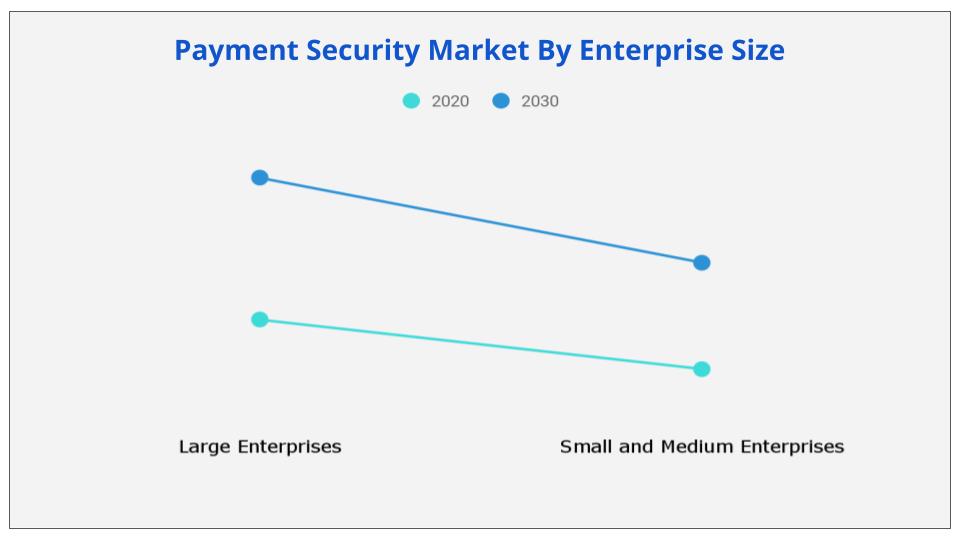
Depending on enterprise size, large enterprise is dominated the payment security market share in 2020, and is expected to continue this trend in the upcoming years, owing to increase in adoption of digital technology among the banks to collect customers personal information. However, SMEs segment is expected to provide lucrative opportunity to boost the growth of the market during upcoming years, due to increase in need of data protection technology for improving banking efficiencies, streamlining payment processes, and managing delegated policies.
Region wise, the payment security market was dominated by North America in 2020, and is expected to maintain this trend during the forecast period. This is attributed to increased demand for innovative payment security software among banks & financial institutions and surge in utilization of e-wallet payment, which offers relevant rewards & incentives among customers. However, Asia-Pacific is expected to grow at the fastest CAGR during the forecast period, due to high investments for digitalized payment platforms, adoption of new technologies such as artificial intelligence, analytics, big data, and rapid expansion of domestic business.
|
Report Metric |
Details |
|
Report Name |
Payment Security Market |
|
The market size in 2020 |
USD 17.64 Billion |
|
The revenue forecast in 2030 |
USD 60.56 Billion |
|
Growth Rate |
Compound Annual Growth Rate (CAGR) of 13.2% from 2021 to 2030 |
|
Market size available for years |
2021-2030 |
|
Forecast units |
Value (USD) |
|
Segments covered |
By Component, Platform, Organization Size and Industry Vertical, and Region |
|
Report coverage |
Revenue & volume forecast, company share, competitive landscape, growth factors, and trends |
|
Geographic regions covered |
North America, Europe, Asia Pacific, Latin America, Middle East & Africa |
Ans. The global payment security market size was valued at $17.64 billion in 2020 and is projected to reach $60.56 billion by 2030, growing at a Compound Annual Growth Rate (CAGR) of 13.2% from 2021 to 2030
Ans. COVID-19 pandemic is expected to positively impact the growth rate of the payment security market, owing to rising adoption of online payment services across the globe and surge in need for high security and safety transaction processing system across various industries.
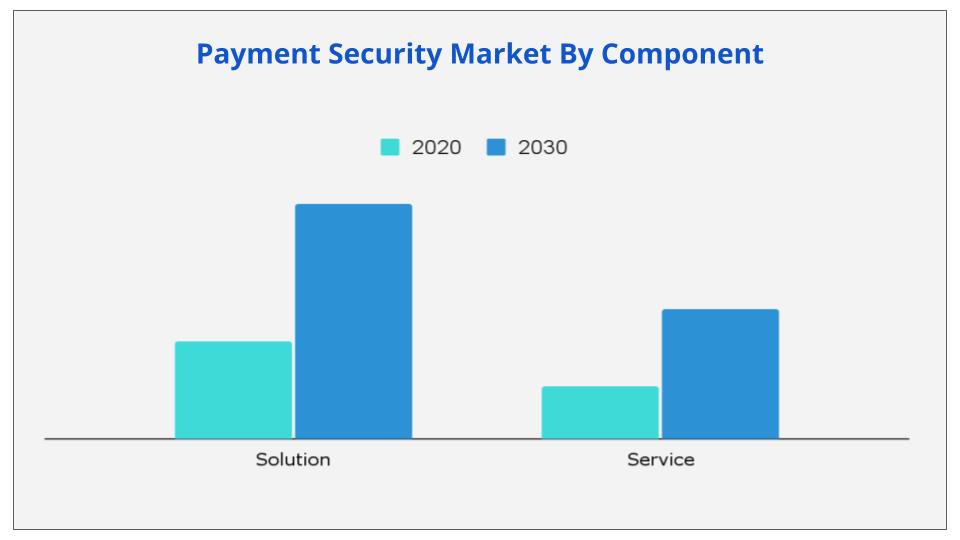
Ans. By Component, Service Safes segment will grow at a highest CAGR of 14.3% during 2021 - 2030.
Ans. Region wise, the payment security market was dominated by North America in 2020, and is expected to retain its position during the forecast period
Ans. The key players profiled in the payment security market analysis are Bluefin Payment Systems, Cybersource, Elavon Inc., Ingenico, Intelligent Payment Solutions Pvt Ltd., Paypal, Shift4 Payments, LLC, SISA, Signifyd, and Tokenex.
Ans. Increase in adoption of digital payment modes among the customers and the need to adhere to payment card industry data security standard (PCI DSS) guidelines are some of the important factors that boost the growth of the market across the globe
CHAPTER 1:INTRODUCTION
1.1.Report description
1.2.Key benefits for stakeholders
1.3.Key market segments
1.3.1.Secondary research
1.3.2.Primary research
1.3.3.Analyst tools & models
CHAPTER 2:EXECUTIVE SUMMARY
2.1.Key findings
2.1.1.Top impacting factors
2.1.2.Top investment pockets
2.2.CXO perspective
CHAPTER 3:MARKET OVERVIEW
3.1.Market definition and scope
3.2.Key forces shaping the global Payment security market
3.3.Patent analysis
3.3.1.By region (2000-2020)
3.3.2.By applicant
3.4.Case Studies
3.4.1.Case study 01
3.4.2.Case study 02
Market dynamics
3.4.3.Drivers
3.4.3.1.Increased adoption of digital payment modes
3.4.3.2.Need to adhere to PCI DSS Guidelines
3.4.3.3.Rise in fraudulent activities in e-commerce
3.4.4.Restraints
3.4.4.1.Lack of trust on online banking
3.4.4.2.Privacy & security concerns
3.4.5.Opportunity
3.4.5.1.Increasing use of payment applications across different industry verticals
3.4.5.2.Untapped potential of emerging economies
3.1.COVID-19 impact analysis on the payment security market
3.1.1.Impact on market size
3.1.2.Consumer trends, preferences, and budget impact
3.1.3.Economic impact
3.1.4.Strategies to tackle negative impact
CHAPTER 4:PAYMENT SECURITY MARKET, BY COMPONENT
4.1.Overview
4.2.Solution
4.2.1.Key market trends, growth factors, and opportunities
4.2.2.Market size and forecast, by region
4.2.3.Market analysis, by country
4.2.3.1.Payment security market, by solution type
4.2.3.2.Encryption
4.2.3.2.1.Market size and forecast, by region
4.2.3.2.2.Market analysis, by country
4.2.3.3.Tokenization
4.2.3.3.1.Market size and forecast, by region
4.2.3.3.2.Market analysis, by country
4.2.3.4.Fraud Detection & Prevention
4.2.3.4.1.Market size and forecast, by region
4.2.3.4.2.Market analysis, by country
4.3.Service
4.3.1.Key market trends, growth factors, and opportunities
4.3.2.Market size and forecast, by region
4.3.3.Market analysis, by country
CHAPTER 5:PAYMENT SECURITY MARKET, BY PLATFORM
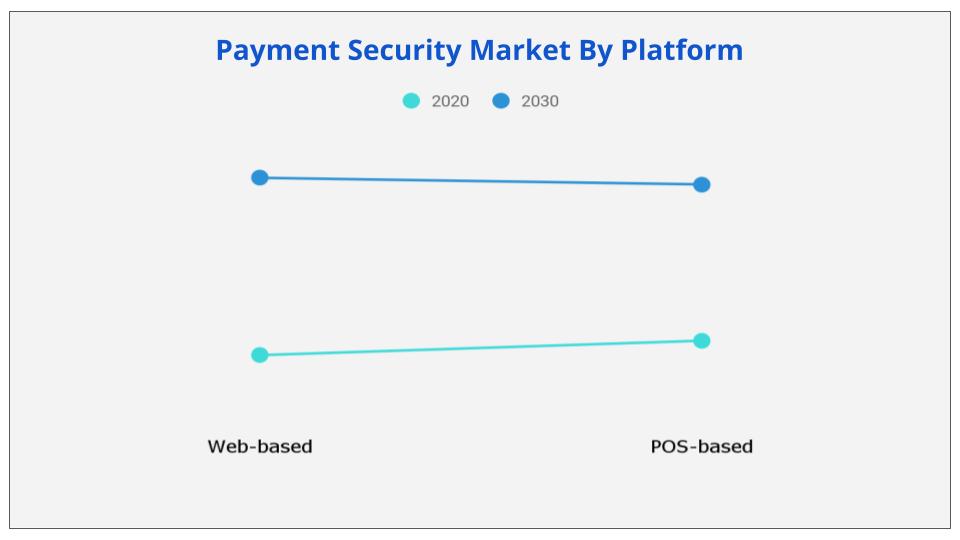
5.1.Overview
5.2.Web-based
5.2.1.Key market trends, growth factors, and opportunities
5.2.2.Market size and forecast, by region
5.2.3.Market analysis, by country
5.3.POS-based
5.3.1.Key market trends, growth factors, and opportunities
5.3.2.Market size and forecast, by region
5.3.3.Market analysis, by country
CHAPTER 6:PAYMENT SECURITY MARKET, BY ENTERPRISE SIZE
6.1.Overview
6.2.Large Enterprises
6.2.1.Key market trends, growth factors, and opportunities
6.2.2.Market size and forecast, by region
6.2.3.Market analysis, by country
6.3.SMEs
6.3.1.Key market trends, growth factors, and opportunities
6.3.2.Market size and forecast, by region
6.3.3.Market analysis, by country
CHAPTER 7:PAYMENT SECURITY MARKET, BY INDUSTRY VERTICAL
7.1.Overview
7.2.BFSI
7.2.1.Key market trends, growth factors, and opportunities
7.2.2.Market size and forecast, by region
7.2.3.Market analysis, by country
7.3.Government & Utilities
7.3.1.Key market trends, growth factors, and opportunities
7.3.2.Market size and forecast, by region
7.3.3.Market analysis, by country
7.4.IT & Telecom
7.4.1.Key market trends, growth factors, and opportunities
7.4.2.Market size and forecast, by region
7.4.3.Market analysis, by country
7.5.Healthcare
7.5.1.Key market trends, growth factors, and opportunities
7.5.2.Market size and forecast, by region
7.5.3.Market analysis, by country
7.6.Retail & E-Commerce
7.6.1.Key market trends, growth factors, and opportunities
7.6.2.Market size and forecast, by region
7.6.3.Market analysis, by country
7.7.Media & Entertainment
7.7.1.Key market trends, growth factors, and opportunities
7.7.2.Market size and forecast, by region
7.7.3.Market analysis, by country
7.8.Travel &Hospitality
7.8.1.Key market trends, growth factors, and opportunities
7.8.2.Market size and forecast, by region
7.8.3.Market analysis, by country
7.9.Others
7.9.1.Key market trends, growth factors, and opportunities
7.9.2.Market size and forecast, by region
7.9.3.Market analysis, by country
CHAPTER 8:PAYMENT SECURITY MARKET, BY REGION
8.1.Overview
8.1.1.Market size and forecast, by region
8.2.North America
8.2.1.Key market trends, growth factors, and opportunities
8.2.2.Market size and forecast, by component
8.2.3.Market size and forecast, by solution
8.2.4.Market size and forecast, by platform
8.2.5.Market size and forecast, by enterprise size
8.2.6.Market size and forecast, by industry vertical
8.2.7.Market size and forecast, by country
8.2.7.1.U.S.
8.2.7.1.1.Market size and forecast, by component
8.2.7.1.2.Market size and forecast, by solution
8.2.7.1.3.Market size and forecast, by platform
8.2.7.1.4.Market size and forecast, by enterprise size
8.2.7.1.5.Market size and forecast, by industry vertical
8.2.7.2.CANADA
8.2.7.2.1.Market size and forecast, by component
8.2.7.2.2.Market size and forecast, by solution
8.2.7.2.3.Market size and forecast, by platform
8.2.7.2.4.Market size and forecast, by enterprise size
8.2.7.2.5.Market size and forecast, by industry vertical
8.3.Europe
8.3.1.Key market trends, growth factors, and opportunities
8.3.2.Market size and forecast, by component
8.3.3.Market size and forecast, by solution
8.3.4.Market size and forecast, by platform
8.3.5.Market size and forecast, by enterprise size
8.3.6.Market size and forecast, by industry vertical
8.3.7.Market size and forecast, by country
8.3.7.1.UK
8.3.7.1.1.Market size and forecast, by component
8.3.7.1.2.Market size and forecast, by solution
8.3.7.1.3.Market size and forecast, by platform
8.3.7.1.4.Market size and forecast, by enterprise size
8.3.7.1.5.Market size and forecast, by industry vertical
8.3.7.2.GERMANY
8.3.7.2.1.Market size and forecast, by component
8.3.7.2.2.Market size and forecast, by solution
8.3.7.2.3.Market size and forecast, by platform
8.3.7.2.4.Market size and forecast, by enterprise size
8.3.7.2.5.Market size and forecast, by industry vertical
8.3.7.3.FRANCE
8.3.7.3.1.Market size and forecast, by component
8.3.7.3.2.Market size and forecast, by solution
8.3.7.3.3.Market size and forecast, by platform
8.3.7.3.4.Market size and forecast, by enterprise size
8.3.7.3.5.Market size and forecast, by industry vertical
8.3.7.4.SPAIN
8.3.7.4.1.Market size and forecast, by component
8.3.7.4.2.Market size and forecast, by solution
8.3.7.4.3.Market size and forecast, by platform
8.3.7.4.4.Market size and forecast, by enterprise size
8.3.7.4.5.Market size and forecast, by industry vertical
8.3.7.5.ITALY
8.3.7.5.1.Market size and forecast, by component
8.3.7.5.2.Market size and forecast, by solution
8.3.7.5.3.Market size and forecast, by platform
8.3.7.5.4.Market size and forecast, by enterprise size
8.3.7.5.5.Market size and forecast, by industry vertical
8.3.7.6.REST OF EUROPE
8.3.7.6.1.Market size and forecast, by component
8.3.7.6.2.Market size and forecast, by solution
8.3.7.6.3.Market size and forecast, by platform
8.3.7.6.4.Market size and forecast, by enterprise size
8.3.7.6.5.Market size and forecast, by industry vertical
8.4.Asia-Pacific
8.4.1.Key market trends, growth factors, and opportunities
8.4.2.Market size and forecast, by component
8.4.3.Market size and forecast, by solution
8.4.4.Market size and forecast, by platform
8.4.5.Market size and forecast, by enterprise size
8.4.6.Market size and forecast, by industry vertical
8.4.7.Market size and forecast, by country
8.4.7.1.CHINA
8.4.7.1.1.Market size and forecast, by component
8.4.7.1.2.Market size and forecast, by solution
8.4.7.1.3.Market size and forecast, by platform
8.4.7.1.4.Market size and forecast, by enterprise size
8.4.7.1.5.Market size and forecast, by industry vertical
8.4.7.2.INDIA
8.4.7.2.1.Market size and forecast, by component
8.4.7.2.2.Market size and forecast, by solution
8.4.7.2.3.Market size and forecast, by platform
8.4.7.2.4.Market size and forecast, by enterprise size
8.4.7.2.5.Market size and forecast, by industry vertical
8.4.7.3.JAPAN
8.4.7.3.1.Market size and forecast, by component
8.4.7.3.2.Market size and forecast, by solution
8.4.7.3.3.Market size and forecast, by platform
8.4.7.3.4.Market size and forecast, by enterprise size
8.4.7.3.5.Market size and forecast, by industry vertical
8.4.7.4.SOUTH KOREA
8.4.7.4.1.Market size and forecast, by component
8.4.7.4.2.Market size and forecast, by solution
8.4.7.4.3.Market size and forecast, by platform
8.4.7.4.4.Market size and forecast, by enterprise size
8.4.7.4.5.Market size and forecast, by industry vertical
8.4.7.5.AUSTRALIA
8.4.7.5.1.Market size and forecast, by component
8.4.7.5.2.Market size and forecast, by solution
8.4.7.5.3.Market size and forecast, by platform
8.4.7.5.4.Market size and forecast, by enterprise size
8.4.7.5.5.Market size and forecast, by industry vertical
8.4.7.6.REST OF ASIA-PACIFIC
8.4.7.6.1.Market size and forecast, by component
8.4.7.6.2.Market size and forecast, by solution
8.4.7.6.3.Market size and forecast, by platform
8.4.7.6.4.Market size and forecast, by enterprise size
8.4.7.6.5.Market size and forecast, by industry vertical
8.5.LAMEA
8.5.1.Key market trends, growth factors, and opportunities
8.5.2.Market size and forecast, by component
8.5.3.Market size and forecast, by solution
8.5.4.Market size and forecast, by platform
8.5.5.Market size and forecast, by enterprise size
8.5.6.Market size and forecast, by industry vertical
8.5.7.Market size and forecast, by country
8.5.7.1.LATIN AMERICA
8.5.7.1.1.Market size and forecast, by component
8.5.7.1.2.Market size and forecast, by solution
8.5.7.1.3.Market size and forecast, by platform
8.5.7.1.4.Market size and forecast, by enterprise size
8.5.7.1.5.Market size and forecast, by industry vertical
8.5.7.2.MIDDLE EAST
8.5.7.2.1.Market size and forecast, by component
8.5.7.2.2.Market size and forecast, by solution
8.5.7.2.3.Market size and forecast, by platform
8.5.7.2.4.Market size and forecast, by enterprise size
8.5.7.2.5.Market size and forecast, by industry vertical
8.5.7.3.AFRICA
8.5.7.3.1.Market size and forecast, by component
8.5.7.3.2.Market size and forecast, by solution
8.5.7.3.3.Market size and forecast, by platform
8.5.7.3.4.Market size and forecast, by enterprise size
8.5.7.3.5.Market size and forecast, by industry vertical
CHAPTER 9:COMPETITIVE LANDSCAPE
9.1.Key players positioning analysis, 2020
9.2.Competitive dashboard
9.3.Top winning strategies
CHAPTER 10:COMPANY PROFILE
10.1.Bluefin Payment Systems
10.1.1.Company overview
10.1.2.Key executives
10.1.3.Company snapshot
10.1.4.Product portfolio
10.1.5.Key strategic moves and developments
10.2.Braintree(PayPal Holdings, Inc.)
10.2.1.Company overview
10.2.2.Key executives
10.2.3.Company snapshot
10.2.4.Product portfolio
10.2.5.Business performance
10.3.CyberSource
10.3.1.Company overview
10.3.2.Key executives
10.3.3.Company snapshot
10.3.4.Product portfolio
10.3.5.Business performance
10.3.6.Key strategic moves and developments
10.4.Elavon, Inc.
10.4.1.Company overview
10.4.2.Key executive
10.4.3.Company snapshot
10.4.4.Operating business segments
10.4.5.Product portfolio
10.4.6.Business performance
10.5.GEOBRIDGE Corporation (utimaco GmbH)
10.5.1.Company overview
10.5.2.Key executives
10.5.3.Company snapshot
10.5.4.Product portfolio
10.5.5.Key strategic moves and developments
10.6.INDEX
10.6.1.Company overview
10.6.2.Key executives
10.6.3.Company snapshot
10.6.4.Product portfolio
10.7.Ingenico group
10.7.1.Company overview
10.7.2.Key Executives
10.7.3.Company snapshot
10.7.4.Product portfolio
10.7.5.R&D expenditure
10.7.6.Business performance
10.7.7.Key strategic moves and developments
10.8.Mastercard
10.8.1.Company overview
10.8.2.Key executive
10.8.3.Company snapshot
10.8.4.Product portfolio
10.8.5.Business performance
10.8.6.Key strategic moves and developments
10.9.Shift4 Payments, LLC
10.9.1.Company overview
10.9.2.Key executives
10.9.3.Company snapshot
10.9.4.Product portfolio
10.9.5.Business performance
10.9.6.Key strategic moves and developments
10.10.TNS Inc
10.10.1.Company overview
10.10.2.Key executives
10.10.3.Company snapshot
10.10.4.Product portfolio
10.10.5.Key strategic moves and developments
Table 01.Payment Security Market Revenue, By Component, 2020–2030 ($Million)
Table 02.Payment Security Market Revenue For Solution, By Region, 2020–2030 ($Million)
Table 03.Payment Security Revenue, By Solution, 2020–2030 ($Million)
Table 04.Payment Security Market Revenue For Encryption, By Region, 2020–2030 ($Million)
Table 05.Payment Security Market Revenue For Tokenization, By Region, 2020–2030 ($Million)
Table 06.Payment Security Market Revenue For Fraud Detection & Prevention, By Region, 2020–2030 ($Million)
Table 07.Payment Security Market Revenue For Service, By Region, 2020–2030 ($Million)
Table 08.Payment Security Market Revenue, By Platform, 2020–2030 ($Million)
Table 09.Payment Security Market Revenue For Web-Based, By Region, 2020–2030 ($Million)
Table 10.Payment Security Market Revenue For Pos-Based, By Region, 2020–2030 ($Million)
Table 11.Payment Security Market Revenue, By Enterprise Size, 2020–2030 ($Million)
Table 12.Payment Security Market Revenue For Large Enterprises, By Region, 2020–2030 ($Million)
Table 13.Payment Security Market Revenue For Smes, By Region, 2020–2030 ($Million)
Table 14.Payment Security Market Revenue, By Industry Vertical, 2020–2030 ($Million)
Table 15.Payment Security Market Revenue For Bfsi, By Region, 2020–2030 ($Million)
Table 16.Payment Security Market Revenue For Government & Utilities, By Region, 2020–2030 ($Million)
Table 17.Payment Security Market Revenue For It & Telecom, By Region, 2020–2030 ($Million)
Table 18.Payment Security Market Revenue For Healthcare, By Region, 2020–2030 ($Million)
Table 19.Payment Security Market Revenue For Retail & E-Commerce, By Region, 2020–2030 ($Million)
Table 20.Payment Security Market Revenue For Media & Entertainment, By Region, 2020–2030 ($Million)
Table 21.Payment Security Market Revenue For Travel &Hospitality, By Region, 2020–2030 ($Million)
Table 22.Payment Security Market Revenue For Others, By Region, 2020–2030 ($Million)
Table 23.Payment Security Market Revenue, By Region, 2020–2030 ($Million)
Table 24.North America Payment Security Market Revenue, By Component, 2020–2030 ($Million)
Table 25.North America Payment Security Market Revenue, By Solution, 2020–2030 ($Million)
Table 26.North America Payment Security Market Revenue, By Platform, 2020–2030 ($Million)
Table 27.North America Payment Security Market Revenue, By Enterprise Size, 2020–2030 ($Million)
Table 28.North America Payment Security Market Revenue, By Industry Vertical, 2020–2030 ($Million)
Table 29.North America Payment Security Market Revenue, By Country, 2020–2028 ($Million)
Table 30.U.S. Payment Security Market Revenue, By Component, 2020–2030 ($Million)
Table 31.U.S. Payment Security Market Revenue, By Solution, 2020–2030 ($Million)
Table 32.U.S. Payment Security Market Revenue, By Platform, 2020–2030 ($Million)
Table 33.U.S. Payment Security Market Revenue, By Enterprise Size, 2020–2030 ($Million)
Table 34.U.S. Payment Security Market Revenue, By Industry Vertical, 2020–2030 ($Million)
Table 35.Canada Payment Security Market Revenue, By Component, 2020–2030 ($Million)
Table 36.Canada Payment Security Market Revenue, By Solution, 2020–2030 ($Million)
Table 37.Canada Payment Security Market Revenue, By Platform, 2020–2030 ($Million)
Table 38.Canada Payment Security Market Revenue, By Enterprise Size, 2020–2030 ($Million)
Table 39.Canada Payment Security Market Revenue, By Industry Vertical, 2020–2030 ($Million)
Table 40.Europe Payment Security Market Revenue, By Component, 2020–2030 ($Million)
Table 41.Europe Payment Security Market Revenue, By Solution, 2020–2030 ($Million)
Table 42.Europe Payment Security Market Revenue, By Platform, 2020–2030 ($Million)
Table 43.Europe Payment Security Market Revenue, By Enterprise Size, 2020–2030 ($Million)
Table 44.Europe Payment Security Market Revenue, By Industry Vertical, 2020–2030 ($Million)
Table 45.Europe Payment Security Market Revenue, By Country, 2020–2028 ($Million)
Table 46.Uk Payment Security Market Revenue, By Component, 2020–2030 ($Million)
Table 47.Uk Payment Security Market Revenue, By Solution, 2020–2030 ($Million)
Table 48.Uk Payment Security Market Revenue, By Platform, 2020–2030 ($Million)
Table 49.Uk Payment Security Market Revenue, By Enterprise Size, 2020–2030 ($Million)
Table 50.Uk Payment Security Market Revenue, By Industry Vertical, 2020–2030 ($Million)
Table 51.Germany Payment Security Market Revenue, By Component, 2020–2030 ($Million)
Table 52.Germany Payment Security Market Revenue, By Solution, 2020–2030 ($Million)
Table 53.Germany Payment Security Market Revenue, By Platform, 2020–2030 ($Million)
Table 54.Germany Payment Security Market Revenue, By Enterprise Size, 2020–2030 ($Million)
Table 55.Germany Payment Security Market Revenue, By Industry Vertical, 2020–2030 ($Million)
Table 56.France Payment Security Market Revenue, By Component, 2020–2030 ($Million)
Table 57.France Payment Security Market Revenue, By Solution, 2020–2030 ($Million)
Table 58.France Payment Security Market Revenue, By Platform, 2020–2030 ($Million)
Table 59.France Payment Security Market Revenue, By Enterprise Size, 2020–2030 ($Million)
Table 60.France Payment Security Market Revenue, By Industry Vertical, 2020–2030 ($Million)
Table 61.Spain Payment Security Market Revenue, By Component, 2020–2030 ($Million)
Table 62.Spain Payment Security Market Revenue, By Solution, 2020–2030 ($Million)
Table 63.Spain Payment Security Market Revenue, By Platform, 2020–2030 ($Million)
Table 64.Spain Payment Security Market Revenue, By Enterprise Size, 2020–2030 ($Million)
Table 65.Spain Payment Security Market Revenue, By Industry Vertical, 2020–2030 ($Million)
Table 66.Italy Payment Security Market Revenue, By Component, 2020–2030 ($Million)
Table 67.Italy Payment Security Market Revenue, By Solution, 2020–2030 ($Million)
Table 68.Italy Payment Security Market Revenue, By Platform, 2020–2030 ($Million)
Table 69.Italy Payment Security Market Revenue, By Enterprise Size, 2020–2030 ($Million)
Table 70.Italy Payment Security Market Revenue, By Industry Vertical, 2020–2030 ($Million)
Table 71.Rest Of Europe Payment Security Market Revenue, By Component, 2020–2030 ($Million)
Table 72.Rest Of Europe Payment Security Market Revenue, By Solution, 2020–2030 ($Million)
Table 73.Rest Of Europe Payment Security Market Revenue, By Platform, 2020–2030 ($Million)
Table 74.Rest Of Europe Payment Security Market Revenue, By Enterprise Size, 2020–2030 ($Million)
Table 75.Rest Of Europe Payment Security Market Revenue, By Industry Vertical, 2020–2030 ($Million)
Table 76.Asia-Pacific Payment Security Market Revenue, By Component, 2020–2030 ($Million)
Table 77.Asia-Pacific Payment Security Market Revenue, By Solution, 2020–2030 ($Million)
Table 78.Asia-Pacific Payment Security Market Revenue, By Platform, 2020–2030 ($Million)
Table 79.Asia-Pacific Payment Security Market Revenue, By Enterprise Size, 2020–2030 ($Million)
Table 80.Asia-Pacific Payment Security Market Revenue, By Industry Vertical, 2020–2030 ($Million)
Table 81.Asia-Pacific Payment Security Market Revenue, By Country, 2020–2028 ($Million)
Table 82.China Payment Security Market Revenue, By Component, 2020–2030 ($Million)
Table 83.China Payment Security Market Revenue, By Solution, 2020–2030 ($Million)
Table 84.China Payment Security Market Revenue, By Platform, 2020–2030 ($Million)
Table 85.China Payment Security Market Revenue, By Enterprise Size, 2020–2030 ($Million)
Table 86.China Payment Security Market Revenue, By Industry Vertical, 2020–2030 ($Million)
Table 87.India Payment Security Market Revenue, By Component, 2020–2030 ($Million)
Table 88.India Payment Security Market Revenue, By Solution, 2020–2030 ($Million)
Table 89.India Payment Security Market Revenue, By Platform, 2020–2030 ($Million)
Table 90.India Payment Security Market Revenue, By Enterprise Size, 2020–2030 ($Million)
Table 91.India Payment Security Market Revenue, By Industry Vertical, 2020–2030 ($Million)
Table 92.Japan Payment Security Market Revenue, By Component, 2020–2030 ($Million)
Table 93.Japan Payment Security Market Revenue, By Solution, 2020–2030 ($Million)
Table 94.Japan Payment Security Market Revenue, By Platform, 2020–2030 ($Million)
Table 95.Japan Payment Security Market Revenue, By Enterprise Size, 2020–2030 ($Million)
Table 96.Japan Payment Security Market Revenue, By Industry Vertical, 2020–2030 ($Million)
Table 97.South Korea Payment Security Market Revenue, By Component, 2020–2030 ($Million)
Table 98.South Korea Payment Security Market Revenue, By Solution, 2020–2030 ($Million)
Table 99.South Korea Payment Security Market Revenue, By Platform, 2020–2030 ($Million)
Table 100.South Korea Payment Security Market Revenue, By Enterprise Size, 2020–2030 ($Million)
Table 101.South Korea Payment Security Market Revenue, By Industry Vertical, 2020–2030 ($Million)
Table 102.Australia Payment Security Market Revenue, By Component, 2020–2030 ($Million)
Table 103.Australia Payment Security Market Revenue, By Solution, 2020–2030 ($Million)
Table 104.Australia Payment Security Market Revenue, By Platform, 2020–2030 ($Million)
Table 105.Australia Payment Security Market Revenue, By Enterprise Size, 2020–2030 ($Million)
Table 106.Australia Payment Security Market Revenue, By Industry Vertical, 2020–2030 ($Million)
Table 107.Rest Of Asia-Pacific Payment Security Market Revenue, By Component, 2020–2030 ($Million)
Table 108.Rest Of Asia-Pacific Payment Security Market Revenue, By Solution, 2020–2030 ($Million)
Table 109.Rest Of Asia-Pacific Payment Security Market Revenue, By Platform, 2020–2030 ($Million)
Table 110.Rest Of Asia-Pacific Payment Security Market Revenue, By Enterprise Size, 2020–2030 ($Million)
Table 111.Rest Of Asia-Pacific Payment Security Market Revenue, By Industry Vertical, 2020–2030 ($Million)
Table 112.Lamea Payment Security Market Revenue, By Component, 2020–2030 ($Million)
Table 113.Lamea Payment Security Market Revenue, By Solution, 2020–2030 ($Million)
Table 114.Lamea Payment Security Market Revenue, By Platform, 2020–2030 ($Million)
Table 115.Lamea Payment Security Market Revenue, By Enterprise Size, 2020–2030 ($Million)
Table 116.Lamea Payment Security Market Revenue, By Industry Vertical, 2020–2030 ($Million)
Table 117.Lamea Payment Security Market Revenue, By Country, 2020–2028 ($Million)
Table 118.Latin America Payment Security Market Revenue, By Component, 2020–2030 ($Million)
Table 119.Latin America Payment Security Market Revenue, By Solution, 2020–2030 ($Million)
Table 120.Latin America Payment Security Market Revenue, By Platform, 2020–2030 ($Million)
Table 121.Latin America Payment Security Market Revenue, By Enterprise Size, 2020–2030 ($Million)
Table 122.Latin America Payment Security Market Revenue, By Industry Vertical, 2020–2030 ($Million)
Table 123.Middle East Payment Security Market Revenue, By Component, 2020–2030 ($Million)
Table 124.Middle East Payment Security Market Revenue, By Solution, 2020–2030 ($Million)
Table 125.Middle East Payment Security Market Revenue, By Platform, 2020–2030 ($Million)
Table 126.Middle East Payment Security Market Revenue, By Enterprise Size, 2020–2030 ($Million)
Table 127.Middle East Payment Security Market Revenue, By Industry Vertical, 2020–2030 ($Million)
Table 128.Africa Payment Security Market Revenue, By Component, 2020–2030 ($Million)
Table 129.Africa Payment Security Market Revenue, By Solution, 2020–2030 ($Million)
Table 130.Africa Payment Security Market Revenue, By Platform, 2020–2030 ($Million)
Table 131.Africa Payment Security Market Revenue, By Enterprise Size, 2020–2030 ($Million)
Table 132.Africa Payment Security Market Revenue, By Industry Vertical, 2020–2030 ($Million)
Table 133.Bluefin Payment Systems: Key Executives
Table 134.Bluefin Payment Systems: Company Snapshot
Table 135.Bluefin Payment Systems: Product Portfolio
Table 136.Braintree (Paypal Holdings, Inc.).: Key Executives
Table 137.Braintree (Paypal Holdings, Inc.): Company Snapshot
Table 138.Braintree (Paypal Holdings, Inc.): Product Portfolio
Table 139.Cybersource (Visa Inc.).: Key Executives
Table 140.Cybersource (Visa Inc.): Company Snapshot
Table 141.Cybersource (Visa Inc.): Product Portfolio
Table 142.Elavon, Inc.: Key Executive
Table 143.Elavon, Inc.: Company Snapshot
Table 144.U.S. Bancorp: Operating Segments
Table 145.Elavon, Inc.: Product Portfolio
Table 146.Utimaco (Utimaco Gmbh).: Key Executives
Table 147.Geobridge Corporation (Utimaco Gmbh): Company Snapshot
Table 148.Geobridge Corporation (Utimaco Gmbh).: Product Portfolio
Table 149.Index: Key Executives
Table 150.Index: Company Snapshot
Table 151.Index: Product Portfolio
Table 152.Ingenico: Key Executives
Table 153.Ingenico: Company Snapshot
Table 154.Ingenico: Product Portfolio
Table 155.Mastercard: Key Executive
Table 156.Mastercard: Company Snapshot
Table 157.Mastercard: Product Portfolio
Table 158.Shift4 Payments, Llc.: Key Executives
Table 159.Shift4 Payments, Llc.: Company Snapshot
Table 160.Shift4 Payments, Llc.: Product Portfolio
Table 161.Tns Inc.: Key Executives
Table 162.Tns Inc.: Company Snapshot
Table 163.Transaction Network Services: Product Portfolio
List Of Figures
Figure 01.Key Market Segment
Figure 02.Payment Security Market Snapshot, By Segmentation, 2020–2030
Figure 03.Payment Security Market Snapshot, By Country, 2020–2030
Figure 04.Top Impacting Factors
Figure 05.Top Investment Pockets
Figure 06.Moderate -To-High Bargaining Power Of Suppliers
Figure 07.Moderate-To-High Bargaining Power Of Buyer
Figure 08.Low-To-Moderate Threat Of Substitutes
Figure 09.Moderate-To-High Threat Of New Entrants
Figure 10.Moderate-To-High Competitive Rivalry
Figure 11.Patent Analysis, By Region
Figure 12.Patent Analysis, By Applicant
Figure 13.Payment Security Market Revenue, By Component, 2020–2030 ($Million)
Figure 14.Comparative Share Analysis Of Payment Security Market For Solution, By Country, 2020 & 2030(%)
Figure 15.Payment Security Revenue, By Solution, 2020–2030 ($Million)
Figure 16.Comparative Share Analysis Of Payment Security Market For Encryption, By Country, 2020 & 2030(%)
Figure 17.Comparative Share Analysis Of Payment Security Market For Tokenization, By Country, 2020 & 2030(%)
Figure 18.Comparative Share Analysis Of Payment Security Market For Fraud Detection & Prevention, By Country, 2020 & 2030(%)
Figure 19.Comparative Share Analysis Of Payment Security Market For Service, By Country, 2020 & 2030(%)
Figure 20.Payment Security Market Revenue, By Platform, 2020–2030 ($Million)
Figure 21.Comparative Share Analysis Of Payment Security Market For Web-Based, By Country, 2020 & 2030(%)
Figure 22.Comparative Share Analysis Of Payment Security Market For Pos-Based, By Country, 2020 & 2030(%)
Figure 23.Payment Security Market Revenue, By Enterprise Size, 2020–2030 ($Million)
Figure 24.Comparative Share Analysis Of Payment Security Market For Large Enterprises, By Country, 2020 & 2030(%)
Figure 25.Comparative Share Analysis Of Payment Security Market For Smes, By Country, 2020 & 2030(%)
Figure 26.Payment Security Market Revenue, By Industry Vertical, 2020–2030 ($Million)
Figure 27.Comparative Share Analysis Of Payment Security Market For Bfsi, By Country, 2020 & 2030(%)
Figure 28.Comparative Share Analysis Of Payment Security Market For Government & Utilities, By Country, 2020 & 2030(%)
Figure 29.Comparative Share Analysis Of Payment Security Market For It & Telecom, By Country, 2020 & 2030(%)
Figure 30.Comparative Share Analysis Of Payment Security Market For Healthcare, By Country, 2020 & 2030(%)
Figure 31.Comparative Share Analysis Of Payment Security Market For Retail & E-Commerce, By Country, 2020 & 2030(%)
Figure 32.Comparative Share Analysis Of Payment Security Market For Media & Entertainment, By Country, 2020 & 2030(%)
Figure 33.Comparative Share Analysis Of Payment Security Market For Travel &Hospitality, By Country, 2020 & 2030(%)
Figure 34.Comparative Share Analysis Of Payment Security Market For Others, By Country, 2020 & 2030(%)
Figure 35.U.S. Payment Security Market Revenue, 2020–2030 ($Million)
Figure 36.Canada Payment Security Market Revenue, 2020–2030 ($Million)
Figure 37.Uk Payment Security Market Revenue, 2020–2030 ($Million)
Figure 38.Germany Payment Security Market Revenue, 2020–2030 ($Million)
Figure 39.France Payment Security Market Revenue, 2020–2030 ($Million)
Figure 40.Spain Payment Security Market Revenue, 2020–2030 ($Million)
Figure 41.Italy Payment Security Market Revenue, 2020–2030 ($Million)
Figure 42.Rest Of Europe Payment Security Market Revenue, 2020–2030 ($Million)
Figure 43.China Payment Security Market Revenue, 2020–2030 ($Million)
Figure 44.India Payment Security Market Revenue, 2020–2030 ($Million)
Figure 45.Japan Payment Security Market Revenue, 2020–2030 ($Million)
Figure 46.South Korea Payment Security Market Revenue, 2020–2030 ($Million)
Figure 47.Australia Payment Security Market Revenue, 2020–2030 ($Million)
Figure 48.Rest Of Asia-Pacific Payment Security Market Revenue, 2020–2030 ($Million)
Figure 49.Latin America Payment Security Market Revenue, 2020–2030 ($Million)
Figure 50.Middle East Payment Security Market Revenue, 2020–2030 ($Million)
Figure 51.Africa Payment Security Market Revenue, 2020–2030 ($Million)
Figure 52.Key Player Positioning Anlysis: Global Payment Security Market
Figure 53.Competitive Dashboard
Figure 54.Competitive Dashboard
Figure 55.Competitive Heatmap Of Key Players
Figure 56.Top Winning Strategies, By Year, 2019-2021
Figure 57.Top Winning Strategies, By Development, 2019-2021
Figure 58.Top Winning Strategies, By Company, 2019-2021
Figure 59.Paypal Holdings, Inc..: Revenue, 2018–2020 ($Million)
Figure 60.Paypal Holdings, Inc..: Revenue Share By Region, 2020 (%)
Figure 61.Visa Inc..: Revenue, 2018–2020 ($Million)
Figure 62.Visa Inc..: Revenue Share By Region, 2020 (%)
Figure 63.U.S. Bancorp: Revenue, 2018-2020 ($Million)
Figure 64.U.S. Bancorp: Revenue Share, By Segment, 2020 (%)
Figure 65.R&D Expenditure, 2017-2019 ($Million)
Figure 66.Ingenico: Revenue, 2017–2019 ($Million)
Figure 67.Ingenico: Revenue Share By Region, 2019 (%)
Figure 68.Mastercard: Revenue, 2018-2020 ($Million)
Figure 69.Mastercard: Revenue Share, By Region, 2020 (%)
Figure 70.Shift4 Payments, Llc.: Revenue, 2018–2020 ($Million)
$6169
$6930
$10665
