
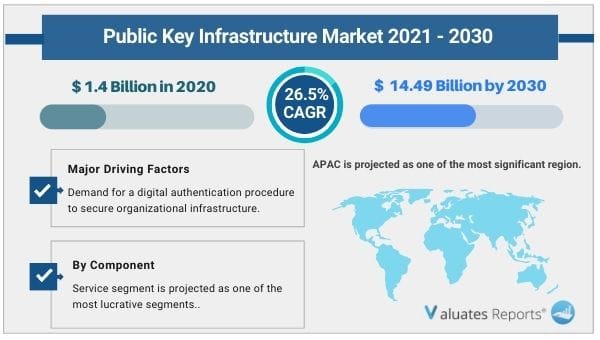
The global public key infrastructure market size was valued at US$ 1.4 billion in 2020 and is projected to reach US$ 14.49 billion by 2030 registering a CAGR of 26.5% from 2021 to 2030. Key drivers of the public key infrastructure market are the widespread application of PKI solutions in various industries and the growing need to reduce the cost of authentication.
Further, the increasing number of cyber frauds and growing awareness of data security and privacy is expected to fuel the market growth during the forecast period. Moreover, covid-19 has led to an increase in the rate of digitalization meaning more businesses are now reliant on online work environments leading to a rise in data loss concerns and increased risks of cyber attacks ultimately creating lucrative opportunities for the public key infrastructure market growth. On the other hand high installation, maintenance expenses, and huge network overhead, bandwidth needs will limit the market expansion but wide acceptance of IoT and cloud trends, stricter obligatory rules, and compliances are expected to propel the growth of the market.
The demand for data security and privacy systems has grown steadily over the last few decades. This has resulted in increased adoption of PKI solutions across various industries such as Banking, Healthcare, e-commerce, residential, and government. PKI-based solutions are used extensively in common access card programs for providing identification cards, a variety of encrypted messaging services for modern IoT communication systems in many industries leading to high-grade encrypted messaging. Thus widescale adoption will expand the growth of the public key infrastructure market during the forecast period.
Increase in cyber fraud and growing awareness of data privacy & security
There has been a huge growth in cyberattacks in recent years. Further, the number of cyber offense cases has boomed significantly during the pandemic leading to growing concerns for data loss. Moreover increasing awareness regarding data security and privacy will create lucrative opportunities for market expansion. Thus increasing cyber fraud cases and growing data security and privacy concerns will propel the growth of the public key infrastructure market during the forecast period.
High Installation, maintenance charges and stricter rules, compliances
High installation, maintenance charges, and significant network overhead, bandwidth needs are expected to restraint the market growth during the forecast period. But the need for complying with stricter rules and regulations, global acceptance of IoT, and cloud trends will significantly boost the growth of the public key infrastructure market in the coming years.
Covid 19 impact and rising digitalization
Covid 19 has forced many businesses to shift towards digitalization at a faster rate. Various brick-and-mortar stores are now moving to internet platforms and relying on digital workplaces powered by apps such as Zoom and Microsoft Teams for conducting their day-to-day business operations. Moreover with on-site personnel and workers becoming scarce organizations are now heavily reliant on online work environments. This online transition is leading to increased risks of cyberattacks ultimately providing lucrative opportunities for the growth of the public key infrastructure market during the forecast period.
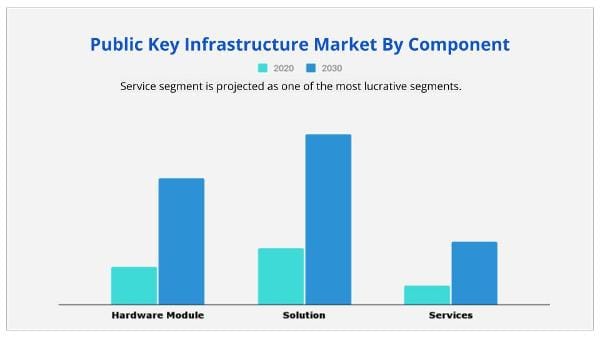
Based on components, the solutions segment is expected to hold the largest public key infrastructure market share during the forecast period due to rising digitalization across various industries and the need for the low-cost authentication process. On the other hand services segment will be the fastest-growing segment as various vendors are focussing on offering specialized services for assisting various organizations.
Based on deployment mode, the on-premises segment dominated the market in 2020 but the cloud segment is expected to provide lucrative opportunities for growth in the public key infrastructure market share due to the growing adoption of cloud-based services across various small, medium, and large-scale enterprises.
Based on the vertical, the IT and telecom sector dominated the market in 2020 but the healthcare segment is expected to provide lucrative opportunities for growth in the public key infrastructure market share during the forecast period.
Based on region, Asia-pacific is expected to provide lucrative opportunities for growth in the public key infrastructure market share during the forecast period.
Based on organization size, the large scale segment dominated the market in 2020 but the small scale segment is expected to provide lucrative opportunities for growth in the public key infrastructure market share during the forecast period.
|
Report Metric |
Details |
|
Report Name |
Public Key Infrastructure Market |
|
The Market size value in 2020 |
1.4 Billion USD |
|
The Revenue forecast in 2030 |
14.49 Billion USD |
|
Growth Rate |
CAGR of 26.5% from 2021 to 2030 |
|
Base year considered |
2020 |
|
Forecast period |
2021-2030 |
|
Forecast units |
Value (USD) |
|
Segments covered |
Component Type, End-User, Depoyment Type, and Region |
|
Report coverage |
Revenue & volume forecast, company share, competitive landscape, growth factors, and trends |
|
Geographic regions covered |
North America, Europe, Asia Pacific, Latin America, Middle East & Africa |
|
Companies covered |
THALES, ENTRUST DATACARD, DIGICERT, MANAGEENGINE, MICROSOFT, HID GLOBAL, GOOGLE, AMAZON WEB SERVICES, APPVIEWX, VENAFI. |
Ans. The global public key infrastructure market size was valued at US$ 1.4 billion in 2020 and is projected to reach US$ 14.49 billion by 2030.
Ans. The global public key infrastructure market is expected to grow at a compound annual growth rate of 26.5% from 2021 to 2030.
Ans. THALES, ENTRUST DATACARD, DIGICERT, MANAGEENGINE, MICROSOFT, HID GLOBAL, GOOGLE, AMAZON WEB SERVICES, APPVIEWX, VENAFI.
Ans. The demand for a digital authentication procedure to secure organizational infrastructure has grown as digitalization has spread across numerous industries. This, in turn, is expected to drive the growth of the public key infrastructure market.
CHAPTER 1:INTRODUCTION
1.1.REPORT DESCRIPTION
1.2.KEY BENEFITS FOR STAKEHOLDERS
1.3.KEY MARKET SEGMENTS
1.3.1.Key market players
1.4.RESEARCH METHODOLOGY
1.4.1.Secondary research
1.4.2.Primary research
1.4.3.Analyst tools & models
CHAPTER 2:EXECUTIVE SUMMARY
2.1.KEY FINDINGS
2.1.1.Top impacting factors
2.1.2.Top investment pockets
2.2.CXO PERSPECTIVE
CHAPTER 3:MARKET OVERVIEW AND SCOPE
3.1.MARKET DEFINITION AND SCOPE
3.2.KEY FORCES SHAPING THE PUBLIC KEY INFRASTRUCTURE MARKET
3.3.MARKET DYNAMICS
3.3.1.Drivers
3.3.1.1.Growing applications of the PKI infrastructure
3.3.1.2.The rising number of cyber fraud attempts
3.3.2.Restraints
3.3.2.1.Higher installation and maintenance costs
3.3.2.2.Heavy network overhead and bandwidth requirements
3.3.3.Opportunities
3.3.3.1.Growing awareness about data privacy amongst users
3.3.3.2.Increased cyber-attacks during the COVID-19 pandemic
3.4.COVID-19 IMPACT ANALYSIS ON THE PUBLIC KEY INFRASTRUCTURE MARKET
3.4.1.Impact on market size
3.4.2.Consumer trends, preferences, and budget impact
3.4.3.Economic impact
3.4.4.Key player strategies to tackle negative impact
3.4.5.Opportunity window
CHAPTER 4:PUBLIC KEY INFRASTRUCTURE MARKET, BY COMPONENT
4.1.OVERVIEW
4.2.HARDWARE SECURITY MODULE
4.2.1.Key market trends, growth factors, and opportunities
4.2.2.Market size and forecast, by region
4.2.3.Market analysis, by country
4.3.SOLUTIONS
4.3.1.Key market trends, growth factors, and opportunities
4.3.2.Market size and forecast, by region
4.3.3.Market analysis, by country
4.4.SERVICES
4.4.1.Key market trends, growth factors, and opportunities
4.4.2.Market size and forecast, by region
4.4.3.Market analysis, by country
CHAPTER 5:PUBLIC KEY INFRASTRUCTURE MARKET, BY DEPLOYMENT MODE
5.1.OVERVIEW
5.2.0N-PREMISE
5.2.1.Key market trends, growth factors, and opportunities
5.2.2.Market size and forecast, by region
5.2.3.Market analysis, by country
5.3.CLOUD
5.3.1.Key market trends, growth factors, and opportunities
5.3.2.Market size and forecast, by region
5.3.3.Market analysis, by country
CHAPTER 6:PUBLIC KEY INFRASTRUCTURE MARKET, BY ORGANIZATION SIZE
6.1.OVERVIEW
6.2.LARGE ENTERPRISE
6.2.1.Key market trends, growth factors, and opportunities
6.2.2.Market size and forecast, by region
6.2.3.Market analysis, by country
6.3.SME
6.3.1.Key market trends, growth factors, and opportunities
6.3.2.Market size and forecast, by region
6.3.3.Market analysis, by country
CHAPTER 7:PUBLIC KEY INFRASTRUCTURE MARKET, BY VERTICAL
7.1.OVERVIEW
7.2.BFSI
7.2.1.Key market trends, growth factors, and opportunities
7.2.2.Market size and forecast, by region
7.2.3.Market analysis, by country
7.3.GOVERNMENT AND DEFENSE
7.3.1.Key market trends, growth factors, and opportunities
7.3.2.Market size and forecast, by region
7.3.3.Market analysis, by country
7.4.IT AND TELECOM
7.4.1.Key market trends, growth factors, and opportunities
7.4.2.Market size and forecast, by region
7.4.3.Market analysis, by country
7.5.RETAIL
7.5.1.Key market trends, growth factors, and opportunities
7.5.2.Market size and forecast, by region
7.5.3.Market analysis, by country
7.6.HEALTHCARE
7.6.1.Key market trends, growth factors, and opportunities
7.6.2.Market size and forecast, by region
7.6.3.Market analysis, by country
7.7.MANUFACTURING
7.7.1.Key market trends, growth factors, and opportunities
7.7.2.Market size and forecast, by region
7.7.3.Market analysis, by country
7.8.OTHERS
7.8.1.Key market trends, growth factors, and opportunities
7.8.2.Market size and forecast, by region
7.8.3.Market analysis, by country
CHAPTER 8:PUBLIC KEY INFRASTRUCTURE MARKET, BY REGION
8.1.OVERVIEW
8.2.NORTH AMERICA
8.2.1.Key market trends, growth factors, and opportunities
8.2.2.Market size and forecast, By Component
8.2.3.Market size and forecast, by deployment mode
8.2.4.Market size and forecast, by organization size
8.2.5.Market size and forecast, by Verticals
8.2.6.Market analysis, by country
8.2.6.1.U.S.
8.2.6.1.1.Market size and forecast, By Component
8.2.6.1.2.Market size and forecast, by Deployment Model
8.2.6.1.3.Market size and forecast, by Organization size
8.2.6.1.4.Market size and forecast, by Verticals
8.2.6.2.Canada
8.2.6.2.1.Market size and forecast, By Component
8.2.6.2.2.Market size and forecast, by deployment model
8.2.6.2.3.Market size and forecast, by Organization size
8.2.6.2.4.Market size and forecast, by Verticals
8.2.6.2.5.Europe
8.2.7.Key market trends, growth factors, and opportunities
8.2.8.Market size and forecast, By Component
8.2.9.Market size and forecast, by Deployment Mode
8.2.10.Market size and forecast, by Organization size
8.2.11.Market size and forecast, by Organization size
8.2.12.Market size and forecast, by Verticals
8.2.13.Market analysis, by country
8.2.13.1.UK
8.2.13.1.1.Market size and forecast, By Component
8.2.13.1.2.Market size and forecast, by deployment model
8.2.13.1.3.Market size and forecast, by Organization Size
8.2.13.1.4.Market size and forecast, by vertical
8.2.13.2.Germany
8.2.13.2.1.Market size and forecast, By Component
8.2.13.2.2.Market size and forecast, by deployment mode
8.2.13.2.3.Market size and forecast, by organization size
8.2.13.2.4.Market size and forecast, by Vertical
8.2.13.3.France
8.2.13.3.1.Market size and forecast, By Component
8.2.13.3.2.Market size and forecast, by Deployment Mode
8.2.13.3.3.Market size and forecast, by Organization size
8.2.13.3.4.Market size and forecast, by Verticals
8.2.13.4.Rest of Europe
8.2.13.4.1.Market size and forecast, By Component
8.2.13.4.2.Market size and forecast, by deployment model
8.2.13.4.3.Market size and forecast, by organization size
8.2.13.4.4.Market size and forecast, by Verticals
8.3.ASIA-PACIFIC
8.3.1.Key market trends, growth factors, and opportunities
8.3.2.Market size and forecast, By Component
8.3.3.Market size and forecast, by deployment mode
8.3.4.Market size and forecast, by organization size
8.3.5.Market size and forecast, by verticals
8.3.6.Market analysis, by country
8.3.6.1.China
8.3.6.1.1.Market size and forecast, By Component
8.3.6.1.2.Market size and forecast, by deployment mode
8.3.6.1.3.Market size and forecast, by organization size
8.3.6.1.4.Market size and forecast, by verticals
8.3.6.2.India
8.3.6.2.1.Market size and forecast, By Component
8.3.6.2.2.Market size and forecast, by deployment mode
8.3.6.2.3.Market size and forecast, by organization size
8.3.6.2.4.Market size and forecast, by verticals
8.3.6.3.Japan
8.3.6.3.1.Market size and forecast, By Component
8.3.6.3.2.Market size and forecast, by deployment mode
8.3.6.3.3.Market size and forecast, by organization size
8.3.6.3.4.Market size and forecast, by verticals
8.3.6.4.Rest of Asia-Pacific
8.3.6.4.1.Market size and forecast, By Component
8.3.6.4.2.Market size and forecast, by deployment mode
8.3.6.4.3.Market size and forecast, by organization size
8.4.LAMEA
8.4.1.Key market trends, growth factors, and opportunities
8.4.2.Market size and forecast, By Component
8.4.3.Market size and forecast, by deployment mode
8.4.4.Market size and forecast, by organization size
8.4.5.Market size and forecast, by verticals
8.4.6.Market analysis, by country
8.4.6.1.Latin America
8.4.6.1.1.Market size and forecast, By Component
8.4.6.1.2.Market size and forecast, by deployment mode
8.4.6.1.3.Market size and forecast, by organization size
8.4.6.1.4.Market size and forecast, by verticals
8.4.6.2.Middle East
8.4.6.2.1.Market size and forecast, By Component
8.4.6.2.2.Market size and forecast, by deployment mode
8.4.6.2.3.Market size and forecast, by organization size
8.4.6.2.4.Market size and forecast, by verticals
8.4.6.3.Africa
8.4.6.3.1.Market size and forecast, By Component
8.4.6.3.2.Market size and forecast, by deployment mode
8.4.6.3.3.Market size and forecast, by organization size
8.4.6.3.4.Market size and forecast, by verticals
CHAPTER 9:COMPETITIVE LANDSCAPE
9.1.KEY PLAYER POSITIONING ANALYSIS, 2019
9.2.TOP WINNING STRATEGIES
9.3.COMPETITIVE DASHBOARD
CHAPTER 10:COMPANY PROFILE
10.1.AMAZON WEB SERVICES, INC.
10.1.1.Company overview
10.1.2.Key executives
10.1.3.Company snapshot
10.1.4.Operating business segments
10.1.5.Product portfolio
10.1.6.Business performance
10.1.7.Key strategic moves and developments
10.2.DIGICERT, INC.
10.2.1.Company overview
10.2.2.Key executives
10.2.3.Company snapshot
10.2.4.Product portfolio
10.2.5.Key strategic moves and developments
10.3.ENIGMA SYSTEMY OCHRONY INFORMACJI SP. Z O.O.
10.3.1.Company overview
10.3.2.Key executives
10.3.3.Company snapshot
10.3.4.Product portfolio
10.3.5.Key strategic moves and developments
10.4.2.Key executives
10.4.3.Company snapshot
10.4.4.Product portfolio
10.4.5.Key strategic moves and developments
10.5.GOOGLE LLC
10.5.1.Company overview
10.5.2.Key executives
10.5.3.Company snapshot
10.5.4.Operating business segments
10.5.5.Product portfolio
10.5.6.R&D expenditure
10.5.7.Business performance
10.5.8.Key strategic moves and developments
10.6.HID GLOBAL CORPORATION
10.6.1.Company overview
10.6.2.Key executives
10.6.3.Company snapshot
10.6.4.Product portfolio
10.6.5.Key strategic moves and developments
10.7.INTERNATIONAL BUSINESS MACHINES CORPORATION
10.7.1.Company overview
10.7.2.Key executives
10.7.3.Company snapshot
10.7.4.Operating business segments
10.7.5.Product portfolio
10.7.6.R&D Expenditure
10.7.7.Business performance
10.7.8.Key strategic moves and developments
10.8.MICROSOFT CORPORATION
10.8.1.Company overview
10.8.2.Key executives
10.8.3.Company snapshot
10.8.4.Operating business segments
10.8.5.Product portfolio
10.8.6.R&D expenditure
10.8.7.Business performance
10.8.8.Key strategic moves and developments
10.9.THALES GROUP
10.9.1.Company overview
10.9.2.Key executives
10.9.3.Company snapshot
10.9.4.Operating business segments
10.9.5.Product portfolio
10.9.6.R&D expenditure
10.9.7.Business performance
10.9.8.Key strategic moves and developments
10.10.WISEKEY INCRYPT
10.10.1.Company overview
10.10.2.Key executives
10.10.3.Company snapshot
10.10.4.Operating business segments
10.10.5.Product portfolio
10.10.6.R&D expenditure
10.10.7.Business performance
10.10.8.Key strategic moves and developments
LIST OF TABLES
TABLE 01.PUBLIC KEY INFRASTRUCTURE MARKET, BY COMPONENT, 2020-2030 ($MILLION)
TABLE 02.PUBLIC KEY INFRASTRUCTURE MARKET FOR HARDWARE SECURITY MODULE, BY REGION, 2020-2030 ($MILLION)
TABLE 03.PUBLIC KEY INFRASTRUCTURE MARKET FOR SOLUTION, BY REGION, 2020-2030 ($MILLION)
TABLE 04.PUBLIC KEY INFRASTRUCTURE MARKET FOR SERVICES, BY REGION, 2020-2030 ($MILLION)
TABLE 05.GLOBAL PUBLIC KEY INFRASTRUCTURE MARKET, BY DEPLOYMENT MODE, 2020-2030($MILLION)
TABLE 06.PUBLIC KEY INFRASTRUCTURE MARKET REVENUE FOR ON-PREMISE, BY REGION 2020-2030($MILLION)
TABLE 07.PUBLIC KEY INFRASTRUCTURE MARKET REVENUE FOR CLOUD, BY REGION, 2020-2030($MILLION)
TABLE 08.GLOBAL PUBLIC KEY INFRASTRUCTURE MARKET, BY ORGANIZATION SIZE, 2020-2030($MILLION)
TABLE 09.PUBLIC KEY INFRASTRUCTURE MARKET REVENUE FOR LARGE ENTERPRISE, BY REGION 2020-2030($MILLION)
TABLE 10.PUBLIC KEY INFRASTRUCTURE MARKET REVENUE FOR SME, BY REGION, 2020-2030($MILLION)
TABLE 11.GLOBAL PUBLIC KEY INFRASTRUCTURE MARKET, BY VERTICAL, 2020-2030($MILLION)
TABLE 12.PUBLIC KEY INFRASTRUCTURE MARKET REVENUE FOR BFSI, BY REGION 2020-2030($MILLION)
TABLE 13.PUBLIC KEY INFRASTRUCTURE MARKET REVENUE FOR GOVERNMENT AND DEFENSE, BY REGION, 2020-2030($MILLION)
TABLE 14.PUBLIC KEY INFRASTRUCTURE MARKET REVENUE FOR IT AND TELECOM, BY REGION, 2020-2030($MILLION)
TABLE 15.PUBLIC KEY INFRASTRUCTURE MARKET REVENUE FOR RETAIL, BY REGION, 2020-2030($MILLION)
TABLE 16.PUBLIC KEY INFRASTRUCTURE MARKET REVENUE FOR HEALTHCARE, BY REGION, 2020-2030($MILLION)
TABLE 17.PUBLIC KEY INFRASTRUCTURE MARKET REVENUE FOR MANUFACTURING, BY REGION, 2020-2030($MILLION)
TABLE 18.PUBLIC KEY INFRASTRUCTURE MARKET REVENUE FOR OTHERS, BY REGION, 2020-2030($MILLION)
TABLE 19.PUBLIC KEY INFRASTRUCTURE MARKET, BY REGION, 2020-2030 ($MILLION)
TABLE 20.NORTH AMERICA PUBLIC KEY INFRASTRUCTURE MARKET, BY COMPONENT, 2020-2030 ($MILLION)
TABLE 21.NORTH AMERICA PUBLIC KEY INFRASTRUCTURE MARKET, BY DEPLOYMENT MODE, 2020-2030 ($MILLION)
TABLE 22.NORTH AMERICA PUBLIC KEY INFRASTRUCTURE MARKET, BY ORGANIZATION SIZE, 2020-2030 ($MILLION)
TABLE 23.NORTH AMERICA PUBLIC KEY INFRASTRUCTURE MARKET, BY VERTICALS, 2020-2030 ($MILLION)
TABLE 24.NORTH AMERICA PUBLIC KEY INFRASTRUCTURE MARKET, BY COUNTRY, 2020-2030 ($MILLION)
TABLE 25.U.S. PUBLIC KEY INFRASTRUCTURE MARKET, BY COMPONENT, 2020-2030 ($MILLION)
TABLE 26.U.S. PUBLIC KEY INFRASTRUCTURE MARKET, BY DEPLOYMENT MODE, 2020-2030 ($MILLION)
TABLE 27.U.S. PUBLIC KEY INFRASTRUCTURE MARKET, BY ORGANIZATION SIZE, 2020-2030 ($MILLION)
TABLE 28.U.S. PUBLIC KEY INFRASTRUCTURE MARKET, BY VERTICALS, 2020-2030 ($MILLION)
TABLE 29.CANADA PUBLIC KEY INFRASTRUCTURE MARKET, BY COMPONENT, 2020-2030 ($MILLION)
TABLE 30.CANADA PUBLIC KEY INFRASTRUCTURE MARKET, BY DEPLOYMENT MODE, 2020-2030 ($MILLION)
TABLE 31.CANADA PUBLIC KEY INFRASTRUCTURE MARKET, BY ORGANIZATION SIZE, 2020-2030 ($MILLION)
TABLE 32.CANADA PUBLIC KEY INFRASTRUCTURE MARKET, BY VERTICALS, 2020-2030 ($MILLION)
TABLE 33.EUROPE PUBLIC KEY INFRASTRUCTURE MARKET, BY COMPONENT, 2020-2030 ($MILLION)
TABLE 34.EUROPE PUBLIC KEY INFRASTRUCTURE MARKET, BY DEPLOYENT MODE, 2020-2030 ($MILLION)
TABLE 35.EUROPE PUBLIC KEY INFRASTRUCTURE MARKET, BY ORGANIZATION SIZE, 2020-2030 ($MILLION)
TABLE 36.EUROPE PUBLIC KEY INFRASTRUCTURE MARKET, BY ORGANIZATION SIZE, 2020-2030 ($MILLION)
TABLE 37.EUROPE PUBLIC KEY INFRASTRUCTURE MARKET, BY VERTICALS, 2020-2030 ($MILLION)
TABLE 38.EUROPE PUBLIC KEY INFRASTRUCTURE MARKET, BY COUNTRY, 2020-2030 ($MILLION)
TABLE 39.UK PUBLIC KEY INFRASTRUCTURE MARKET, BY COMPONENT, 2020-2030 ($MILLION)
TABLE 40.UK PUBLIC KEY INFRASTRUCTURE MARKET, BY DEPLOYMENT MODEL, 2020-2030 ($MILLION)
TABLE 41.UK PUBLIC KEY INFRASTRUCTURE MARKET, BY ORGANIZATION SIZE, 2020-2030 ($MILLION)
TABLE 42.UK PUBLIC KEY INFRASTRUCTURE MARKET, BY VERTICAL, 2020-2030 ($MILLION)
TABLE 43.GERMANY PUBLIC KEY INFRASTRUCTURE MARKET, BY COMPONENT, 2020-2030 ($MILLION)
TABLE 44.GERMANY PUBLIC KEY INFRASTRUCTURE MARKET, BY DEPLOYMENT MODE, 2020-2030 ($MILLION)
TABLE 45.GERMANY PUBLIC KEY INFRASTRUCTURE MARKET, BY ORGANIZATION SIZE, 2020-2030 ($MILLION)
TABLE 46.GERMANY PUBLIC KEY INFRASTRUCTURE MARKET, BY VERTICAL, 2020-2030 ($MILLION)
TABLE 47.FRANCE PUBLIC KEY INFRASTRUCTURE MARKET, BY COMPONENT, 2020-2030 ($MILLION)
TABLE 48.FRANCE PUBLIC KEY INFRASTRUCTURE MARKET, BY DEPLOYMENT MODE, 2020-2030 ($MILLION)
TABLE 49.FRANCE PUBLIC KEY INFRASTRUCTURE MARKET, BY ORGANIZATION SIZE, 2020-2030 ($MILLION)
TABLE 50.FRANCE PUBLIC KEY INFRASTRUCTURE MARKET, BY VERTICALS, 2020-2030 ($MILLION)
TABLE 51.REST OF EUROPE PUBLIC KEY INFRASTRUCTURE MARKET, BY COMPONENT, 2020-2030 ($MILLION)
TABLE 52.REST OF EUROPE PUBLIC KEY INFRASTRUCTURE MARKET, BY DEPLOYMENT MODEL, 2020-2030 ($MILLION)
TABLE 53.REST OF EUROPE PUBLIC KEY INFRASTRUCTURE MARKET, BY DEPLOYMENT, 2020-2030 ($MILLION)
TABLE 54.REST OF EUROPE PUBLIC KEY INFRASTRUCTURE MARKET, BY VERTICALS, 2020-2030 ($MILLION)
TABLE 55.ASIA-PACIFIC PUBLIC KEY INFRASTRUCTURE MARKET, BY COMPONENT, 2020-2030 ($MILLION)
TABLE 56.ASIA-PACIFIC PUBLIC KEY INFRASTRUCTURE MARKET, BY APPLICATION TYPE, 2020-2030 ($MILLION)
TABLE 57.ASIA-PACIFIC PUBLIC KEY INFRASTRUCTURE MARKET, BY ORGANIZATION SIZE, 2020-2030 ($MILLION)
TABLE 58.ASIA-PACIFIC PUBLIC KEY INFRASTRUCTURE MARKET, BY ORGANIZATION SIZE, 2020-2030 ($MILLION)
TABLE 59.ASIA-PACIFIC PUBLIC KEY INFRASTRUCTURE MARKET, BY COUNTRY, 2020-2030 ($MILLION)
TABLE 60.CHINA PUBLIC KEY INFRASTRUCTURE MARKET, BY COMPONENT, 2020-2030 ($MILLION)
TABLE 61.CHINA PUBLIC KEY INFRASTRUCTURE MARKET, BY DEPLOYMENT MODE, 2020-2030 ($MILLION)
TABLE 62.CHINA PUBLIC KEY INFRASTRUCTURE MARKET, BY DEPLOYMENT, 2020-2030 ($MILLION)
TABLE 63.CHINA PUBLIC KEY INFRASTRUCTURE MARKET, BY DEPLOYMENT, 2020-2030 ($MILLION)
TABLE 64.INDIA PUBLIC KEY INFRASTRUCTURE MARKET, BY COMPONENT, 2020-2030 ($MILLION)
TABLE 65.INDIA PUBLIC KEY INFRASTRUCTURE MARKET, BY APPLICATION TYPE, 2020-2030 ($MILLION)
TABLE 66.INDIA PUBLIC KEY INFRASTRUCTURE MARKET, BY ORGANIZATION SIZE, 2020-2030 ($MILLION)
TABLE 67.INDIA PUBLIC KEY INFRASTRUCTURE MARKET, BY VERTICALS, 2020-2030 ($MILLION)
TABLE 68.JAPAN PUBLIC KEY INFRASTRUCTURE MARKET, BY COMPONENT, 2020-2030 ($MILLION)
TABLE 69.JAPAN PUBLIC KEY INFRASTRUCTURE MARKET, BY DEPLOYMENT MODE, 2020-2030 ($MILLION)
TABLE 70.JAPAN PUBLIC KEY INFRASTRUCTURE MARKET, BY ORGANIZATION SIZE, 2020-2030 ($MILLION)
TABLE 71.JAPAN PUBLIC KEY INFRASTRUCTURE MARKET, BY VERTICALS, 2020-2030 ($MILLION)
TABLE 72.REST OF ASIA-PACIFIC PUBLIC KEY INFRASTRUCTURE MARKET, BY COMPONENT, 2020-2030 ($MILLION)
TABLE 73.REST OF ASIA-PACIFIC PUBLIC KEY INFRASTRUCTURE MARKET, BY DEPLOYMENT MODE, 2020-2030 ($MILLION)
TABLE 74.REST OF ASIA-PACIFIC PUBLIC KEY INFRASTRUCTURE MARKET, BY ORGANIZATION SIZE, 2020-2030 ($MILLION)
TABLE 75.LAMEA PUBLIC KEY INFRASTRUCTURE MARKET, BY COMPONENT, 2020-2030 ($MILLION)
TABLE 76.LAMEA PUBLIC KEY INFRASTRUCTURE MARKET, BY APPLICATION TYPE, 2020-2030 ($MILLION)
TABLE 77.LAMEA PUBLIC KEY INFRASTRUCTURE MARKET, BY ORGANIZATION SIZE, 2020-2030 ($MILLION)
TABLE 78.LAMEA PUBLIC KEY INFRASTRUCTURE MARKET, BY ORGANIZATION SIZE, 2020-2030 ($MILLION)
TABLE 79.LAMEA PUBLIC KEY INFRASTRUCTURE MARKET, BY COUNTRY, 2020-2030 ($MILLION)
TABLE 80.LATIN AMERICA PUBLIC KEY INFRASTRUCTURE MARKET, BY COMPONENT, 2020-2030 ($MILLION)
TABLE 81.LATIN AMERICA PUBLIC KEY INFRASTRUCTURE MARKET, BY DEPLOYMENT MODE, 2020-2030 ($MILLION)
TABLE 82.LATIN AMERICA PUBLIC KEY INFRASTRUCTURE MARKET, BY ORGANIZATION SIZE, 2020-2030 ($MILLION)
TABLE 83.LATIN AMERICA PUBLIC KEY INFRASTRUCTURE MARKET, BY VERTICALS, 2020-2030 ($MILLION)
TABLE 84.MIDDLE EAST PUBLIC KEY INFRASTRUCTURE MARKET, BY COMPONENT, 2020-2030 ($MILLION)
TABLE 85.MIDDLE EAST PUBLIC KEY INFRASTRUCTURE MARKET, BY DEPLOYMENT MODE, 2020-2030 ($MILLION)
TABLE 86.MIDDLE EAST PUBLIC KEY INFRASTRUCTURE MARKET, BY ORGANIZATION SIZE, 2020-2030 ($MILLION)
TABLE 87.MIDDLE EAST PUBLIC KEY INFRASTRUCTURE MARKET, BY ORGANIZATION SIZE, 2020-2030 ($MILLION)
TABLE 88.AFRICA PUBLIC KEY INFRASTRUCTURE MARKET, BY COMPONENT, 2020-2030 ($MILLION)
TABLE 89.AFRICA PUBLIC KEY INFRASTRUCTURE MARKET, BY DEPLOYMENT MODE, 2020-2030 ($MILLION)
TABLE 90.AFRICA PUBLIC KEY INFRASTRUCTURE MARKET, BY ORGANIZTION SIZE, 2020-2030 ($MILLION)
TABLE 91.AFRICA PUBLIC KEY INFRASTRUCTURE MARKET, BY VERTICALS, 2020-2030 ($MILLION)
TABLE 92.AMAZON.COM INC.: KEY EXECUTIVES
TABLE 93.AMAZON WEB SERVICES, INC.: COMPANY SNAPSHOT
TABLE 94.AMAZON.COM INC.: OPERATING SEGMENTS
TABLE 95.AMAZON.COM INC.: PRODUCT PORTFOLIO
TABLE 96.DIGICERT, INC.: KEY EXECUTIVES
TABLE 97.DIGICERT, INC.: COMPANY SNAPSHOT
TABLE 98.DIGICERT, INC.: PRODUCT PORTFOLIO
TABLE 99.ENIGMA SYSTEMY OCHRONY INFORMACJI SP. Z O.O.: KEY EXECUTIVES
TABLE 100.ENIGMA SYSTEMY OCHRONY INFORMACJI SP. Z O.O.: COMPANY SNAPSHOT
TABLE 101.ENIGMA SYSTEMY OCHRONY INFORMACJI SP. Z O.O.: PUBLIC KEY INFRASTRUCTURE (PKI) PRODUCT PORTFOLIO
TABLE 102.ENTRUST CORPORATION: KEY EXECUTIVES
TABLE 103.ENTRUST CORPORATION: COMPANY SNAPSHOT
TABLE 104.ENTRUST CORPORATION: PRODUCT PORTFOLIO
TABLE 105.ENTRUST CORPORATION: KEY STRATEGIC MOVES AND DEVELOPMENTS
TABLE 106.GOOGLE LLC: KEY EXECUTIVES
TABLE 107.GOOGLE LLC: COMPANY SNAPSHOT
TABLE 108.ALPHABET INC.: OPERATING SEGMENTS
TABLE 109.ALPHABET INC.: PRODUCT PORTFOLIO
TABLE 110.HID GLOBAL CORPORATION: KEY EXECUTIVES
TABLE 111.HID GLOBAL CORPORATION: COMPANY SNAPSHOT
TABLE 112.HID GLOBAL CORPORATION: PRODUCT PORTFOLIO
TABLE 113.HID GLOBAL CORPORATION: KEY STRATEGIC MOVES AND DEVELOPMENTS
TABLE 114.INTERNATIONAL BUSINESS MACHINES CORPORATION: KEY EXECUTIVES
TABLE 115.INTERNATIONAL BUSINESS MACHINES CORPORATION: COMPANY SNAPSHOT
TABLE 116.INTERNATIONAL BUSINESS MACHINES CORPORATION: OPERATING SEGMENTS
TABLE 117.INTERNATIONAL BUSINESS MACHINES CORPORATION: PRODUCT PORTFOLIO
TABLE 118.MICROSOFT CORPORATION: KEY EXECUTIVES
TABLE 119.MICROSOFT CORPORATION: COMPANY SNAPSHOT
TABLE 120.MICROSOFT CORPORATION: OPERATING SEGMENTS
TABLE 121.MICROSOFT CORPORATION: PRODUCT PORTFOLIO
TABLE 122.THALES GROUP: KEY EXECUTIVES
TABLE 123.THALES GROUP: COMPANY SNAPSHOT
TABLE 124.THALES GROUP: OPERATING SEGMENTS
TABLE 125.THALES GROUP: PRODUCT PORTFOLIO
TABLE 126.WISEKEY INCRYPT: KEY EXECUTIVES
TABLE 127.WISEKEY INCRYPT: COMPANY SNAPSHOT
TABLE 128.WISEKEY INCRYPT: OPERATING SEGMENTS
TABLE 129.WISEKEY INCRYPT: PRODUCT PORTFOLIO
LIST OF FIGURES
FIGURE 01.KEY MARKET SEGMENTS
FIGURE 02.KEY FINDINGS
FIGURE 03.TOP IMPACTING FACTORS
FIGURE 04.TOP INVESTMENT POCKETS
FIGURE 05.MODERATE-TO-HIGH BARGAINING POWER OF SUPPLIERS
FIGURE 06.MODERATE-TO-HIGH BARGAINING POWER OF BUYERS
FIGURE 07.MODERATE THREAT OF SUBSTITUTES
FIGURE 08.MODERATE-TO-HIGH THREAT OF NEW ENTRANTS
FIGURE 09.HIGH COMPETITIVE RIVALRY
FIGURE 10.MARKET DYNAMICS: GLOBAL PUBLIC KEY INFRASTRUCTURE MARKET
FIGURE 11.PUBLIC KEY INFRASTRUCTURE MARKET, BY COMPONENT, 2020-2030 ($MILLION)
FIGURE 12.COMPARATIVE SHARE ANALYSIS OF PUBLIC KEY INFRASTRUCTURE MARKET FOR HARDWARE SECURITY MODULE, BY COUNTRY, 2020 & 2030 (%)
FIGURE 13.COMPARATIVE SHARE ANALYSIS OF PUBLIC KEY INFRASTRUCTURE MARKET FOR SOLUTION, BY COUNTRY, 2020 & 2030 (%)
FIGURE 14.COMPARATIVE SHARE ANALYSIS OF PUBLIC KEY INFRASTRUCTURE MARKET FOR SERVICES, BY COUNTRY, 2020 & 2030 (%)
FIGURE 15.GLOBAL PUBLIC KEY INFRASTRUCTURE MARKET REVENUE, BY DEPLOYMENT MODE, 2020-2030 ($MILLION)
FIGURE 16.COMPARATIVE SHARE ANALYSIS OF PUBLIC KEY INFRASTRUCTURE MARKET FOR ON-PREMISE, BY COUNTRY, 2020 & 2030 (%)
FIGURE 17.COMPARATIVE SHARE ANALYSIS OF PUBLIC KEY INFRASTRUCTURE MARKET FOR CLOUD, BY COUNTRY, 2020 & 2030 (%)
FIGURE 18.GLOBAL PUBLIC KEY INFRASTRUCTURE MARKET REVENUE, BY DEPLOYMENT, 2020-2030 ($MILLION)
FIGURE 19.COMPARATIVE SHARE ANALYSIS OF PUBLIC KEY INFRASTRUCTURE MARKET FOR LARGE ENTERPRISE, BY COUNTRY, 2020 & 2030 (%)
FIGURE 20.COMPARATIVE SHARE ANALYSIS OF PUBLIC KEY INFRASTRUCTURE MARKET FOR SME, BY COUNTRY, 2020 & 2030 (%)
FIGURE 21.GLOBAL PUBLIC KEY INFRASTRUCTURE MARKET REVENUE, BY DEPLOYMENT, 2020-2030 ($MILLION)
FIGURE 22.COMPARATIVE SHARE ANALYSIS OF PUBLIC KEY INFRASTRUCTURE MARKET FOR BFSI, BY COUNTRY, 2020 & 2030 (%)
FIGURE 23.COMPARATIVE SHARE ANALYSIS OF PUBLIC KEY INFRASTRUCTURE MARKET FOR GOVERNMENT AND DEFENSE, BY COUNTRY, 2020 & 2030 (%)
FIGURE 24.COMPARATIVE SHARE ANALYSIS OF PUBLIC KEY INFRASTRUCTURE MARKET FOR IT AND TELECOM, BY COUNTRY, 2020 & 2030 (%)
FIGURE 25.COMPARATIVE SHARE ANALYSIS OF PUBLIC KEY INFRASTRUCTURE MARKET FOR RETAIL, BY COUNTRY, 2020 & 2030 (%)
FIGURE 26.COMPARATIVE SHARE ANALYSIS OF PUBLIC KEY INFRASTRUCTURE MARKET FOR HEALTHCARE, BY COUNTRY, 2020 & 2030 (%)
FIGURE 27.COMPARATIVE SHARE ANALYSIS OF PUBLIC KEY INFRASTRUCTURE MARKET FOR MANUFACTURING, BY COUNTRY, 2020 & 2030 (%)
FIGURE 28.COMPARATIVE SHARE ANALYSIS OF PUBLIC KEY INFRASTRUCTURE MARKET FOR OTHERS, BY COUNTRY, 2020 & 2030 (%)
FIGURE 29.U.S. PUBLIC KEY INFRASTRUCTURE MARKET, 2020-2030 ($MILLION)
FIGURE 30.CANADA PUBLIC KEY INFRASTRUCTURE MARKET, 2020-2030 ($MILLION)
FIGURE 31.UK PUBLIC KEY INFRASTRUCTURE MARKET, 2020-2030 ($MILLION)
FIGURE 32.GERMANY PUBLIC KEY INFRASTRUCTURE MARKET, 2020-2030 ($MILLION)
FIGURE 33.FRANCE PUBLIC KEY INFRASTRUCTURE MARKET, 2020-2030 ($MILLION)
FIGURE 34.REST OF EUROPE PUBLIC KEY INFRASTRUCTURE MARKET, 2020-2030 ($MILLION)
FIGURE 35.CHINA PUBLIC KEY INFRASTRUCTURE MARKET, 2020-2030 ($MILLION)
FIGURE 36.INDIA PUBLIC KEY INFRASTRUCTURE MARKET, 2020-2030 ($MILLION)
FIGURE 37.JAPAN PUBLIC KEY INFRASTRUCTURE MARKET, 2020-2030 ($MILLION)
FIGURE 38.REST OF ASIA-PACIFIC PUBLIC KEY INFRASTRUCTURE MARKET, 2020-2030 ($MILLION)
FIGURE 39.LATIN AMERICA PUBLIC KEY INFRASTRUCTURE MARKET, 2020-2030 ($MILLION)
FIGURE 40.MIDDLE EAST PUBLIC KEY INFRASTRUCTURE MARKET, 2020-2030 ($MILLION)
FIGURE 41.AFRICA PUBLIC KEY INFRASTRUCTURE MARKET, 2020-2030 ($MILLION)
FIGURE 42.KEY PLAYER POSITIONING ANALYSIS: GLOBAL PUBLIC KEY INFRASTRUCTURE MARKET
FIGURE 43.TOP WINNING STRATEGIES, BY YEAR, 2019-2021
FIGURE 44.TOP WINNING STRATEGIES, BY DEVELOPMENT, 2019-2021
FIGURE 45.TOP WINNING STRATEGIES, BY COMPANY, 2019-2021
FIGURE 46.COMPETITIVE DASHBOARD
FIGURE 47.COMPETITIVE DASHBOARD
FIGURE 48.COMPETITIVE HEATMAP OF KEY PLAYERS
FIGURE 49.AMAZON.COM, INC.: REVENUE, 2018-2020 ($MILLION)
FIGURE 50.AMAZON.COM, INC.: REVENUE SHARE BY SEGMENT, 2020 (%)
FIGURE 51.AMAZON.COM, INC.: REVENUE SHARE BY REGION, 2020 (%)
FIGURE 52.R&D EXPENDITURE, 2018-2020 ($MILLION)
FIGURE 53.ALPHABET INC.: REVENUE, 2018-2020 ($MILLION)
FIGURE 54.ALPHABET INC.: REVENUE SHARE BY SEGMENT, 2020 (%)
FIGURE 55.ALPHABET INC.: REVENUE SHARE BY REGION, 2020 (%)
FIGURE 56.R&D EXPENDITURE, 2018-2020 ($MILLION)
FIGURE 57.INTERNATIONAL BUSINESS MACHINES CORPORATION: REVENUE, 2018-2020 ($MILLION)
FIGURE 58.INTERNATIONAL BUSINESS MACHINES CORPORATION: REVENUE SHARE, BY SEGMENT, 2020 (%)
FIGURE 59.INTERNATIONAL BUSINESS MACHINES CORPORATION: REVENUE SHARE, BY REGION, 2020 (%)
FIGURE 60.R&D EXPENDITURE, 2018-2020 ($MILLION)
FIGURE 61.MICROSOFT CORPORATION: REVENUE, 2018–2020 ($MILLION)
FIGURE 62.MICROSOFT CORPORATION: REVENUE SHARE BY SEGMENT, 2020 (%)
FIGURE 63.MICROSOFT CORPORATION: REVENUE SHARE BY REGION, 2020 (%)
FIGURE 64.R&D EXPENDITURE, 2018-2020 ($MILLION)
FIGURE 65.THALES GROUP: REVENUE, 2018-2020 ($MILLION)
FIGURE 66.THALES GROUP: REVENUE SHARE BY SEGMENT, 2020 (%)
FIGURE 67.THALES GROUP: REVENUE SHARE BY REGION, 2020 (%)
FIGURE 68.R&D EXPENDITURE, 2018-2020 ($THOUSAND)
FIGURE 69.WISEKEY INCRYPT: REVENUE, 2018-2020 ($MILLION)
FIGURE 70.WISEKEY INCRYPT: REVENUE SHARE BY SEGMENT, 2020 (%)
FIGURE 71.WISEKEY INCRYPT: REVENUE SHARE BY REGION, 2020 (%)
$6169
$6930
$10655
HAVE A QUERY?
OUR CUSTOMER
