
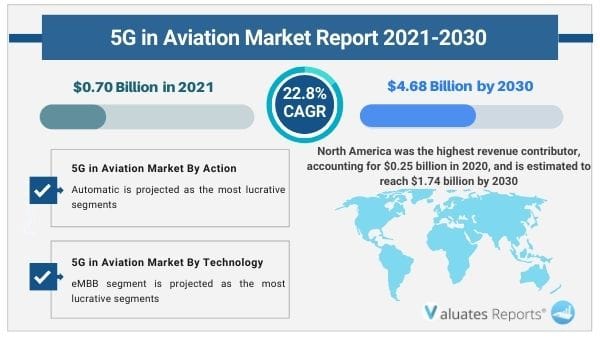
The global 5G in aviation market was valued at US$ 0.70 billion in 2020 and is projected to reach US$ 4.68 billion by 2030 registering a CAGR of 22.8%. North America was the highest revenue contributor, accounting for $0.25 billion in 2020, and is estimated to reach $1.74 billion by 2030, with a CAGR of 23.6%. Key drivers of the 5G in aviation market include the growth in airline passenger traffic density and 5G development through government support.
Further, high infrastructure costs related to 5G technology will hamper the market growth but rapid advancements in the 5G network will drive the growth of the 5G in aviation market during the forecast period. Moreover, covid 19 impact will restraint growth. However, the increasing number of contracts and agreements in the aviation industry will accelerate the growth of the market in the coming years.
The airline passenger traffic is growing significantly as passengers nowadays prefer air travel due to reduced travel time and faster mode of transportation. Air travel is expensive but rising income levels have led to consumers preferring comfort over anything else. The huge boost in passengers requires additional aircraft, enhanced operational efficiency, and robust connectivity solutions. 5G can be deployed for enhancing customer experience through in-flight entertainment services, the use of QR codes and facial recognition for reducing waiting periods, and enhanced connectivity to reduce risks associated with weather, etc. Thus growing passenger traffic and government support for 5G development will boost the growth of the 5G in aviation market in the future.
5G network is the next-generation broadband technology with a huge reduction in latency rates and superfast speeds. 5G is based on base station price, throughput density, and recurring interest rate. It requires huge investments in the form of the spectrum, radio access network (RAN) infrastructure, transmission, and core network. There are additional costs in the form of power distribution, site, operational, fiber, and installation costs. However, the rapid strides in 5G development over enhanced connectivity options will provide lucrative opportunities for growth in the future. Thus high infrastructure costs will hamper 5G deployment but rapid advancements in 5G technology will create significant opportunities for the growth of the 5G in aviation market in the coming years.
Covid 19 has significantly impacted the deployment of 5G technology in the aviation industry. The increase in complexities and bottlenecks in the operational capabilities has resulted in huge losses hampering the adoption of 5G in the industry. However, several contracts and agreements are being created between airport operators, aviation players, and developers of 5G in aviation technology for successful implementation to realize its immense benefits. Thus covid 19 will restrain the market but an increasing number of contracts and agreements will expand the 5G in aviation market during the forecast period.
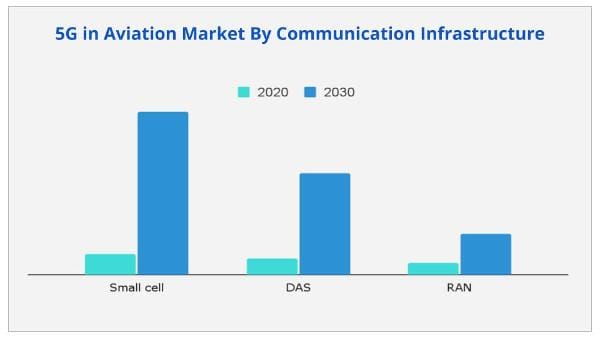
Based on communication infrastructure, the small cell segment is expected to provide lucrative opportunities for growth in the 5G in aviation market share during the forecast period due to the growing number of airline passengers, need for enhanced connectivity and the small cell being an eco-friendly provider of 5G with less power consumption.
<
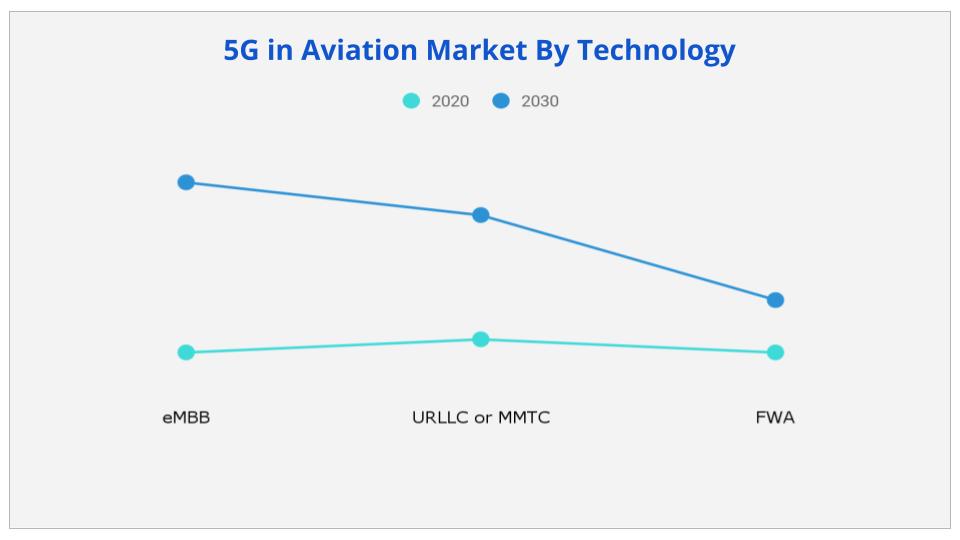
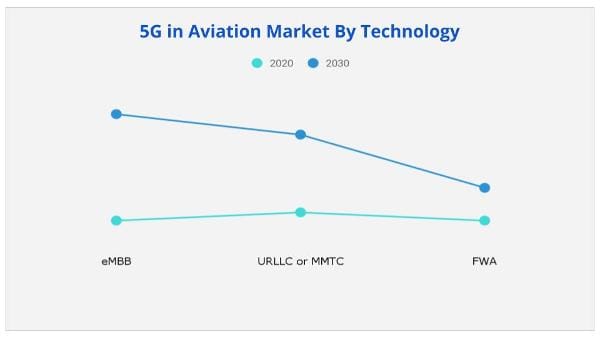
Based on technology, the eMBB segment is expected to provide lucrative opportunities for growth in the 5G in aviation market share as the demand for improved in-flight experience grows among air passengers.
Based on Action, the airport segment will provide huge opportunities for growth in the 5G in aviation market share as there is an increasing development of smart connected airports through 5G deployment.
Based on region, North America will provide lucrative opportunities for growth in the 5G in aviation market share and will grow at a CAGR of 7.8% during the forecast period. This is due to the high-density passenger traffic, R&D initiatives by key market players, and the presence of major companies in the region.
By Communication Infrastructure
By Technology
By End Use
By Region
Key Players
|
Report Metric |
Details |
|
Base Year: |
2020 |
|
Market Size in 2020: |
USD 0.70 Billion |
|
Forecast Period: |
2021 to 2030 |
|
Forecast Period 2021 to 2030 CAGR: |
22.8% |
|
2030 Value Projection: |
USD 4.68 Billion |
|
North America Growth Rate |
CAGR of 7.8% during 2021-2030 |
|
No. of Pages: |
273 |
|
Tables & Figures |
104 |
|
Charts |
70 |
|
Segments covered: |
By Communication Infrastructure, Technology, End-Use, Region |
Ans. The global 5G in aviation market was valued at US$ 0.70 billion in 2020 and is projected to reach US$ 4.68 billion by 2030 registering a CAGR of 22.8%.
Ans. North America was the highest revenue contributor, accounting for $0.25 billion in 2020, and is estimated to reach $1.74 billion by 2030, with a CAGR of 23.6%.
Ans. Upcoming trends of the 5G in aviation market include the growth in airline passenger traffic density and 5G development through government support.
Ans. Telefonaktiebolaget LM Ericsson, Nokia Corporation, Cisco Systems, Inc. are the key players in 5G in aviation industry
Ans. 5G technology in avition industry is in the introductory phase and holding considerable low market share in aviation industry
CHAPTER 1:INTRODUCTION
1.1.Report description
1.2.Key benefits for stakeholders
1.3.Key market segments
1.4.Research methodology
1.4.1.Primary research
1.4.2.Secondary research
1.4.3.Analyst tools and models
CHAPTER 2:EXECUTIVE SUMMARY
2.1.CXO perspective
CHAPTER 3:MARKET OVERVIEW
3.1.Market definition and scope
3.2.Key findings
3.2.1.Top impacting factors
3.2.2.Top investment pockets
3.2.3.Top winning strategies
3.3.Porter’s five forces analysis
3.4.Key player positioning, 2020
3.5.Market dynamics
3.5.1.Drivers
3.5.1.1.Upsurge in airline passenger traffic
3.5.1.2.Government initiatives to support the development of 5G
3.5.2.Restraint
3.5.2.1.High infrastructure cost involved in 5G technology deployment
3.5.3.Opportunities
3.5.3.1.Contracts and agreements with aviation industry players
3.5.3.2.Continuous advancements in 5G network
3.6.COVID-19 impact analysis
3.6.1.Evolution of outbreaks
3.6.2.Macroeconomic impact analysis
3.6.3.Microeconomic impact analysis
3.6.4.Impact on industry analysis
CHAPTER 4:5G IN AVIATION MARKET, BY COMMUNICATION INFRASTRUCTURE
4.1.Overview
4.2.Small cell
4.2.1.Key market trends, growth factors, and opportunities
4.2.2.Market size and forecast, by region
4.2.3.Market analysis, by country
4.3.DAS
4.3.1.Key market trends, growth factors, and opportunities
4.3.2.Market size and forecast, by region
4.3.3.Market analysis, by country
4.4.RAN
4.4.1.Key market trends, growth factors, and opportunities
4.4.2.Market size and forecast, by region
4.4.3.Market analysis, by country
CHAPTER 5:5G IN AVIATION MARKET, BY TECHNOLOGY
5.1.Overview
5.2.eMBB
5.2.1.Key market trends, growth factors, and opportunities
5.2.2.Market size and forecast, by region
5.2.3.Market analysis, by country
5.3.URLLC or MMTC
5.3.1.Key market trends, growth factors, and opportunities
5.3.2.Market size and forecast, by region
5.3.3.Market analysis, by country
5.4.FWA
5.4.1.Key market trends, growth factors, and opportunities
5.4.2.Market size and forecast, by region
5.4.3.Market analysis, by country
CHAPTER 6:5G IN AVIATION MARKET, BY END USE
6.1.Overview
6.2.Airport
6.2.1.Key market trends, growth factors, and opportunities
6.2.2.Market size and forecast, by region
6.2.3.Market analysis, by country
6.3.Aircraft
6.3.1.Key market trends, growth factors, and opportunities
6.3.2.Market size and forecast, by region
6.3.3.Market analysis, by country
CHAPTER 7:5G IN AVIATION MARKET, BY REGION
7.1.Overview
7.2.North America
7.2.1.Key market trends, growth factors, and opportunities
7.2.2.Market size and forecast, By Communication Infrastructure
7.2.3.Market size and forecast, By Technology
7.2.4.Market size and forecast, By End Use
7.2.5.Market size and forecast, by country
7.2.5.1.U.S.
7.2.5.1.1.Market size and forecast, By Communication Infrastructure
7.2.5.1.2.Market size and forecast, By Technology
7.2.5.1.3.Market size and forecast, By End Use
7.2.5.2.Canada
7.2.5.2.1.Market size and forecast, By Communication Infrastructure
7.2.5.2.2.Market size and forecast, By Technology
7.2.5.2.3.Market size and forecast, By End Use
7.2.5.3.Mexico
7.2.5.3.1.Market size and forecast, By Communication Infrastructure
7.2.5.3.2.Market size and forecast, By Technology
7.2.5.3.3.Market size and forecast, By End Use
7.3.Europe
7.3.1.Key market trends, growth factors, and opportunities
7.3.2.Market size and forecast, By Communication Infrastructure
7.3.3.Market size and forecast, By Technology
7.3.4.Market size and forecast, By End Use
7.3.5.Market size and forecast, by country
7.3.5.1.UK
7.3.5.1.1.Market size and forecast, By Communication Infrastructure
7.3.5.1.2.Market size and forecast, By Technology
7.3.5.1.3.Market size and forecast, By End Use
7.3.5.2.Germany
7.3.5.2.1.Market size and forecast, By Communication Infrastructure
7.3.5.2.2.Market size and forecast, By Technology
7.3.5.2.3.Market size and forecast, By End Use
7.3.5.3.France
7.3.5.3.1.Market size and forecast, By Communication Infrastructure
7.3.5.3.2.Market size and forecast, By Technology
7.3.5.3.3.Market size and forecast, By End Use
7.3.5.4.Spain
7.3.5.4.1.Market size and forecast, By Communication Infrastructure
7.3.5.4.2.Market size and forecast, By Technology
7.3.5.4.3.Market size and forecast, By End Use
7.3.5.5.Rest of Europe
7.3.5.5.1.Market size and forecast, By Communication Infrastructure
7.3.5.5.2.Market size and forecast, By Technology
7.3.5.5.3.Market size and forecast, By End Use
7.4.Asia-Pacific
7.4.1.Key market trends, growth factors, and opportunities
7.4.2.Market size and forecast, By Communication Infrastructure
7.4.3.Market size and forecast, By Technology
7.4.4.Market size and forecast, By End Use
7.4.5.Market size and forecast, by country
7.4.5.1.China
7.4.5.1.1.Market size and forecast, By Communication Infrastructure
7.4.5.1.2.Market size and forecast, By Technology
7.4.5.1.3.Market size and forecast, By End Use
7.4.5.2.Japan
7.4.5.2.1.Market size and forecast, By Communication Infrastructure
7.4.5.2.2.Market size and forecast, By Technology
7.4.5.2.3.Market size and forecast, By End Use
7.4.5.3.South Korea
7.4.5.3.1.Market size and forecast, By Communication Infrastructure
7.4.5.3.2.Market size and forecast, By Technology
7.4.5.3.3.Market size and forecast, By End Use
7.4.5.4.India
7.4.5.4.1.Market size and forecast, By Communication Infrastructure
7.4.5.4.2.Market size and forecast, By Technology
7.4.5.4.3.Market size and forecast, By End Use
7.4.5.5.Rest of Asia-Pacific
7.4.5.5.1.Market size and forecast, By Communication Infrastructure
7.4.5.5.2.Market size and forecast, By Technology
7.4.5.5.3.Market size and forecast, By End Use
7.5.LAMEA
7.5.1.Key market trends, growth factors, and opportunities
7.5.2.Market size and forecast, By Communication Infrastructure
7.5.3.Market size and forecast, By Technology
7.5.4.Market size and forecast, By End Use
7.5.5.Market size and forecast, by country
7.5.5.1.Latin America
7.5.5.1.1.Market size and forecast, By Communication Infrastructure
7.5.5.1.2.Market size and forecast, By Technology
7.5.5.1.3.Market size and forecast, By End Use
7.5.5.2.Middle East
7.5.5.2.1.Market size and forecast, By Communication Infrastructure
7.5.5.2.2.Market size and forecast, By Technology
7.5.5.2.3.Market size and forecast, By End Use
7.5.5.3.Africa
7.5.5.3.1.Market size and forecast, By Communication Infrastructure
7.5.5.3.2.Market size and forecast, By Technology
7.5.5.3.3.Market size and forecast, By End Use
CHAPTER 8:COMPANY PROFILES
8.1.CISCO SYSTEMS, INC.
8.1.1.Company overview
8.1.2.Company snapshot
8.1.3.Operating business segments
8.1.4.Product portfolio
8.1.5.Business performance
8.1.6.Key strategic moves and developments
8.2.Gogo Inc.
8.2.1.Company overview
8.2.2.Company snapshot
8.2.3.Operating business segments
8.2.4.Product portfolio
8.2.5.Business performance
8.2.6.Key strategic moves and developments
8.3.HUAWEI TECHNOLOGIES CO., LTD.
8.3.1.Company overview
8.3.2.Company snapshot
8.3.3.Operating business segments
8.3.4.Product portfolio
8.3.5.Business performance
8.3.6.Key strategic moves and developments
8.4.INSEEGO CORP.
8.4.1.Company overview
8.4.2.Company snapshot
8.4.3.Operating business segments
8.4.4.Product portfolio
8.4.5.Business performance
8.5.NOKIA CORPORATION
8.5.1.Company overview
8.5.2.Company snapshot
8.5.3.Operating business segments
8.5.4.Product portfolio
8.5.5.Business performance
8.5.6.Key strategic moves and developments
8.6.OneWeb
8.6.1.Company overview
8.6.2.Company snapshot
8.6.3.Product portfolio
8.7.Panasonic Avionics Corporation
8.7.1.Company overview
8.7.2.Company snapshot
8.7.3.Product portfolio
8.7.4.Business performance
8.7.5.Key strategic moves and developments
8.8.QUALCOMM TECHNOLOGIES, INC.
8.8.1.Company overview
8.8.2.Company snapshot
8.8.3.Operating business segments
8.8.4.Product portfolio
8.8.5.Business performance
8.8.6.Key strategic moves and developments
8.9.Smartsky Networks, LLC
8.9.1.Company overview
8.9.2.Company snapshot
8.9.3.Product portfolio
8.10.TELEFONAKTIEBOLAGET LM ERICSSON
8.10.1.Company overview
8.10.2.Company snapshot
8.10.3.Operating business segments
8.10.4.Product portfolio
8.10.5.Business performance
8.10.6.Key strategic moves and developments
Table 01.5g In Aviation Market, By Communication Infrastructure, 2020–2030 ($Million)
Table 02.5g In Aviation Market For Small Cell, By Region, 2020–2030 ($Million)
Table 03.5g In Aviation Market For Das, By Region, 2020–2030 ($Million)
Table 04.5g In Aviation Market For Ran, By Region, 2020–2030 ($Million)
Table 05.5g In Aviation Market, By Technology, 2020–2030 ($Million)
Table 06.5g In Aviation Market For Embb, By Region, 2020–2030 ($Million)
Table 07.5g In Aviation Market For Urllc Or Mmtc, By Region, 2020–2030 ($Million)
Table 08.5g In Aviation Market For Fwa, By Region, 2020–2030 ($Million)
Table 09.5g In Aviation Market, By End Use, 2020–2030 ($Million)
Table 10.5g In Aviation Market For Airport, By Region, 2020–2030 ($Million)
Table 11.5g In Aviation Market For Aircraft, By Region, 2020–2030 ($Million)
Table 12.5g In Aviation Market, By Region, 2020–2030 ($Million)
Table 13.North America 5g In Aviation Market, By Communication Infrastructure, 2020–2030 ($Million)
Table 14.North America 5g In Aviation Market, By Technology, 2020–2030 ($Million)
Table 15.North America 5g In Aviation Market, By End Use, 2020–2030 ($Million)
Table 16.U.S. 5g In Aviation Market, By Communication Infrastructure, 2020–2030 ($Million)
Table 17.U.S. 5g In Aviation Market, By Technology 2020–2030 ($Million)
Table 18.U.S. 5g In Aviation Market, By End Use, 2020–2030 ($Million)
Table 19.Canada 5g In Aviation Market, By Communication Infrastructure, 2020–2030 ($Million)
Table 20.Canada 5g In Aviation Market, By Technology 2020–2030 ($Million)
Table 21.Canada 5g In Aviation Market, By End Use, 2020–2030 ($Million)
Table 22.Mexico 5g In Aviation Market, By Communication Infrastructure, 2020–2030 ($Million)
Table 23.Mexico 5g In Aviation Market, By Technology 2020–2030 ($Million)
Table 24.Mexico 5g In Aviation Market, By End Use, 2020–2030 ($Million)
Table 25.Europe 5g In Aviation Market, By Communication Infrastructure, 2020–2030 ($Million)
Table 26.Europe 5g In Aviation Market, By Technology, 2020–2030 ($Million)
Table 27.Europe 5g In Aviation Market, By End Use, 2020–2030 ($Million)
Table 28.Uk 5g In Aviation Market, By Communication Infrastructure, 2020–2030 ($Million)
Table 29.Uk 5g In Aviation Market, By Technology 2020–2030 ($Million)
Table 30.Uk 5g In Aviation Market, By End Use, 2020–2030 ($Million)
Table 31.Germany 5g In Aviation Market, By Communication Infrastructure, 2020–2030 ($Million)
Table 32.Germany 5g In Aviation Market, By Technology 2020–2030 ($Million)
Table 33.Germany 5g In Aviation Market, By End Use, 2020–2030 ($Million)
Table 34.France 5g In Aviation Market, By Communication Infrastructure, 2020–2030 ($Million)
Table 35.France 5g In Aviation Market, By Technology 2020–2030 ($Million)
Table 36.France 5g In Aviation Market, By End Use, 2020–2030 ($Million)
Table 37.Spain 5g In Aviation Market, By Communication Infrastructure, 2020–2030 ($Million)
Table 38.Spain 5g In Aviation Market, By Technology 2020–2030 ($Million)
Table 39.Spain 5g In Aviation Market, By End Use, 2020–2030 ($Million)
Table 40.Rest Of Europe 5g In Aviation Market, By Communication Infrastructure, 2020–2030 ($Million)
Table 41.Rest Of Europe 5g In Aviation Market, By Technology 2020–2030 ($Million)
Table 42.Rest Of Europe 5g In Aviation Market, By End Use, 2020–2030 ($Million)
Table 43.Asia-Pacific 5g In Aviation Market, By Communication Infrastructure, 2020–2030 ($Million)
Table 44.Asia-Pacific 5g In Aviation Market, By Technology, 2020–2030 ($Million)
Table 45.Asia-Pacific 5g In Aviation Market, By End Use, 2020–2030 ($Million)
Table 46.China 5g In Aviation Market, By Communication Infrastructure, 2020–2030 ($Million)
Table 47.China 5g In Aviation Market, By Technology 2020–2030 ($Million)
Table 48.China 5g In Aviation Market, By End Use, 2020–2030 ($Million)
Table 49.Japan 5g In Aviation Market, By Communication Infrastructure, 2020–2030 ($Million)
Table 50.Japan 5g In Aviation Market, By Technology 2020–2030 ($Million)
Table 51.Japan 5g In Aviation Market, By End Use, 2020–2030 ($Million)
Table 52.South Korea 5g In Aviation Market, By Communication Infrastructure, 2020–2030 ($Million)
Table 53.South Korea 5g In Aviation Market, By Technology 2020–2030 ($Million)
Table 54.South Korea 5g In Aviation Market, By End Use, 2020–2030 ($Million)
Table 55.India 5g In Aviation Market, By Communication Infrastructure, 2020–2030 ($Million)
Table 56.India 5g In Aviation Market, By Technology 2020–2030 ($Million)
Table 57.India 5g In Aviation Market, By End Use, 2020–2030 ($Million)
Table 58.Rest Of Asia-Pacific 5g In Aviation Market, By Communication Infrastructure, 2020–2030 ($Million)
Table 59.Rest Of Asia-Pacific 5g In Aviation Market, By Technology 2020–2030 ($Million)
Table 60.Rest Of Asia-Pacific 5g In Aviation Market, By End Use, 2020–2030 ($Million)
Table 61.Lamea 5g In Aviation Market, By Communication Infrastructure, 2020–2030 ($Million)
Table 62.Lamea 5g In Aviation Market, By Technology, 2020–2030 ($Million)
Table 63.Lamea 5g In Aviation Market, By End Use, 2020–2030 ($Million)
Table 64.Latin America 5g In Aviation Market, By Communication Infrastructure, 2020–2030 ($Million)
Table 65.Latin America 5g In Aviation Market, By Technology 2020–2030 ($Million)
Table 66.Latin America 5g In Aviation Market, By End Use, 2020–2030 ($Million)
Table 67.Middle East 5g In Aviation Market, By Communication Infrastructure, 2020–2030 ($Million)
Table 68.Middle East 5g In Aviation Market, By Technology 2020–2030 ($Million)
Table 69.Middle East 5g In Aviation Market, By End Use, 2020–2030 ($Million)
Table 70.Africa 5g In Aviation Market, By Communication Infrastructure, 2020–2030 ($Million)
Table 71.Africa 5g In Aviation Market, By Technology 2020–2030 ($Million)
Table 72.Africa 5g In Aviation Market, By End Use, 2020–2030 ($Million)
Table 73.Cisco Systems, Inc.: Company Snapshot
Table 74.Cisco Systems, Inc.: Operating Segments
Table 75.Cisco Systems, Inc.: Product Portfolio
Table 76.Cisco Systems, Inc.: Key Strategic Moves And Developments
Table 77.Gogo Inc: Operating Segments
Table 78.Gogo Inc.: Product Portfolio
Table 79.Gogo Inc.: Key Strategic Moves And Developments
Table 80.Huawei Technologies Co., Ltd.: Company Snapshot
Table 81.Huawei Technologies Co., Ltd.: Operating Segments
Table 82.Huawei Technologies Co., Ltd.: Product Portfolio
Table 83.Huawei Technologies Co., Ltd.: Key Strategic Moves And Developments
Table 84.Inseego Corp.: Company Snapshot
Table 85.Inseego Corp.: Operating Segments
Table 86.Inseego Corp.: Product Portfolio
Table 87.Nokia Corporation.: Company Snapshot
Table 88.Nokia Corporation.: Operating Segments
Table 89.Nokia Corporation: Product Portfolio
Table 90.Oneweb: Company Snapshot
Table 91.Oneweb: Product Portfolio
Table 92.Panasonic Avionics Corporation.: Company Snapshot
Table 93.Panasonic Avionics Corporation.: Product Portfolio
Table 94.Panasonic Avionics Corporation.: Key Strategic Moves And Developments
Table 95.Qualcomm Technologies, Inc.: Company Snapshot
Table 96.Qualcomm Technologies, Inc.: Operating Segments
Table 97.Qualcomm Technologies, Inc.: Product Portfolio
Table 98.Qualcomm Technologies, Inc..: Key Strategic Moves And Developments
Table 99.Smartsky Networks, Llc.: Company Snapshot
Table 100.Smartsky Networks, Llc: Product Portfolio
Table 101.Telefonaktiebolaget Lm Ericsson: Company Snapshot
Table 102.Telefonaktiebolaget Lm Ericsson: Operating Segments
Table 103.Telefonaktiebolaget Lm Ericsson: Product Portfolio
Table 104.Telefonaktiebolaget Lm Ericsson: Key Strategic Moves And Developments
List Of Figures
Figure 01.Key Market Segments
Figure 02.5g In Aviation Market, By Segmentation, 2021–2030
Figure 03.5g In Aviation Market, By Region, 2021–2030
Figure 04.Top Impacting Factors
Figure 05.Top Investment Pockets
Figure 06.Top Winning Strategies, By Year, 2018–2021*
Figure 07.Top Winning Strategies, By Development, 2018–2021*
Figure 08.Top Winning Strategies, By Company, 2018–2021*
Figure 09.Low-To-High Bargaining Power Of Suppliers
Figure 10.Moderate-To-High Threat Of New Entrants
Figure 11.Moderate-To-High Threat Of Substitutes
Figure 12.Moderate-To-High Intensity Of Rivalry
Figure 13.Moderate-To-High Bargaining Power Of Buyers
Figure 14.Key Player Positioning (2020)
Figure 15.5g In Aviation Market Share, By Communication Infrastructure, 2020–2030 (%)
Figure 16.Comparative Share Analysis Of 5g In Aviation Market For Small Cell By Country, 2020 & 2030 (%)
Figure 17.Comparative Share Analysis Of 5g In Aviation Market For Das, By Country, 2020 & 2030 (%)
Figure 18.Comparative Share Analysis Of 5g In Aviation Market For Ran, By Country, 2020 & 2030 (%)
Figure 19.5g In Aviation Market Share, By Technology, 2020–2030 (%)
Figure 20.Comparative Share Analysis Of 5g In Aviation Market For Embb, By Country, 2020 & 2030 (%)
Figure 21.Comparative Share Analysis Of 5g In Aviation Market For Urllc Or Mmtc, By Country, 2020 & 2030 (%)
Figure 22.Comparative Share Analysis Of 5g In Aviation Market For Fwa, By Country, 2020 & 2030 (%)
Figure 23.5g In Aviation Market Share, By End Use, 2020–2030 (%)
Figure 24.Comparative Share Analysis Of 5g In Aviation Market For Airport, By Country, 2020 & 2030 (%)
Figure 25.Comparative Share Analysis Of 5g In Aviation Market For Aircraft, By Country, 2020 & 2030 (%)
Figure 26.5g In Aviation Market, By Region, 2020–2030 (%)
Figure 27.Comparative Share Analysis Of 5g In Aviation Market, By Country, 2020–2030 (%)
Figure 28.U.S. 5g In Aviation Market, 2020–2030 ($Million)
Figure 29.Canada 5g In Aviation Market, 2020–2030 ($Million)
Figure 30.Mexico 5g In Aviation Market, 2020–2030 ($Million)
Figure 31.Comparative Share Analysis Of 5g In Aviation Market, By Country, 2020–2030 (%)
Figure 32.Uk 5g In Aviation Market, 2020–2030 ($Million)
Figure 33.Germany 5g In Aviation Market, 2020–2030 ($Million)
Figure 34.France 5g In Aviation Market, 2020–2030 ($Million)
Figure 35.Spain 5g In Aviation Market, 2020–2030 ($Million)
Figure 36.Rest Of Europe 5g In Aviation Market, 2020–2030 ($Million)
Figure 37.Comparative Share Analysis Of 5g In Aviation Market, By Country, 2020–2030 (%)
Figure 38.China 5g In Aviation Market, 2020–2030 ($Million)
Figure 39.Japan 5g In Aviation Market, 2020–2030 ($Million)
Figure 40.South Korea 5g In Aviation Market, 2020–2030 ($Million)
Figure 41.India 5g In Aviation Market, 2020–2030 ($Million)
Figure 42.Rest Of Asia-Pacific 5g In Aviation Market, 2020–2030 ($Million)
Figure 43.Comparative Share Analysis Of 5g In Aviation Market, By Country, 2020–2030 (%)
Figure 44.Latin America 5g In Aviation Market, 2020–2030 ($Million)
Figure 45.Middle East 5g In Aviation Market, 2020–2030 ($Million)
Figure 46.Africa 5g In Aviation Market, 2020–2030 ($Million)
Figure 47.Cisco Systems, Inc.: Revenue, 2018–2020 ($Million)
Figure 48.Cisco Systems, Inc.: Revenue Share By Segment, 2020 (%)
Figure 49.Cisco Systems, Inc.: Revenue Share By Region, 2020 (%)
Figure 50.Gogo Inc.: Company Snapshot
Figure 51.Gogo Inc.: Revenue, 2018–2020 ($Million)
Figure 52.Gogo Inc.: Revenue Share By Segment, 2020 (%)
Figure 53.Huawei Technologies Co., Ltd.: Revenue, 2018–2020 ($Million)
Figure 54.Huawei Technologies Co., Ltd.: Revenue Share By Segment, 2020 (%)
Figure 55.Huawei Technologies Co., Ltd.: Revenue Share By Region, 2020 (%)
Figure 56.Inseego Corp.: Revenue, 2018–2020 ($Million)
Figure 57.Inseego Corp.: Revenue Share By Segment, 2020 (%)
Figure 58.Inseego Corp.: Revenue Share By Region, 2020 (%)
Figure 59.Nokia Corporation: Revenue, 2018–2020 ($Million)
Figure 60.Nokia Corporation: Revenue Share By Segment, 2020 (%)
Figure 61.Nokia Corporation: Revenue Share By Region, 2020 (%)
Figure 62.Panasonic Corporation, 2019–2021 ($Million)
Figure 63.Panasonic Corporation: Revenue Share By Segment, 2021 (%)
Figure 64.Panasonic Corporation: Revenue Share By Region, 2021 (%)
Figure 65.Qualcomm Technologies, Inc.: Net Sales, 2018–2020 ($Million)
Figure 66.Qualcomm Technologies, Inc.: Revenue Share, By Segment, 2020 (%)
Figure 67.Qualcomm Technologies, Inc.: Revenue Share, By Region, 2020 (%)
Figure 68.Telefonaktiebolaget Lm Ericsson: Revenue, 2018–2020 ($Million)
Figure 69.Telefonaktiebolaget Lm Ericsson: Revenue Share By Segment, 2020 (%)
Figure 70.Telefonaktiebolaget Lm Ericsson: Revenue Share By Region, 2020 (%)
$5769
$9995
HAVE A QUERY?
OUR CUSTOMER

SIMILAR REPORTS