
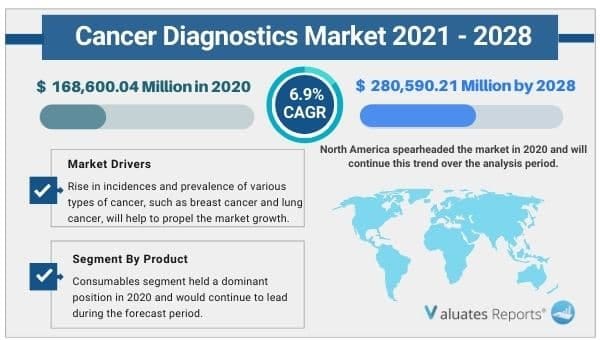
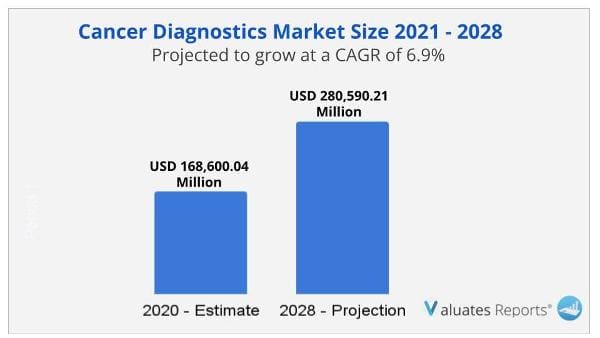
The global cancer diagnostics market size was valued at USD 168,600.04 Million in 2020, and is projected to reach USD 280,590.21 Million by 2028, registering a CAGR of 6.9% from 2021 to 2028.
Cancer diagnostics is a method of identifying different biomarkers, proteins, and some signs that lead to the identification of the presence of a cancerous tumor. Efficient diagnostic testing is used to validate or rule out the existence of illness, monitor the progression of the disease, and schedule & review treatment outcomes. Diagnostic procedures for cancer may include imaging, tumor biopsy, laboratory tests (including tests for tumor markers), endoscopic examination, surgery, or genetic testing.
COVID-19 outbreak had considerable impact across the world. The implementation of lockdown due to COVID-19 outbreak has delayed the diagnosis of cancer for longer period. It has also impacted the logistics and supply of cancer diagnosis tests kits and other products; thereby, having a minimal negative impact on the market.
Rise in incidences and prevalence of various types of cancer, such as breast cancer and lung cancer, will help the cancer diagnostics market propel during the forecast period. In addition, surge in technological advancements aiding in better imaging of cancerous cells, improvement in equipment to identify the type of cancer, and increase in efficiency of the result will help the cancer diagnostics industry to gain traction during the forecast period. Increase in government initiatives and other private organizations to spread awareness regarding early diagnosis & prevention of cancer is anticipated to boost the growth of the market in the coming years. Furthermore, growth in the number of diagnostics laboratories in developed countries is expected to drive the market in the next few years. A steep rise in emphasis over health & safety regulations and surge in popularity of yoga and other health related practices will act as a growth opportunity during the forecast period. However, huge cost associated with diagnostic imaging system and development of different diagnostic approaches for various cancer mutations may hinder the growth of the market.
In January 30th, 2020, the World Health Organization (WHO) declared COVID-19 outbreak a public health emergency of international concern. COVID-19 has affected around 210 countries across the globe.
Nationwide lockdown, government regulations, and continuous increase in infection rate across countries created a widespread financial impact on neurology hospitals and clinics. Several hospitals and clinics have witnessed a drop in number of patient visits amid COVID-19, ultimately reducing client contact. Furthermore, many cancer diagnostics have been delayed due to the COVID-19 crisis. There is limited availability of medical care for conditions other than COVID-19 globally, which has impacted the cancer diagnostics market in a negative manner. At the same time, limited availability of healthcare staff across the globe is another factor, which has an undesirable effect on the cancer diagnostics market.
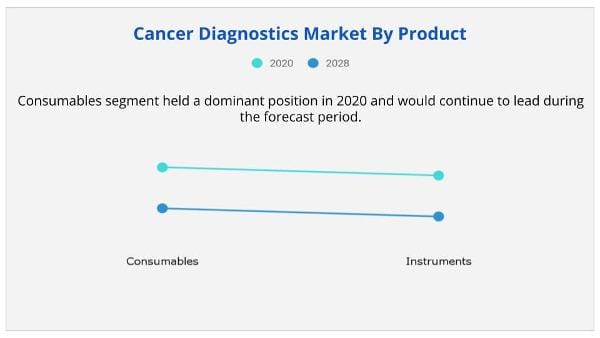
The cancer diagnostics market is segmented on the basis of product, application, and end use to provide a detailed assessment of the market. By product, the market is bifurcated into consumables and instruments. Further, consumables are divided into antibodies, kits & reagents, probes, and other consumables. Instruments include pathology-based instruments, imaging instruments, and biopsy instruments. On the basis of application, the market is fragmented into breast cancer, lung cancer, blood cancer, colorectal cancer, skin cancer, ovarian cancer, prostate cancer, kidney cancer, liver cancer, pancreatic cancer, cervical cancer, and others. In Based on end use, it is classified into hospitals & clinics, diagnostic laboratories, diagnostic imaging centers, and research institutes.
Presently, on the basis of product, the consumables segment is the major revenue contributor, and is projected to grow significantly during the forecast period. Increase in adoption of consumables repetitively for cancer diagnostics, surge in prevalence of cancer, rise in R&D investment, increase in geriatric population, introduction of technologically advanced products, and surge in launch of new & advanced kits and reagents are the key factors that boost the growth of the segment.
Depending on application, the breast cancer segment is the major shareholder in the cancer diagnostics market, owing to surge in prevalence of breast cancer across the globe and increase in population of women under the age of 50 to 74. Increase in number of initiatives taken by various organizations will help the industry gain traction in the coming years.
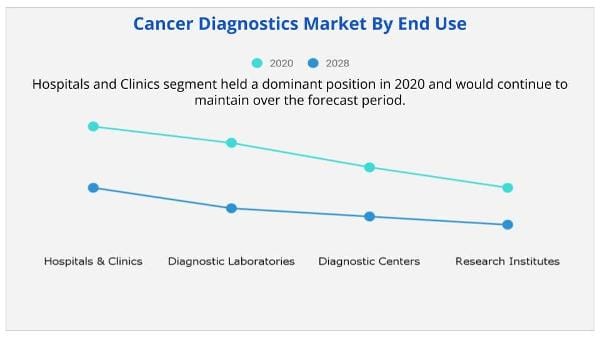
Depending on end use, the hospitals & clinics segment is the major shareholder in the cancer diagnostics market, owing to rise in number of patients visiting hospitals, surge in number of in-house diagnostic procedures performed in hospitals, and rise in awareness regarding early diagnosis, which are the major driving factors for this market.
The key players profiled in this report include Abbott Laboratories, Becton, Dickinson and Company, Bio-Rad Laboratories, Inc., Roche Holdings AG (F. Hoffmann-La Roche Ltd.), Danaher Corporation (GE Healthcare), Hologic, Inc., Koninklijke Philips N.V. (Philips Healthcare), Qiagen N.V., Siemens Healthcare GmbH, and Thermo Fisher Scientific.
|
Report Metric |
Details |
|
Report Name |
Cancer Diagnostics Market |
|
Market size value in 2020 |
USD 168,600.04 Million |
|
Revenue forecast in 2028 |
USD 280,590.21 Million |
|
Growth Rate |
CAGR 6.9% |
|
Base year considered |
2020 |
|
Forecast Period |
2021-2029 |
|
By Product |
Consumables and Instruments |
|
By Application |
Breast Cancer, Breast Cancer, Lung Cancer, Blood Cancer, Colorectal Cancer, Skin Cancer, Ovarian Cancer, Prostate Cancer, Kidney Cancer, Liver Cancer, Pancreatic Cancer, Cervical Cancer |
|
End User |
Hospitals & Clinics, Diagnostic Laboratories, Diagnostic Centers, and Research Institutes |
|
Report Coverage |
Revenue & volume forecast, company share, competitive landscape, growth factors, and trends |
|
Segments Covered |
By Type, Application, and Region |
|
Geographic Regions Covered |
North America, Europe, Asia Pacific, Latin America, Middle East & Africa |
Ans. The global cancer diagnostics market size was valued at USD 168,600.04 Million in 2020, and is projected to reach USD 280,590.21 Million by 2028, registering a CAGR of 6.9% from 2021 to 2028.
Ans. The key players profiled in this report include Abbott Laboratories, Becton, Dickinson and Company, Bio-Rad Laboratories, Inc., Roche Holdings AG (F. Hoffmann-La Roche Ltd.), Danaher Corporation (GE Healthcare), Hologic, Inc., Koninklijke Philips N.V. (Philips Healthcare), Qiagen N.V., Siemens Healthcare GmbH, and Thermo Fisher Scientific.
Ans. Yes, the report includes a COVID-19 impact analysis. Also, it is further extended into every individual segment of the report.
CHAPTER 1:INTRODUCTION
1.1.Report description
1.2.Key Benefits for Stakeholders
1.3.Key market segments
1.3.1.List of key players profiled in the report
1.4.Research methodology
1.4.1.Secondary research
1.4.2.Primary research
1.4.3.Analyst tools and models
CHAPTER 2:EXECUTIVE SUMMARY
2.1.Key findings of the study
2.2.CXO perspective
CHAPTER 3:MARKET OVERVIEW
3.1.Market definition and scope
3.2.Key findings
3.2.1.Top investment pockets
3.2.2.Top winning strategies
3.3.Porter's five forces analysis
3.3.1.Bargaining power of buyers
3.3.2.Bargaining power of suppliers
3.3.3.Thereat of new entrants
3.3.4.Threat of substitutes
3.3.5.Intensity of competitive rivalry
3.4.Top player positioning, 2019
3.5.Market dynamics
3.5.1.Drivers
3.5.1.1.Rise in incidences and prevalence of various cancer types
3.5.1.2.Increase in technological advancements
3.5.1.3.Government initiatives and other organization to spread awareness about cancer
3.5.1.4.Growing number of diagnostics laboratories In developed countries
3.5.2.Restraints
3.5.2.1.Huge cost associated with diagnostic imaging system
3.5.2.2.Risk related with high radiation exposure affecting use of CT scanner
3.5.3.Opportunities
3.5.3.1.Development of diagnostic approaches for various cancer mutation
3.6.Impact Analysis
3.7.Impact Analysis of the Covid-19 on Cancer Diagnostics Market
CHAPTER 4:CANCER DIAGNOSTICS MARKET, BY PRODUCT
4.1.Overview
4.1.1.Market size and forecast
4.2.Consumables
4.2.1.Key market trends, growth factors, and opportunities
4.2.2.Market size and forecast, by region
4.2.3.Market analysis, by country
4.2.4.Market size and forecast, by type
4.2.5.Antibodies
4.2.5.1.Market size and forecast
4.2.6.Kits & Reagents
4.2.6.1.Market size and forecast
4.2.7.Probes
4.2.7.1.Market size and forecast
4.2.8.Other consumables
4.2.8.1.Market size and forecast
4.3.Instruments
4.3.1.Key market trends, growth factors, and opportunities
4.3.2.Market size and forecast
4.3.3.Market analysis, by country
4.3.4.Market size and forecast, by type
4.3.5.Pathology-based Instruments
4.3.5.1.Market size and forecast
4.3.6.Imaging Instruments
4.3.6.1.Market size and forecast
4.3.7.Biopsy Instruments
4.3.7.1.Market size and forecast
CHAPTER 5:CANCER DIAGNOSTICS MARKET, BY APPLICATION
5.1.Overview
5.1.1.Market size and forecast
5.2.Breast Cancer
5.2.1.Market size and forecast, by region
5.2.2.Market analysis, by country
5.3.Colorectal Cancer
5.3.1.Market size and forecast, by region
5.3.2.Market analysis, by country
5.4.Cervical Cancer
5.4.1.Market size and forecast, by region
5.4.2.Market analysis, by country
5.5.Lung Cancer
5.5.1.Market size and forecast, by region
5.5.2.Market analysis, by country
5.6.Prostate Cancer
5.6.1.Market size and forecast, by region
5.6.2.Market analysis, by country
5.7.Skin Cancer
5.7.1.Market size and forecast, by region
5.7.2.Market analysis, by country
5.8.Blood Cancer
5.8.1.Market size and forecast, by region
5.8.2.Market analysis, by country
5.9.Kidney Cancer
5.9.1.Market size and forecast, by region
5.9.2.Market analysis, by country
5.10.Liver Cancer
5.10.1.Market size and forecast, by region
5.10.2.Market analysis, by country
5.11.Pancreatic Cancer
5.11.1.Market size and forecast, by region
5.11.2.Market analysis, by country
5.12.Ovarian Cancer
5.12.1.Market size and forecast, by region
5.12.2.Market analysis, by country
5.13.Others
5.13.1.Market size and forecast, by region
5.13.2.Market analysis, by country
CHAPTER 6:CANCER DIAGNOSTICS MARKET, BY END USE
6.1.Overview
6.1.1.Market size and forecast
6.2.Hospital and Clinics
6.2.1.Market size and forecast, by region
6.2.2.Market analysis, by country
6.3.Diagnostic Laboratories
6.3.1.Market size and forecast, by region
6.3.2.Market analysis, by country
6.4.Diagnostic Imaging Centers
6.4.1.Market size and forecast, by region
6.4.2.Market analysis, by country
6.5.Research Institutes
6.5.1.Market size and forecast, by region
6.5.2.Market analysis, by country
CHAPTER 7:CANCER DIAGNOSTICS MARKET, BY REGION
7.1.Overview
7.1.1.Market size and forecast
7.2.North America
7.2.1.Key market trends, growth factors, and opportunities
7.2.2.Market size and forecast, by country
7.2.2.1.U.S.
7.2.2.1.1.U.S. cancer diagnostics market, by product
7.2.2.1.2.U.S. cancer diagnostics market, by application
7.2.2.1.3.U.S. cancer diagnostics market, by end use
7.2.2.2.Canada
7.2.2.2.1.Canada cancer diagnostics market, by product
7.2.2.2.2.Canada cancer diagnostics market, by application
7.2.2.2.3.Canada cancer diagnostics market, by end use
7.2.2.3.Mexico
7.2.2.3.1.Mexico cancer diagnostics market, by product
7.2.2.3.2.Mexico cancer diagnostics market, by application
7.2.2.3.3.Mexico cancer diagnostics market, by end use
7.2.3.North America market size and forecast, by product
7.2.4.North America market size and forecast, by application
7.2.5.North America market size and forecast, by end use
7.3.Europe
7.3.1.Key market trends, growth factors, and opportunities
7.3.2.Market size and forecast, by country
7.3.2.1.Germany
7.3.2.1.1.Germany cancer diagnostics market, by product
7.3.2.1.2.Germany cancer diagnostics market, by application
7.3.2.1.3.Germany cancer diagnostics market, by end use
7.3.2.2.France
7.3.2.2.1.France cancer diagnostics market, by product
7.3.2.2.2.France cancer diagnostics market, by application
7.3.2.2.3.France cancer diagnostics market, by end use
7.3.2.3.UK
7.3.2.3.1.UK cancer diagnostics market, by product
7.3.2.3.2.UK cancer diagnostics market, by application
7.3.2.3.3.UK cancer diagnostics market, by end use
7.3.2.4.Italy
7.3.2.4.1.Italy cancer diagnostics market, by product
7.3.2.4.2.Italy cancer diagnostics market, by application
7.3.2.4.3.Italy cancer diagnostics market, by end use
7.3.2.5.Spain
7.3.2.5.1.Spain cancer diagnostics market, by product
7.3.2.5.2.Spain cancer diagnostics market, by application
7.3.2.5.3.Spain cancer diagnostics market, by end use
7.3.2.6.Rest of Europe
7.3.2.6.1.Rest of Europe cancer diagnostics market, by product
7.3.2.6.2.Rest of Europe cancer diagnostics market, by application
7.3.2.6.3.Rest of Europe cancer diagnostics market, by end use
7.3.3.Europe market size and forecast, by product
7.3.4.Europe market size and forecast, by application
7.3.5.Europe market size and forecast, by end use
7.4.Asia-Pacific
7.4.1.Key market trends, growth factors, and opportunities
7.4.2.Market size and forecast, by country
7.4.2.1.Japan
7.4.2.1.1.Japan cancer diagnostics market, by product
7.4.2.1.2.Japan cancer diagnostics market, by application
7.4.2.1.3.Japan cancer diagnostics market, by end use
7.4.2.2.China
7.4.2.2.1.China cancer diagnostics market, by product
7.4.2.2.2.China cancer diagnostics market, by application
7.4.2.2.3.China cancer diagnostics market, by end use
7.4.2.3.Australia
7.4.2.3.1.Australia cancer diagnostics market, by product
7.4.2.3.2.Australia cancer diagnostics market, by application
7.4.2.3.3.Australia cancer diagnostics market, by end use
7.4.2.4.India
7.4.2.4.1.India cancer diagnostics market, by product
7.4.2.4.2.India cancer diagnostics market, by application
7.4.2.4.3.India cancer diagnostics market, by end use
7.4.2.5.South Korea
7.4.2.5.1.South Korea cancer diagnostics market, by product
7.4.2.5.2.South Korea cancer diagnostics market, by application
7.4.2.5.3.South Korea cancer diagnostics market, by end use
7.4.2.6.Rest of Asia-Pacific
7.4.2.6.1.Rest of Asia-Pacific cancer diagnostics market, by product
7.4.2.6.2.Rest of Asia-Pacific cancer diagnostics market, by application
7.4.2.6.3.Rest of Asia-Pacific cancer diagnostics market, by end use
7.4.3.Asia-Pacific market size and forecast, by product
7.4.4.Asia-Pacific market size and forecast, by application
7.4.5.Asia-Pacific market size and forecast, by end use
7.5.LAMEA
7.5.1.Key market trends, growth factors, and opportunities
7.5.2.Market size and forecast, by country
7.5.2.1.Brazil
7.5.2.1.1.Brazil cancer diagnostics market, by product
7.5.2.1.2.Brazil cancer diagnostics market, by application
7.5.2.1.3.Brazil cancer diagnostics market, by end use
7.5.2.2.Saudi Arabia
7.5.2.2.1.Saudi Arabia cancer diagnostics market, by product
7.5.2.2.2.Saudi Arabia cancer diagnostics market, by application
7.5.2.2.3.Saudi Arabia cancer diagnostics market, by end use
7.5.2.3.South Africa
7.5.2.3.1.South Africa cancer diagnostics market, by product
7.5.2.3.2.South Africa cancer diagnostics market, by application
7.5.2.3.3.South Africa cancer diagnostics market, by end use
7.5.2.4.Rest of LAMEA
7.5.2.4.1.Rest of LAMEA cancer diagnostics market, by product
7.5.2.4.2.Rest of LAMEA cancer diagnostics market, by application
7.5.2.4.3.Rest of LAMEA cancer diagnostics market, by end use
7.5.3.LAMEA market size and forecast, by product
7.5.4.LAMEA market size and forecast, by application
7.5.5.LAMEA market size and forecast, by end use
CHAPTER 8:COMPANY PROFILES
8.1.ABBOTT LABORATORIES
8.1.1.Company overview
8.1.2.Company snapshot
8.1.3.Operating business segments
8.1.4.Product portfolio
8.1.5.Business performance
8.2.BECTON, DICKINSON AND COMPANY
8.2.1.Company overview
8.2.2.Company snapshot
8.2.3.Operating business segments
8.2.4.Product portfolio
8.2.5.Business performance
8.2.6.Key strategic moves and developments
8.3.Bio-Rad Laboratories, Inc.
8.3.1.Company overview
8.3.2.Company snapshot
8.3.3.Operating business segments
8.3.4.Product portfolio
8.3.5.Business performance
8.3.6.Key strategic moves and developments
8.4.Roche Holdings AG (F. Hoffmann-La Roche Ltd.)
8.4.1.Company overview
8.4.2.Company snapshot
8.4.3.Operating business segments
8.4.4.Product portfolio
8.4.5.Business performance
8.4.6.Key strategic moves and developments
8.5.Danaher Corporation (GE Healthcare)
8.5.1.Company overview
8.5.2.Company snapshot
8.5.3.Operating business segments
8.5.4.Product portfolio
8.5.5.Business performance
8.5.6.Key strategic moves and developments
8.6.Hologic, Inc.
8.6.1.Company overview
8.6.2.Company snapshot
8.6.3.Operating business segments
8.6.4.Product portfolio
8.6.5.Business performance
8.6.6.Key strategic moves and developments
8.7.KONINKLIJKE PHILIPS N.V. (Philips Healthcare)
8.7.1.Company overview
8.7.2.Company snapshot
8.7.3.Operating business segments
8.7.4.Product portfolio
8.7.5.Business performance
8.7.6.Key strategic moves and developments
8.8.Qiagen N.V.
8.8.1.Company overview
8.8.2.Company snapshot
8.8.3.Operating business segments
8.8.4.Product portfolio
8.8.5.Business performance
8.8.6.Key strategic moves and developments
8.9.Siemens Healthcare GmbH
8.9.1.Company overview
8.9.2.Company snapshot
8.9.3.Operating business segments
8.9.4.Product portfolio
8.9.5.Business performance
8.9.6.Key strategic moves and developments
8.10.Thermo Fisher Scientific
8.10.1.Company overview
8.10.2.Company snapshot
8.10.3.Operating business segments
8.10.4.Product portfolio
8.10.5.Business performance
8.10.6.Key strategic moves and developments
LIST OF TABLES
TABLE 01.GLOBAL CANCER DIAGNOSTICS MARKET, BY PRODUCT, 2020-2028 ($MILLION)
TABLE 02.CONSUMABLES CANCER DIAGNOSTICS MARKET, BY REGION, 2020-2028 ($MILLION)
TABLE 03.CONSUMABLES CANCER DIAGNOSTICS MARKET, BY TYPE, 2020-2028, ($MILLION)
TABLE 04.INSTRUMENTS CANCER DIAGNOSTICS MARKET, BY REGION, 2020-2028 ($MILLION)
TABLE 05.INSTRUMENTS CANCER DIAGNOSTICS MARKET, BY TYPE, 2020-2028, ($MILLION)
TABLE 06.GLOBAL CANCER DIAGNOSTICS MARKET, BY APPLICATION, 2020-2028 ($MILLION)
TABLE 07.BREAST CANCER DIAGNOSTICS MARKET, BY REGION, 2020-2028 ($MILLION)
TABLE 08.COLORECTAL CANCER, CANCER DIAGNOSTICS MARKET, BY REGION, 2020-2028 ($MILLION)
TABLE 09.CERVICAL CANCER, CANCER DIAGNOSTICS MARKET, BY REGION, 2020-2028 ($MILLION)
TABLE 10.LUNG CANCER CANCER DIAGNOSTICS MARKET, BY REGION, 2020-2028 ($MILLION)
TABLE 11.PROSTSATE CANCER, CANCER DIAGNOSTICS MARKET, BY REGION, 2020-2028 ($MILLION)
TABLE 12.SKIN CANCER CANCER DIAGNOSTICS MARKET, BY REGION, 2020-2028 ($MILLION)
TABLE 13.BLOOD CANCER CANCER DIAGNOSTICS MARKET, BY REGION, 2020-2028 ($MILLION)
TABLE 14.KIDNEY CANCER CANCER DIAGNOSTICS MARKET, BY REGION, 2020-2028 ($MILLION)
TABLE 15.LIVER CANCER CANCER DIAGNOSTICS MARKET, BY REGION, 2020-2028 ($MILLION)
TABLE 16.PANCREATIC CANCER CANCER DIAGNOSTICS MARKET, BY REGION, 2020-2028 ($MILLION)
TABLE 17.OVARIAN CANCER CANCER DIAGNOSTICS MARKET, BY REGION, 2020-2028 ($MILLION)
TABLE 18.OTHERS CANCER CANCER DIAGNOSTICS MARKET, BY REGION, 2020-2028 ($MILLION)
TABLE 19.GLOBAL CANCER DIAGNOSTICS MARKET, BY END USE, 2020–2028 ($MILLION)
TABLE 20.HOSPITALS AND CLINICS, CANCER DIAGNOSTICS MARKET, BY REGION, 2020–2028 ($MILLION)
TABLE 21.DIAGNOSTICS LABORATORIES CANCER DIAGNOSTICS MARKET, BY REGION, 2020–2028 ($MILLION)
TABLE 22.DIAGNOSTICS IMAGING CENTERS CANCER DIAGNOSTICS MARKET, BY REGION, 2020–2028 ($MILLION)
TABLE 23.RESEARCH INSTITUTES CANCER DIAGNOSTICS MARKET, BY REGION, 2020–2028 ($MILLION)
TABLE 24.CANCER DIAGNOSTICS MARKET, BY REGION, 2020–2028 ($MILLION)
TABLE 25.NORTH AMERICA CANCER DIAGNOSTICS MARKET, BY COUNTRY, 2020–2028 ($MILLION)
TABLE 26.U.S. CANCER DIAGNOSTICS MARKET, BY PRODUCT, 2020–2028
TABLE 27.U.S. CANCER DIAGNOSTICS MARKET, BY APPLICATION, 2020–2028
TABLE 28.U.S. CANCER DIAGNOSTICS MARKET, BY END USE, 2020–2028
TABLE 29.CANADA CANCER DIAGNOSTICS MARKET, BY PRODUCT, 2020–2028
TABLE 30.CANADA CANCER DIAGNOSTICS MARKET, BY APPLICATION, 2020–2028
TABLE 31.CANADA CANCER DIAGNOSTICS MARKET, BY END USE, 2020–2028
TABLE 32.MEXICO CANCER DIAGNOSTICS MARKET, BY PRODUCT, 2020–2028
TABLE 33.MEXICO CANCER DIAGNOSTICS MARKET, BY APPLICATION, 2020–2028
TABLE 34.MEXICO CANCER DIAGNOSTICS MARKET, BY END USE, 2020–2028
TABLE 35.NORTH AMERICA CANCER DIAGNOSTICS MARKET, BY PRODUCT, 2020–2028
TABLE 36.NORTH AMERICA CANCER DIAGNOSTICS MARKET, BY APPLICATION, 2020–2028
TABLE 37.NORTH AMERICA CANCER DIAGNOSTICS MARKET, BY END USE, 2020–2028
TABLE 38.EUROPE CANCER DIAGNOSTICS MARKET, BY COUNTRY, 2020–2028 ($MILLION)
TABLE 39.GERMANY CANCER DIAGNOSTICS MARKET, BY PRODUCT, 2020–2028
TABLE 40.GERMANY CANCER DIAGNOSTICS MARKET, BY APPLICATION, 2020–2028
TABLE 41.GERMANY CANCER DIAGNOSTICS MARKET, BY END USE, 2020–2028
TABLE 42.FRANCE CANCER DIAGNOSTICS MARKET, BY PRODUCT, 2020–2028
TABLE 43.FRANCE CANCER DIAGNOSTICS MARKET, BY APPLICATION, 2020–2028
TABLE 44.FRANCE CANCER DIAGNOSTICS MARKET, BY END USE, 2020–2028
TABLE 45.UK CANCER DIAGNOSTICS MARKET, BY PRODUCT, 2020–2028
TABLE 46.UK CANCER DIAGNOSTICS MARKET, BY APPLICATION, 2020–2028
TABLE 47.UK CANCER DIAGNOSTICS MARKET, BY END USE, 2020–2028
TABLE 48.ITALY CANCER DIAGNOSTICS MARKET, BY PRODUCT, 2020–2028
TABLE 49.ITALY CANCER DIAGNOSTICS MARKET, BY APPLICATION, 2020–2028
TABLE 50.ITALY CANCER DIAGNOSTICS MARKET, BY END USE, 2020–2028
TABLE 51.SPAIN CANCER DIAGNOSTICS MARKET, BY PRODUCT, 2020–2028
TABLE 52.SPAIN CANCER DIAGNOSTICS MARKET, BY APPLICATION, 2020–2028
TABLE 53.SPAIN CANCER DIAGNOSTICS MARKET, BY END USE, 2020–2028
TABLE 54.REST OF EUROPE CANCER DIAGNOSTICS MARKET, BY PRODUCT, 2020–2028
TABLE 55.REST OF EUROPE CANCER DIAGNOSTICS MARKET, BY APPLICATION, 2020–2028
TABLE 56.REST OF EUROPE CANCER DIAGNOSTICS MARKET, BY END USE, 2020–2028
TABLE 57.EUROPE CANCER DIAGNOSTICS MARKET, BY PRODUCT, 2020–2028
TABLE 58.EUROPE CANCER DIAGNOSTICS MARKET, BY APPLICATION, 2020–2028
TABLE 59.EUROPE CANCER DIAGNOSTICS MARKET, BY END USE, 2020–2028
TABLE 60.ASIA-PACIFIC CANCER DIAGNOSTICS MARKET, BY COUNTRY, 2020–2028 ($MILLION)
TABLE 61.JAPAN CANCER DIAGNOSTICS MARKET, BY PRODUCT, 2020–2028
TABLE 62.JAPAN CANCER DIAGNOSTICS MARKET, BY APPLICATION, 2020–2028
TABLE 63.JAPAN CANCER DIAGNOSTICS MARKET, BY END USE, 2020–2028
TABLE 64.CHINA CANCER DIAGNOSTICS MARKET, BY PRODUCT, 2020–2028
TABLE 65.CHINA CANCER DIAGNOSTICS MARKET, BY APPLICATION, 2020–2028
TABLE 66.CHINA CANCER DIAGNOSTICS MARKET, BY END USE, 2020–2028
TABLE 67.AUSTRALIA CANCER DIAGNOSTICS MARKET, BY PRODUCT, 2020–2028
TABLE 68.AUSTRALIA CANCER DIAGNOSTICS MARKET, BY APPLICATION, 2020–2028
TABLE 69.AUSTRALIA CANCER DIAGNOSTICS MARKET, BY END USE, 2020–2028
TABLE 70.INDIA CANCER DIAGNOSTICS MARKET, BY PRODUCT, 2020–2028
TABLE 71.INDIA CANCER DIAGNOSTICS MARKET, BY APPLICATION, 2020–2028
TABLE 72.INDIA CANCER DIAGNOSTICS MARKET, BY END USE, 2020–2028
TABLE 73.SOUTH KOREA CANCER DIAGNOSTICS MARKET, BY PRODUCT, 2020–2028
TABLE 74.SOUTH KOREA CANCER DIAGNOSTICS MARKET, BY APPLICATION, 2020–2028
TABLE 75.SOUTH KOREA CANCER DIAGNOSTICS MARKET, BY END USE, 2020–2028
TABLE 76.REST OF ASIA-PACIFIC CANCER DIAGNOSTICS MARKET, BY PRODUCT, 2020–2028
TABLE 77.REST OF ASIA-PACIFIC CANCER DIAGNOSTICS MARKET, BY APPLICATION, 2020–2028
TABLE 78.REST OF ASIA-PACIFIC CANCER DIAGNOSTICS MARKET, BY END USE, 2020–2028
TABLE 79.ASIA-PACIFIC CANCER DIAGNOSTICS MARKET, BY PRODUCT, 2020–2028
TABLE 80.ASIA-PACIFIC CANCER DIAGNOSTICS MARKET, BY APPLICATION, 2020–2028
TABLE 81.ASIA-PACIFIC CANCER DIAGNOSTICS MARKET, BY END USE, 2020–2028
TABLE 82.LAMEA CANCER DIAGNOSTICS MARKET, BY COUNTRY, 2020–2028 ($MILLION)
TABLE 83.LAMEA CANCER DIAGNOSTICS MARKET, BY COUNTRY, 2020–2028 (UNITS)
TABLE 84.BRAZIL CANCER DIAGNOSTICS MARKET, BY PRODUCT, 2020–2028
TABLE 85.BRAZIL CANCER DIAGNOSTICS MARKET, BY APPLICATION, 2020–2028
TABLE 86.BRAZIL CANCER DIAGNOSTICS MARKET, BY END USE, 2020–2028
TABLE 87.SAUDI ARABIA CANCER DIAGNOSTICS MARKET, BY PRODUCT, 2020–2028
TABLE 88.SAUDI ARABIA CANCER DIAGNOSTICS MARKET, BY APPLICATION, 2020–2028
TABLE 89.SAUDI ARABIA CANCER DIAGNOSTICS MARKET, BY END USE, 2020–2028
TABLE 90.SOUTH AFRICA CANCER DIAGNOSTICS MARKET, BY PRODUCT, 2020–2028
TABLE 91.SOUTH AFRICA CANCER DIAGNOSTICS MARKET, BY APPLICATION, 2020–2028
TABLE 92.SOUTH AFRICA CANCER DIAGNOSTICS MARKET, BY END USE, 2020–2028
TABLE 93.REST OF LAMEA CANCER DIAGNOSTICS MARKET, BY PRODUCT, 2020–2028
TABLE 94.REST OF LAMEA CANCER DIAGNOSTICS MARKET, BY APPLICATION, 2020–2028
TABLE 95.REST OF LAMEA CANCER DIAGNOSTICS MARKET, BY END USE, 2020–2028
TABLE 96.LAMEA CANCER DIAGNOSTICS MARKET, BY PRODUCT, 2020–2028
TABLE 97.LAMEA CANCER DIAGNOSTICS MARKET, BY APPLICATION, 2020–2028
TABLE 98.LAMEA CANCER DIAGNOSTICS MARKET, BY END USE, 2020–2028
TABLE 99.ABBOTT: COMPANY SNAPSHOT
TABLE 100.ABBOTT: OPERATING SEGMENT
TABLE 101.ABBOTT LABORATORIES PLC: PRODUCT PORTFOLIO
TABLE 102.BD: SNAPSHOT
TABLE 103.BD: OPERATING SEGMENTS
TABLE 104.BD: PRODUCT PORTFOLIO
TABLE 105.BD: KEY STRATEGIC MOVES AND DEVELOPMENTS
TABLE 106.BIO-RAD: COMPANY SNAPSHOT
TABLE 107.MYRIAD: OERATING SEGMENT
TABLE 108.BIO-RAD: PRODUCT PORTFOLIO
TABLE 109.BIO-RAD: KEY STRATEGIC MOVES AND DEVELOPMENTS
TABLE 110.ROCHE: COMPANY SNAPSHOT
TABLE 111.ROCHE: OPERATING SEGMENTS
TABLE 112.ROCHE: PRODUCT PORTFOLIO
TABLE 113.ROCHE: KEY STRATEGIC MOVES AND DEVELOPMENTS
TABLE 114.DANAHER: COMPANY SNAPSHOT
TABLE 115.DANAHER: OPERATING SEGMENT
TABLE 116.DANAHER: PRODUCT PORTFOLIO
TABLE 117.DANAHER: KEY STRATEGIC MOVES AND DEVELOPMENTS
TABLE 118.HOLOGIC: COMPANY SNAPSHOT
TABLE 119.HOLOGIC: OERATING SEGMENT
TABLE 120.HOLOGIC: PRODUCT PORTFOLIO
TABLE 121.HOLOGIC: KEY STRATEGIC MOVES AND DEVELOPMENTS
TABLE 122.PHILIPS: COMPANY SNAPSHOT
TABLE 123.PHILIPS: OERATING SEGMENT
TABLE 124.PHILIPS: PRODUCT PORTFOLIO
TABLE 125.PHILIPS: KEY STRATEGIC MOVES AND DEVELOPMENTS
TABLE 126.QIAGEN: COMPANY SNAPSHOT
TABLE 127.QIAGEN: PRODUCT PORTFOLIO
TABLE 128.QIAGEN: KEY STRATEGIC MOVES AND DEVELOPMENTS
TABLE 129.SIEMENS: COMPANY SNAPSHOT
TABLE 130.SIEMENS: OERATING SEGMENTS
TABLE 131.SIEMENS: PRODUCT PORTFOLIO
TABLE 132.SIEMENS: KEY STRATEGIC MOVES AND DEVELOPMENTS
TABLE 133.THERMO: COMPANY SNAPSHOT
TABLE 134.THERMO: OPERATING SEGMENTS
TABLE 135.THERMO: PRODUCT PORTFOLIO
TABLE 136.THERMO: KEY STRATEGIC MOVES AND DEVELOPMENTS
LIST OF FIGURES
FIGURE 01.GLOBAL CANCER DIAGNOSTICS MARKET SEGMENTATION
FIGURE 02.TOP INVESTMENT POCKETS
FIGURE 03.TOP WINNING STRATEGIES, BY YEAR, 2018–2021
FIGURE 04.TOP WINNING STRATEGIES, BY DEVELOPMENT, 2018–2021
FIGURE 05.TOP WINNING STRATEGIES, BY COMPANY, 2018–2021
FIGURE 06.MODERATE BARGAINING POWER OF BUYERS
FIGURE 07.MODERATE BARGAINING POWER OF SUPPLIERS
FIGURE 08.MODERATE THREAT OF NEW ENTRANTS
FIGURE 10.MODERATE COMPETITIVE RIVALRY
FIGURE 11.TOP PLAYER POSITIONING, 2019
FIGURE 12.PIE CHART FOR CANCER CASES DIAGNOSED IN 2020
FIGURE 13.COMPARATIVE ANALYSIS OF CONSUMABLES CANCER DIAGNOSTICS MARKET, BY COUNTRY, 2020 & 2028 ($MILLION)
FIGURE 14.ANTIBODIES MARKET, 2020-2028, ($MILLION)
FIGURE 15.KITS & REAGENTS MARKET, 2020-2028, ($MILLION)
FIGURE 16.KITS & REAGENTS MARKET, 2020-2028, ($MILLION)
FIGURE 17.KITS & REAGENTS MARKET, 2020-2028, ($MILLION)
FIGURE 18.COMPARATIVE ANALYSIS OF INSTRUMENTS CANCER DIAGNOSTICS MARKET, BY COUNTRY, 2020 & 2028 ($MILLION)
FIGURE 19.PATHOLOGY-BASED INSTRUMENTS MARKET, 2020-2028, ($MILLION)
FIGURE 20.IMAGING INSTRUMENTS MARKET, 2020-2028, ($MILLION)
FIGURE 21.BIOPSY INSTRUMENTS MARKET, 2020-2028, ($MILLION)
FIGURE 22.COMPARATIVE ANALYSIS OF BREAST CANCER DIAGNOSTICS MARKET, BY COUNTRY, 2020 & 2028 ($MILLION)
FIGURE 23.COMPARATIVE ANALYSIS OF COLORECTAL CANCER CANCER DIAGNOSTICS MARKET, BY COUNTRY, 2020 & 2028 ($MILLION)
FIGURE 24.COMPARATIVE ANALYSIS OF CERVICAL CANCER CANCER DIAGNOSTICS MARKET, BY COUNTRY, 2020 & 2028 ($MILLION)
FIGURE 25.COMPARATIVE ANALYSIS OF LUNG CANCER CANCER DIAGNOSTICS MARKET, BY COUNTRY, 2020 & 2028 ($MILLION)
FIGURE 26.COMPARATIVE ANALYSIS OF PROSTATE CANCER, CANCER DIAGNOSTICS MARKET, BY COUNTRY, 2020 & 2028 ($MILLION)
FIGURE 27.COMPARATIVE ANALYSIS OF SKIN CANCER CANCER DIAGNOSTICS MARKET, BY COUNTRY, 2020 & 2028 ($MILLION)
FIGURE 28.COMPARATIVE ANALYSIS OF BLOOD CANCER CANCER DIAGNOSTICS MARKET, BY COUNTRY, 2020 & 2028 ($MILLION)
FIGURE 29.COMPARATIVE ANALYSIS OF KIDNEY CANCER CANCER DIAGNOSTICS MARKET, BY COUNTRY, 2020 & 2028 ($MILLION)
FIGURE 30.COMPARATIVE ANALYSIS OF LIVER CANCER CANCER DIAGNOSTICS MARKET, BY COUNTRY, 2020 & 2028 ($MILLION)
FIGURE 31.COMPARATIVE ANALYSIS OF PANCREATIC CANCER CANCER DIAGNOSTICS MARKET, BY COUNTRY, 2020 & 2028 ($MILLION)
FIGURE 32.COMPARATIVE ANALYSIS OF OVARIAN CANCER CANCER DIAGNOSTICS MARKET, BY COUNTRY, 2020 & 2028 ($MILLION)
FIGURE 33.COMPARATIVE ANALYSIS OF OTHERS CANCER CANCER DIAGNOSTICS MARKET, BY COUNTRY, 2020 & 2028 ($MILLION)
FIGURE 34.COMPARATIVE ANALYSIS OF RETAIL PHARMACIES CANCER DIAGNOSTICS MARKET, BY COUNTRY, 2020 & 2028 ($MILLION)
FIGURE 35.COMPARATIVE ANALYSIS OF HOSPITAL PHARMACIES CANCER DIAGNOSTICS MARKET, BY COUNTRY, 2020 & 2028 ($MILLION)
FIGURE 36.COMPARATIVE ANALYSIS OF E-COMMERCE CANCER DIAGNOSTICS MARKET, BY COUNTRY, 2020 & 2028 ($MILLION)
FIGURE 37.COMPARATIVE ANALYSIS OF E-COMMERCE CANCER DIAGNOSTICS MARKET, BY COUNTRY, 2020 & 2028 ($MILLION)
FIGURE 38.ABBOTT: NET SALES, 2018–2020 ($MILLION)
FIGURE 39.ABBOTT: REVENUE SHARE BY SEGMENT, 2020 (%)
FIGURE 40.ABBOTT: REVENUE SHARE BY REGION, 2020 (%)
FIGURE 41.BD: NET SALES, 2018–2020 ($MILLION)
FIGURE 42.BD: REVENUE SHARE BY SEGMENT, 2020 (%)
FIGURE 43.BD: REVENUE SHARE, BY REGION, 2020 (%)
FIGURE 44.BIO-RAD: NET SALES, 2018–2020 ($MILLION)
FIGURE 45.BIO-RAD: REVENUE SHARE BY SEGMENT, 2020 (%)
FIGURE 46.BIO-RAD: REVENUE SHARE BY REGION, 2020 (%)
FIGURE 47.ROCHE: NET SALES, 2018–2020 ($MILLION)
FIGURE 48.ROCHE: REVENUE SHARE, BY SEGMENT, 2020 ($MILLION)
FIGURE 49.DANAHER: NET SALES, 2018–2020 ($MILLION)
FIGURE 50.DANAHER: REVENUE SHARE BY SEGMENT, 2020
FIGURE 51.DANAHER: REVENUE SHARE BY REGION, 2020(%)
FIGURE 52.HOLOGIC: NET SALES, 2018–2020 ($MILLION)
FIGURE 53.HOLOGIC: REVENUE SHARE BY SEGMENT, 2020 (%)
FIGURE 54.HOLOGIC: REVENUE SHARE BY REGION, 2020 (%)
FIGURE 55.PHILIPS: NET SALES, 2018–2020 ($MILLION)
FIGURE 56.PHILIPS: REVENUE SHARE BY SEGMENT, 2020 (%)
FIGURE 57.PHILIPS: REVENUE SHARE BY REGION, 2020 (%)
FIGURE 58.QIAGEN: NET SALES, 2018–2020 ($MILLION)
FIGURE 59.QIAGEN: REVENUE SHARE BY SEGMENT, 2020 (%)
FIGURE 60.SIEMENS: NET SALES, 2018-2020 ($MILLION)
FIGURE 61.SIEMENS: REVENUE SHARE BY SEGMENT, 2020 (%)
FIGURE 62.SIEMENS: REVENUE SHARE BY REGION, 2020 (%)
FIGURE 63.THERMO: NET SALES, 2018–2020 ($MILLION)
FIGURE 64.THERMO: REVENUE SHARE, BY SEGMENT, 2020 (%)
FIGURE 65.THERMO: REVENUE SHARE, BY REGION, 2020 (%)
$6168
$10663
HAVE A QUERY?
OUR CUSTOMER
