
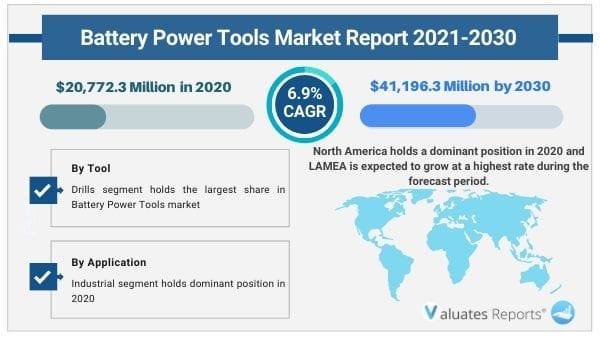
The global battery power tools market size was valued at $20,772.3 million in 2020 and is projected to reach $41,196.3 million by 2030, growing at a CAGR of 6.9% from 2021 to 2030. Power tools that are cordless and operated with the help of batteries for drilling, screw driving, chiseling, and sanding are known as battery power tools. These tools are used for various applications such as production, packaging, assembly, and maintenance operations. These tools include handheld machine drills, saws, nailers, grinders, impact wrench, and other types of battery power tools.
The battery power tools market was hampered in the first and second quarter owing to lockdown in several major countries, however, the market recovered in the third and fourth quarter due to recovery of sales majorly in North America and Europe region.
Growth in the adoption of battery power tools in the automotive, construction and manufacturing sector has led to surge in the battery power tools market globally. Moreover, training for operating the battery power tools has led to increase in power tools by professional as well as individual users. In addition, affordable and energy efficient battery power tools has led to increase in demand for power tools in do-it-yourself (DIY) techniques among household consumers. Platforms such as YouTube and websites of OEM, also offer training and user guidance for the DIY consumers, thus, offering aftersales support to them as well. Further, introduction of brushless battery power tools uses magnet for its basic operation and thus, significantly reduces the maintenance cost of the tools and therefore, leads to increase in sales of the brushless battery power tools. These factors act as a driver to the battery power tools market.
However, availability of low-cost alternative, such as manually operated hand tools and availability of more powerful tools such as corded power tools leads some customers to opt for these alternatives as per their budget and application, thus acting as a restraining factor to the battery power tools market. In addition, decrease in rate of new construction has led to decline in sales of the battery power tools. Furthermore, during the outbreak of COVID-19, construction, manufacturing, hotel, and tourism industries were majorly affected. Construction activities were also stopped or restricted to a huge extent. Manufacturing and transportation activities along with the supply chains of industrial equipment were hampered on a global level. This led to decline in construction activities, which directly hampers the battery power tools market. However, gradually all industries are resuming their regular manufacturing and services. This is further expected to lead to re-initiation of battery power tools companies at their full-scale capacities, which is expected to help the market to start to recover by end of 2021.
On the contrary, growing advancement of rechargeable batteries such has Li-ion batteries that are more powerful is anticipated to offer lucrative growth opportunities for the global market.
The global battery power tools market is segmented into motor type, tool, application, and region. Depending on motor type, the market is divided into brushed motor and brushless motor. By tool, it is classified into drills, saws, lawn mower, impact wrench, and others. The others segment includes hammers, grinders, nibbler, polishers, planers, staplers, nailers, and others. The applications covered in the study are industrial and DIY. The global battery power tools market is analyzed across North America (the U.S., Canada, and Mexico), Europe (Germany, the UK, France, Russia and rest of Europe), Asia-Pacific (China, Japan, South Korea, India, and Rest of Asia-Pacific), and LAMEA (Latin America, Middle East, and Africa).
By motor type, in 2020, the brushed segment dominated the global battery power tools market, in terms of revenue and the brushless segment is expected to witness growth at the highest CAGR during the forecast period. On the basis of tool, the drills segment led the market in 2020, in terms of revenue and the lawn mower segment is anticipated to register the highest CAGR during the forecast period. By application, the industrial segment led the market in 2019, in terms of revenue and DIY is anticipated to register the highest CAGR during the forecast period.
The major players profiled in the battery power tools market include Apex Tool Group, Atlas Copco AB, Hilti Corporation, Ingersoll-Rand PLC, Hitachi Ltd., Makita Corporation, Robert Bosch GmbH, Snap-On Incorporated, Stanley Black and Decker, and Techtronic Industries. These major companies in the market have adopted strategies such as business expansion, collaboration, acquisition, and product launch, to offer better products and services to customers in the battery power tools market.
By Motor Type
By Tools
By Application
By Region
Key Players
CHAPTER 1:INTRODUCTION
1.1.Report description
1.2.Research methodology
1.2.1.Primary research
1.2.2.Secondary research
1.2.3.Analyst tools and models
CHAPTER 2:EXECUTIVE SUMMARY
2.1.CXO perspective
CHAPTER 3:MARKET OVERVIEW
3.1.Market definition and scope
3.2.Key findings
3.2.1.Top investment pockets
3.2.2.Top winning strategies
3.3.Porter's five forces analysis
3.4.Market share analysis
3.4.1.Volume analysis, by company, 2020 (unit)
3.4.1.1.By input power type
3.4.1.1.1.Corded
3.4.1.1.2.Battery powered
3.4.1.2.By motor type
3.4.1.2.1.Brushed motor
3.4.1.2.2.Brushless motor
3.4.1.3.By Tool
3.4.1.3.1.Drills
3.4.1.3.2.Saws
3.4.1.3.3.Lawn mower
3.4.1.3.4.Impact wrench
3.4.1.3.5.Others
3.4.1.4.By Region
3.4.1.4.1.North America
3.4.1.4.2.Europe
3.4.1.4.3.Asia-Pacific
3.4.1.4.4.LAMEA
3.5.Market dynamics
3.5.1.Drivers
3.5.1.1.Surge in adoption of battery power tools in the automotive industry
3.5.1.2.Rise in popularity of brushless battery power tools
3.5.1.3.Upsurge in demand for affordable & energy-efficient power tools
3.5.2.Restraints
3.5.2.1.Availability of low cost alternative
3.5.2.2.Decline in rate of new construction in developed nations
3.5.3.Opportunity
3.5.3.1.Advancements of rechargeable batteries
3.6.COVID-19 Impact Analysis
3.7.Electric power tools market, by revenue, by type
3.8.Consumer price analysis
CHAPTER 4:BATTERY POWER TOOL MARKET, BY MOTOR TYPE
4.1.Market overview
4.1.1.Market size and forecast, by motor type (revenue)
4.1.2.Market size and forecast, by motor type (volume)
4.2.Brushed motor
4.2.1.Key market trends, growth factors, and opportunities
4.2.2.Market size and forecast, by region (revenue)
4.2.3.Market analysis, by country (revenue)
4.2.4.Market size and forecast, by region (volume)
4.2.5.Market analysis, by country (volume)
4.3.Brushless motor
4.3.1.Key market trends, growth factors, and opportunities
4.3.2.Market size and forecast, by region (revenue)
4.3.3.Market analysis, by country (revenue)
4.3.4.Market size and forecast, by region (volume)
4.3.5.Market analysis, by country (volume)
CHAPTER 5:BATTERY POWER TOOL MARKET, BY TOOL
5.1.Market overview
5.1.1.Market size and forecast, by tool (revenue)
5.1.2.Market size and forecast, by tool (volume)
5.2.Drills
5.2.1.Key market trends, growth factors, and opportunities
5.2.2.Market size and forecast, by region (revenue)
5.2.3.Market analysis, by country (revenue)
5.2.4.Market size and forecast, by region (volume)
5.2.5.Market analysis, by country (volume)
5.3.Saws
5.3.1.Key market trends, growth factors, and opportunities
5.3.2.Market size and forecast, by region (revenue)
5.3.3.Market analysis, by country (revenue)
5.3.4.Market size and forecast, by region (volume)
5.3.5.Market analysis, by country (volume)
5.4.Lawn mower
5.4.1.Key market trends, growth factors, and opportunities
5.4.2.Market size and forecast, by region (revenue)
5.4.3.Market analysis, by country (revenue)
5.4.4.Market size and forecast, by region (volume)
5.4.5.Market analysis, by country (volume)
5.5.Impact wrench
5.5.1.Key market trends, growth factors, and opportunities
5.5.2.Market size and forecast, by region (revenue)
5.5.3.Market analysis, by country (revenue)
5.5.4.Market size and forecast, by region (volume)
5.5.5.Market analysis, by country (volume)
5.6.Others
5.6.1.Key market trends, growth factors, and opportunities
5.6.2.Market size and forecast, by region (revenue)
5.6.3.Market analysis, by country (revenue)
5.6.4.Market size and forecast, by region (volume)
5.6.5.Market analysis, by country (volume)
CHAPTER 6:BATTERY POWER TOOL MARKET, BY APPLICATION
6.1.Market overview
6.1.1.Market size and forecast, by application (revenue)
6.1.2.Market size and forecast, by application (volume)
6.2.Industrial
6.2.1.Key market trends, growth factors, and opportunities
6.2.2.Market size and forecast, by region (revenue)
6.2.3.Market analysis, by country (revenue)
6.2.4.Market size and forecast, by region (volume)
6.2.5.Market analysis, by country (volume)
6.3.DIY
6.3.1.Key market trends, growth factors, and opportunities
6.3.2.Market size and forecast, by region (revenue)
6.3.3.Market analysis, by country (revenue)
6.3.4.Market size and forecast, by region (volume)
6.3.5.Market analysis, by country (volume)
CHAPTER 7:BATTERY POWER TOOL MARKET, BY REGION
7.1.Market overview
7.1.1.Market size and forecast, by region (revenue)
7.1.2.Market size and forecast, by region (volume)
7.2.North America
7.2.1.Key market trends, growth factors, and opportunities
7.2.2.Market size and forecast, by motor type (revenue)
7.2.3.Market size and forecast, by tool (revenue)
7.2.4.Market size and forecast, by application (revenue)
7.2.5.Market size and forecast, by country (revenue)
7.2.6.Market size and forecast, by motor type (volume)
7.2.7.Market size and forecast, by tool (volume)
7.2.8.Market size and forecast, by application (volume)
7.2.9.Market size and forecast, by country (volume)
7.2.9.1.U.S.
7.2.9.1.1.Market size and forecast, by motor type (revenue)
7.2.9.1.2.Market size and forecast, by tool (revenue)
7.2.9.1.3.Market size and forecast, by application (revenue)
7.2.9.1.4.Market size and forecast, by motor type (volume)
7.2.9.1.5.Market size and forecast, by tool (volume)
7.2.9.1.6.Market size and forecast, by application (volume)
7.2.9.2.Canada
7.2.9.2.1.Market size and forecast, by motor type (revenue)
7.2.9.2.2.Market size and forecast, by tool (revenue)
7.2.9.2.3.Market size and forecast, by application (revenue)
7.2.9.2.4.Market size and forecast, by motor type (volume)
7.2.9.2.5.Market size and forecast, by tool (volume)
7.2.9.2.6.Market size and forecast, by application (volume)
7.2.9.3.Mexico
7.2.9.3.1.Market size and forecast, by motor type (revenue)
7.2.9.3.2.Market size and forecast, by tool (revenue)
7.2.9.3.3.Market size and forecast, by application (revenue)
7.2.9.3.4.Market size and forecast, by motor type (volume)
7.2.9.3.5.Market size and forecast, by tool (volume)
7.2.9.3.6.Market size and forecast, by application (volume)
7.3.Europe
7.3.1.Key market trends, growth factors, and opportunities
7.3.2.Market size and forecast, by motor type (revenue)
7.3.3.Market size and forecast, by tool (revenue)
7.3.4.Market size and forecast, by application (revenue)
7.3.5.Market size and forecast, by country (revenue)
7.3.6.Market size and forecast, by motor type (volume)
7.3.7.Market size and forecast, by tool (volume)
7.3.8.Market size and forecast, by application (volume)
7.3.9.Market size and forecast, by country (volume)
7.3.9.1.Germany
7.3.9.1.1.Market size and forecast, by motor type (revenue)
7.3.9.1.2.Market size and forecast, by tool (revenue)
7.3.9.1.3.Market size and forecast, by application (revenue)
7.3.9.1.4.Market size and forecast, by motor type (volume)
7.3.9.1.5.Market size and forecast, by tool (volume)
7.3.9.1.6.Market size and forecast, by application (volume)
7.3.9.2.UK
7.3.9.2.1.Market size and forecast, by motor type (revenue)
7.3.9.2.2.Market size and forecast, by tool (revenue)
7.3.9.2.3.Market size and forecast, by application (revenue)
7.3.9.2.4.Market size and forecast, by motor type (volume)
7.3.9.2.5.Market size and forecast, by tool (volume)
7.3.9.2.6.Market size and forecast, by application (volume)
7.3.9.3.France
7.3.9.3.1.Market size and forecast, by motor type (revenue)
7.3.9.3.2.Market size and forecast, by tool (revenue)
7.3.9.3.3.Market size and forecast, by application (revenue)
7.3.9.3.4.Market size and forecast, by motor type (volume)
7.3.9.3.5.Market size and forecast, by tool (volume)
7.3.9.3.6.Market size and forecast, by application (volume)
7.3.9.4.Russia
7.3.9.4.1.Market size and forecast, by motor type (revenue)
7.3.9.4.2.Market size and forecast, by tool (revenue)
7.3.9.4.3.Market size and forecast, by application (revenue)
7.3.9.4.4.Market size and forecast, by motor type (volume)
7.3.9.4.5.Market size and forecast, by tool (volume)
7.3.9.4.6.Market size and forecast, by application (volume)
7.3.9.5.Rest of Europe
7.3.9.5.1.Market size and forecast, by motor type (revenue)
7.3.9.5.2.Market size and forecast, by tool (revenue)
7.3.9.5.3.Market size and forecast, by application (revenue)
7.3.9.5.4.Market size and forecast, by motor type (volume)
7.3.9.5.5.Market size and forecast, by tool (volume)
7.3.9.5.6.Market size and forecast, by application (volume)
7.4.Asia-Pacific
7.4.1.Key market trends, growth factors, and opportunities
7.4.2.Market size and forecast, by motor type (revenue)
7.4.3.Market size and forecast, by tool (revenue)
7.4.4.Market size and forecast, by application (revenue)
7.4.5.Market size and forecast, by country (revenue)
7.4.6.Market size and forecast, by motor type (volume)
7.4.7.Market size and forecast, by tool (volume)
7.4.8.Market size and forecast, by application (volume)
7.4.9.Market size and forecast, by country (volume)
7.4.9.1.China
7.4.9.1.1.Market size and forecast, by motor type (revenue)
7.4.9.1.2.Market size and forecast, by tool (revenue)
7.4.9.1.3.Market size and forecast, by application (revenue)
7.4.9.1.4.Market size and forecast, by motor type (volume)
7.4.9.1.5.Market size and forecast, by tool (volume)
7.4.9.1.6.Market size and forecast, by application (volume)
7.4.9.2.India
7.4.9.2.1.Market size and forecast, by motor type (revenue)
7.4.9.2.2.Market size and forecast, by tool (revenue)
7.4.9.2.3.Market size and forecast, by application (revenue)
7.4.9.2.4.Market size and forecast, by motor type (volume)
7.4.9.2.5.Market size and forecast, by tool (volume)
7.4.9.2.6.Market size and forecast, by application (volume)
7.4.9.3.Japan
7.4.9.3.1.Market size and forecast, by motor type (revenue)
7.4.9.3.2.Market size and forecast, by tool (revenue)
7.4.9.3.3.Market size and forecast, by application (revenue)
7.4.9.3.4.Market size and forecast, by motor type (volume)
7.4.9.3.5.Market size and forecast, by tool (volume)
7.4.9.3.6.Market size and forecast, by application (volume)
7.4.9.4.South Korea
7.4.9.4.1.Market size and forecast, by motor type (revenue)
7.4.9.4.2.Market size and forecast, by tool (revenue)
7.4.9.4.3.Market size and forecast, by application (revenue)
7.4.9.4.4.Market size and forecast, by motor type (volume)
7.4.9.4.5.Market size and forecast, by tool (volume)
7.4.9.4.6.Market size and forecast, by application (volume)
7.4.9.5.Rest of Asia-Pacific
7.4.9.5.1.Market size and forecast, by motor type (revenue)
7.4.9.5.2.Market size and forecast, by tool (revenue)
7.4.9.5.3.Market size and forecast, by application (revenue)
7.4.9.5.4.Market size and forecast, by motor type (volume)
7.4.9.5.5.Market size and forecast, by tool (volume)
7.4.9.5.6.Market size and forecast, by application (volume)
7.5.LAMEA
7.5.1.Key market trends, growth factors, and opportunities
7.5.2.Market size and forecast, by motor type (revenue)
7.5.3.Market size and forecast, by tool (revenue)
7.5.4.Market size and forecast, by application (revenue)
7.5.5.Market size and forecast, by country (revenue)
7.5.6.Market size and forecast, by motor type (volume)
7.5.7.Market size and forecast, by tool (volume)
7.5.8.Market size and forecast, by application (volume)
7.5.9.Market size and forecast, by country (volume)
7.5.9.1.Latin America
7.5.9.1.1.Market size and forecast, by motor type (revenue)
7.5.9.1.2.Market size and forecast, by tool (revenue)
7.5.9.1.3.Market size and forecast, by application (revenue)
7.5.9.1.4.Market size and forecast, by motor type (volume)
7.5.9.1.5.Market size and forecast, by tool (volume)
7.5.9.1.6.Market size and forecast, by application (volume)
7.5.9.2.Middle East
7.5.9.2.1.Market size and forecast, by motor type (revenue)
7.5.9.2.2.Market size and forecast, by tool (revenue)
7.5.9.2.3.Market size and forecast, by application (revenue)
7.5.9.2.4.Market size and forecast, by motor type (volume)
7.5.9.2.5.Market size and forecast, by tool (volume)
7.5.9.2.6.Market size and forecast, by application (volume)
7.5.9.3.Africa
7.5.9.3.1.Market size and forecast, by motor type (revenue)
7.5.9.3.2.Market size and forecast, by tool (revenue)
7.5.9.3.3.Market size and forecast, by application (revenue)
7.5.9.3.4.Market size and forecast, by motor type (volume)
7.5.9.3.5.Market size and forecast, by tool (volume)
7.5.9.3.6.Market size and forecast, by application (volume)
CHAPTER 8:COMPANY PROFILES
8.1.APEX TOOL GROUP
8.1.1.Company overview
8.1.2.Key executives
8.1.3.Company snapshot
8.1.4.Operating product category
8.1.5.Product portfolio
8.1.6.Key strategic moves and developments
8.2.ATLAS COPCO AB
8.2.1.Company overview
8.2.2.Key executives
8.2.3.Company snapshot
8.2.4.Operating business segments
8.2.5.Product portfolio
8.2.6.Research and development expenses
8.2.7.Business performance
8.3.HILTI CORPORATION
8.3.1.Company overview
8.3.2.Key executives
8.3.3.Company snapshot
8.3.4.Operating business segments
8.3.5.Product portfolio
8.3.6.Research and development expenses
8.3.7.Business performance
8.3.8.Key strategic moves and developments
8.4.INGERSOLL RAND INC.
8.4.1.Company overview
8.4.2.Key executives
8.4.3.Company snapshot
8.4.4.Operating business segments
8.4.5.Product portfolio
8.4.6.Research and development expenses
8.4.7.Business performance
8.4.8.Key strategic moves and developments
8.5.HITACHI, LTD.
8.5.1.Company overview
8.5.2.Key executives
8.5.3.Company snapshot
8.5.4.Operating business segments
8.5.5.Product portfolio
8.5.6.Research and development expenses
8.5.7.Business performance
8.6.MAKITA CORPORATION
8.6.1.Company overview
8.6.2.Key executives
8.6.3.Company snapshot
8.6.4.Operating business segments
8.6.5.Product portfolio
8.6.6.Research and development expenses
8.6.7.Business performance
8.6.8.Key strategic moves and developments
8.7.ROBERT BOSCH GmbH
8.7.1.Company overview
8.7.2.Key executives
8.7.3.Company snapshot
8.7.4.Operating business segments
8.7.5.Product portfolio
8.7.6.Research and development expenses
8.7.7.Business performance
8.7.8.Key strategic moves and developments
8.8.SNAP-ON INCORPORATED
8.8.1.Company overview
8.8.2.Key executives
8.8.3.Company snapshot
8.8.4.Operating business segments
8.8.5.Product portfolio
8.8.6.R&D Expenditure
8.8.7.Business performance
8.8.8.Key strategic moves and developments
8.9.STANLEY BLACK & DECKER, INC.
8.9.1.Company overview
8.9.2.Key executives
8.9.3.Company snapshot
8.9.4.Operating business segments
8.9.5.Product portfolio
8.9.6.R&D Expenditure
8.9.7.Business performance
8.9.8.Key strategic moves and developments
8.10.TECHTRONIC INDUSTRIES CO. LTD.
8.10.1.Company overview
8.10.2.Key executives
8.10.3.Company snapshot
8.10.4.Operating business segments
8.10.5.Product portfolio
8.10.6.Research and development expenses
8.10.7.Business performance
8.10.8.Key strategic moves and developments
Table 01.Volume Analysis Of Companies For Corded, 2020 (Thousand Unit)
Table 02.Volume Analysis Of Companies For Battery Powered, 2020 (Thousand Unit)
Table 03.Volume Analysis Of Companies, By Motor Type For Brushed Motor, 2020 (Thousand Unit)
Table 04.Volume Analysis Of Companies, By Motor Type For Brushless Motor, 2020 (Thousand Unit)
Table 05.Volume Analysis Of Companies, By Tools For Drills, 2020 (Thousand Unit)
Table 06.Volume Analysis Of Companies, By Tools For Saws, 2020 (Thousand Unit)
Table 07.Volume Analysis Of Companies, By Tools For Lawn Mower, 2020 (Thousand Unit)
Table 08.Volume Analysis Of Companies, By Tools For Impact Wrench, 2020 (Thousand Unit)
Table 09.Volume Analysis Of Companies, By Tools For Others, 2020 (Thousand Unit)
Table 10.Volume Analysis Of Companies, By Region For North America, 2020 (Thousand Unit)
Table 11.Volume Analysis Of Companies, By Region For Europe, 2020 (Thousand Unit)
Table 12.Volume Analysis Of Companies, By Region For Asia-Pacific, 2020 (Thousand Unit)
Table 13.Volume Analysis Of Companies, By Region For Lamea, 2020 (Thousand Unit)
Table 14.Battery Power Tool Market Revenue, By Motor Type, 2020-2030 ($Million)
Table 15.Battery Power Tool Market Revenue, By Motor Type, 2020-2030 (Thousand Units)
Table 16.Battery Power Tool Market Revenue For Brushed Motor, By Region, 2020-2030 ($Million)
Table 17.Battery Power Tool Market Revenue For Brushed Motor, By Region, 2020-2030 (Thousand Units)
Table 18.Battery Power Tool Market Revenue For Brushless Motor, By Region, 2020-2030 ($Million)
Table 19.Battery Power Tool Market Revenue For Brushless Motor, By Region, 2020-2030 (Thousand Units)
Table 20.Battery Power Tool Market Revenue, By Tool, 2020-2030 ($Million)
Table 21.Battery Power Tool Market Revenue, By Tool, 2020-2030 (Thousand Units)
Table 22.Battery Power Tool Market Revenue For Drills, By Region, 2020-2030 ($Million)
Table 23.Battery Power Tool Market Revenue For Drills, By Region, 2020-2030 (Thousand Units)
Table 24.Battery Power Tool Market Revenue For Saws, By Region, 2020-2030 ($Million)
Table 25.Battery Power Tool Market Revenue For Saws, By Region, 2020-2030 (Thousand Units)
Table 26.Battery Power Tool Market Revenue For Lawn Mower, By Region, 2020-2030 ($Million)
Table 27.Battery Power Tool Market Revenue For Lawn Mower, By Region, 2020-2030 (Thousand Units)
Table 28.Battery Power Tool Market Revenue For Impact Wrench, By Region, 2020-2030 ($Million)
Table 29.Battery Power Tool Market Revenue For Impact Wrench, By Region, 2020-2030 (Thousand Units)
Table 30.Battery Power Tool Market Revenue For Others, By Region, 2020-2030 ($Million)
Table 31.Battery Power Tool Market Revenue For Others, By Region, 2020-2030 (Thousand Units)
Table 32.Battery Power Tool Market Revenue, By Application, 2020-2030 ($Million)
Table 33.Battery Power Tool Market Revenue, By Application, 2020-2030 (Thousand Units)
Table 34.Battery Power Tool Market Revenue For Industrial, By Region, 2020-2030 ($Million)
Table 35.Battery Power Tool Market Revenue For Industrial, By Region, 2020-2030 (Thousand Units)
Table 36.Battery Power Tool Market Revenue For Diy, By Region, 2020-2030 ($Million)
Table 37.Battery Power Tool Market Revenue For Diy, By Region, 2020-2030 (Thousand Units)
Table 38.Battery Power Tool Market, By Region, 2020-2030 ($Million)
Table 39.Battery Power Tool Market, By Region, 2020-2030 (Thousand Units)
Table 40.North America Battery Power Tool Market, By Motor Type, 2020-2030 ($Million)
Table 41.North America Battery Power Tool Market, By Tool, 2020-2030 ($Million)
Table 42.North America Battery Power Tool Market, By Application, 2020-2030 ($Million)
Table 43.North America Battery Power Tool Market, By Country, 2020-2030 ($Million)
Table 44.North America Battery Power Tool Market, By Motor Type, 2020-2030 (Thousand Units)
Table 45.North America Battery Power Tool Market, By Tool, 2020-2030 (Thousand Units)
Table 46.North America Battery Power Tool Market, By Application, 2020-2030 (Thousand Units)
Table 47.North America Battery Power Tool Market, By Country, 2020-2030 (Thousand Units)
Table 48.U.S. Battery Power Tool Market, By Motor Type, 2020-2030 ($Million)
Table 49.U.S. Battery Power Tool Market, By Tool, 2020-2030 ($Million)
Table 50.U.S. Battery Power Tool Market, By Application, 2020-2030 ($Million)
Table 51.U.S. Battery Power Tool Market, By Motor Type, 2020-2030 (Thousand Units)
Table 52.U.S. Battery Power Tool Market, By Tool, 2020-2030 (Thousand Units)
Table 53.U.S. Battery Power Tool Market, By Application, 2020-2030 (Thousand Units)
Table 54.Canada Battery Power Tool Market, By Motor Type, 2020-2030 ($Million)
Table 55.Canada Battery Power Tool Market, By Tool, 2020-2030 ($Million)
Table 56.Canada Battery Power Tool Market, By Application, 2020-2030 ($Million)
Table 57.Canada Battery Power Tool Market, By Motor Type, 2020-2030 (Thousand Units)
Table 58.Canada Battery Power Tool Market, By Tool, 2020-2030 (Thousand Units)
Table 59.Canada Battery Power Tool Market, By Application, 2020-2030 (Thousand Units)
Table 60.Mexico Battery Power Tool Market, By Motor Type, 2020-2030 ($Million)
Table 61.Mexico Battery Power Tool Market, By Tool, 2020-2030 ($Million)
Table 62.Mexico Battery Power Tool Market, By Application, 2020-2030 ($Million)
Table 63.Mexico Battery Power Tool Market, By Motor Type, 2020-2030 (Thousand Units)
Table 64.Mexico Battery Power Tool Market, By Tool, 2020-2030 (Thousand Units)
Table 65.Mexico Battery Power Tool Market, By Application, 2020-2030 (Thousand Units)
Table 66.Europe Battery Power Tool Market, By Motor Type, 2020-2030 ($Million)
Table 67.Europe Battery Power Tool Market, By Tool, 2020-2030 ($Million)
Table 68.Europe Battery Power Tool Market, By Application, 2020-2030 ($Million)
Table 69.Europe Battery Power Tool Market, By Country, 2020-2030 ($Million)
Table 70.Europe Battery Power Tool Market, By Motor Type, 2020-2030 (Thousand Units)
Table 71.Europe Battery Power Tool Market, By Tool, 2020-2030 (Thousand Units)
Table 72.Europe Battery Power Tool Market, By Application, 2020-2030 (Thousand Units)
Table 73.Europe Battery Power Tool Market, By Country, 2020-2030 (Thousand Units)
Table 74.Germany Battery Power Tool Market, By Motor Type, 2020-2030 ($Million)
Table 75.Germany Battery Power Tool Market, By Tool, 2020-2030 ($Million)
Table 76.Germany Battery Power Tool Market, By Application, 2020-2030 ($Million)
Table 77.Germany Battery Power Tool Market, By Motor Type, 2020-2030 (Thousand Units)
Table 78.Germany Battery Power Tool Market, By Tool, 2020-2030 (Thousand Units)
Table 79.Germany Battery Power Tool Market, By Application, 2020-2030 (Thousand Units)
Table 80.Uk Battery Power Tool Market, By Motor Type, 2020-2030 ($Million)
Table 81.Uk Battery Power Tool Market, By Tool, 2020-2030 ($Million)
Table 82.Uk Battery Power Tool Market, By Application, 2020-2030 ($Million)
Table 83.Uk Battery Power Tool Market, By Motor Type, 2020-2030 (Thousand Units)
Table 84.Uk Battery Power Tool Market, By Tool, 2020-2030 (Thousand Units)
Table 85.Uk Battery Power Tool Market, By Application, 2020-2030 (Thousand Units)
Table 86.France Battery Power Tool Market, By Motor Type, 2020-2030 ($Million)
Table 87.France Battery Power Tool Market, By Tool, 2020-2030 ($Million)
Table 88.France Battery Power Tool Market, By Application, 2020-2030 ($Million)
Table 89.France Battery Power Tool Market, By Motor Type, 2020-2030 (Thousand Units)
Table 90.France Battery Power Tool Market, By Tool, 2020-2030 (Thousand Units)
Table 91.France Battery Power Tool Market, By Application, 2020-2030 (Thousand Units)
Table 92.Russia Battery Power Tool Market, By Motor Type, 2020-2030 ($Million)
Table 93.Russia Battery Power Tool Market, By Tool, 2020-2030 ($Million)
Table 94.Russia Battery Power Tool Market, By Application, 2020-2030 ($Million)
Table 95.Russia Battery Power Tool Market, By Motor Type, 2020-2030 (Thousand Units)
Table 96.Russia Battery Power Tool Market, By Tool, 2020-2030 (Thousand Units)
Table 97.Russia Battery Power Tool Market, By Application, 2020-2030 (Thousand Units)
Table 98.Rest Of Europe Battery Power Tool Market, By Motor Type, 2020-2030 ($Million)
Table 99.Rest Of Europe Battery Power Tool Market, By Tool, 2020-2030 ($Million)
Table 100.Rest Of Europe Battery Power Tool Market, By Application, 2020-2030 ($Million)
Table 101.Rest Of Europe Battery Power Tool Market, By Motor Type, 2020-2030 (Thousand Units)
Table 102.Rest Of Europe Battery Power Tool Market, By Tool, 2020-2030 (Thousand Units)
Table 103.Rest Of Europe Battery Power Tool Market, By Application, 2020-2030 (Thousand Units)
Table 104.Asia-Pacific Battery Power Tool Market, By Motor Type, 2020-2030 ($Million)
Table 105.Asia-Pacific Battery Power Tool Market, By Tool, 2020-2030 ($Million)
Table 106.Asia-Pacific Battery Power Tool Market, By Application, 2020-2030 ($Million)
Table 107.Asia-Pacific Battery Power Tool Market, By Country, 2020-2030 ($Million)
Table 108.Asia-Pacific Battery Power Tool Market, By Motor Type, 2020-2030 (Thousand Units)
Table 109.Asia-Pacific Battery Power Tool Market, By Tool, 2020-2030 (Thousand Units)
Table 110.Asia-Pacific Battery Power Tool Market, By Application, 2020-2030 (Thousand Units)
Table 111.Asia-Pacific Battery Power Tool Market, By Country, 2020-2030 (Thousand Units)
Table 112.China Battery Power Tool Market, By Motor Type, 2020-2030 ($Million)
Table 113.China Battery Power Tool Market, By Tool, 2020-2030 ($Million)
Table 114.China Battery Power Tool Market, By Application, 2020-2030 ($Million)
Table 115.China Battery Power Tool Market, By Motor Type, 2020-2030 (Thousand Units)
Table 116.China Battery Power Tool Market, By Tool, 2020-2030 (Thousand Units)
Table 117.China Battery Power Tool Market, By Application, 2020-2030 (Thousand Units)
Table 118.India Battery Power Tool Market, By Motor Type, 2020-2030 ($Million)
Table 119.India Battery Power Tool Market, By Tool, 2020-2030 ($Million)
Table 120.India Battery Power Tool Market, By Application, 2020-2030 ($Million)
Table 121.India Battery Power Tool Market, By Motor Type, 2020-2030 (Thousand Units)
Table 122.India Battery Power Tool Market, By Tool, 2020-2030 (Thousand Units)
Table 123.India Battery Power Tool Market, By Application, 2020-2030 (Thousand Units)
Table 124.Japan Battery Power Tool Market, By Motor Type, 2020-2030 ($Million)
Table 125.Japan Battery Power Tool Market, By Tool, 2020-2030 ($Million)
Table 126.Japan Battery Power Tool Market, By Application, 2020-2030 ($Million)
Table 127.Japan Battery Power Tool Market, By Motor Type, 2020-2030 (Thousand Units)
Table 128.Japan Battery Power Tool Market, By Tool, 2020-2030 (Thousand Units)
Table 129.Japan Battery Power Tool Market, By Application, 2020-2030 (Thousand Units)
Table 130.South Korea Battery Power Tool Market, By Motor Type, 2020-2030 ($Million)
Table 131.South Korea Battery Power Tool Market, By Tool, 2020-2030 ($Million)
Table 132.South Korea Battery Power Tool Market, By Application, 2020-2030 ($Million)
Table 133.South Korea Battery Power Tool Market, By Motor Type, 2020-2030 (Thousand Units)
Table 134.South Korea Battery Power Tool Market, By Tool, 2020-2030 (Thousand Units)
Table 135.South Korea Battery Power Tool Market, By Application, 2020-2030 (Thousand Units)
Table 136.Rest Of Asia-Pacific Battery Power Tool Market, By Motor Type, 2020-2030 ($Million)
Table 137.Rest Of Asia-Pacific Battery Power Tool Market, By Tool, 2020-2030 ($Million)
Table 138.Rest Of Asia-Pacific Battery Power Tool Market, By Application, 2020-2030 ($Million)
Table 139.Rest Of Asia-Pacific Battery Power Tool Market, By Motor Type, 2020-2030 (Thousand Units)
Table 140.Rest Of Asia-Pacific Battery Power Tool Market, By Tool, 2020-2030 (Thousand Units)
Table 141.Rest Of Asia-Pacific Battery Power Tool Market, By Application, 2020-2030 (Thousand Units)
Table 142.Lamea Battery Power Tool Market, By Motor Type, 2020-2030 ($Million)
Table 143.Lamea Battery Power Tool Market, By Tool, 2020-2030 ($Million)
Table 144.Lamea Battery Power Tool Market, By Application, 2020-2030 ($Million)
Table 145.Lamea Battery Power Tool Market, By Country, 2020-2030 ($Million)
Table 146.Lamea Battery Power Tool Market, By Motor Type, 2020-2030 (Thousand Units)
Table 147.Lamea Battery Power Tool Market, By Tool, 2020-2030 (Thousand Units)
Table 148.Lamea Battery Power Tool Market, By Application, 2020-2030 (Thousand Units)
Table 149.Lamea Battery Power Tool Market, By Country, 2020-2030 (Thousand Units)
Table 150.Latin America Battery Power Tool Market, By Motor Type, 2020-2030 ($Million)
Table 151.Latin America Battery Power Tool Market, By Tool, 2020-2030 ($Million)
Table 152.Latin America Battery Power Tool Market, By Application, 2020-2030 ($Million)
Table 153.Latin America Battery Power Tool Market, By Motor Type, 2020-2030 (Thousand Units)
Table 154.Latin America Battery Power Tool Market, By Tool, 2020-2030 (Thousand Units)
Table 155.Latin America Battery Power Tool Market, By Application, 2020-2030 (Thousand Units)
Table 156.Middle East Battery Power Tool Market, By Motor Type, 2020-2030 ($Million)
Table 157.Middle East Battery Power Tool Market, By Tool, 2020-2030 ($Million)
Table 158.Middle East Battery Power Tool Market, By Application, 2020-2030 ($Million)
Table 159.Middle East Battery Power Tool Market, By Motor Type, 2020-2030 (Thousand Units)
Table 160.Middle East Battery Power Tool Market, By Tool, 2020-2030 (Thousand Units)
Table 161.Middle East Battery Power Tool Market, By Application, 2020-2030 (Thousand Units)
Table 162.Africa Battery Power Tool Market, By Motor Type, 2020-2030 ($Million)
Table 163.Africa Battery Power Tool Market, By Tool, 2020-2030 ($Million)
Table 164.Africa Battery Power Tool Market, By Application, 2020-2030 ($Million)
Table 165.Africa Battery Power Tool Market, By Motor Type, 2020-2030 (Thousand Units)
Table 166.Africa Battery Power Tool Market, By Tool, 2020-2030 (Thousand Units)
Table 167.Africa Battery Power Tool Market, By Application, 2020-2030 (Thousand Units)
Table 168.Apex Tool Group: Key Executives
Table 169.Apex Tool Group: Company Snapshot
Table 170.Apex Tool Group: Product Category
Table 171.Apex Tool Group: Product Portfolio
Table 172.Atlas Copco Ab: Key Executives
Table 173.Atlas Copco Ab: Company Snapshot
Table 174.Atlas Copco Ab: Operating Segments
Table 175.Atlas Copco Ab: Product Portfolio
Table 176.Hilti Corporation: Key Executives
Table 177.Hilti Corporation: Company Snapshot
Table 178.Hilti Corporation: Operating Segments
Table 179.Hilti Corporation: Product Portfolio
Table 180.Ingersoll Rand Inc.: Key Executives
Table 181.Ingersoll Rand Inc.: Company Snapshot
Table 182.Ingersoll Rand Inc.: Operating Segments
Table 183.Ingersoll Rand Inc: Product Portfolio
Table 184.Hitachi, Ltd.: Key Executives
Table 185.Hitachi, Ltd.: Company Snapshot
Table 186.Hitachi, Ltd.: Operating Segments
Table 187.Hitachi, Ltd.: Product Portfolio
Table 188.Makita Corporation: Key Executives
Table 189.Makita Corporation: Company Snapshot
Table 190.Makita Corporation: Operating Segments
Table 191.Makita Corporation: Product Portfolio
Table 192.Robert Bosch Gmbh: Key Executives
Table 193.Robert Bosch Gmbh: Company Snapshot
Table 194.Robert Bosch Gmbh: Operating Segments
Table 195.Robert Bosch Gmbh: Product Portfolio
Table 196.Snap-On Incorporated: Key Executives
Table 197.Snap-On Incorporated: Company Snapshot
Table 198.Snap-On Incorporated: Operating Segments
Table 199.Snap-On Incorporated: Product Portfolio
Table 200.Stanley Black & Decker, Inc.: Key Executives
Table 201.Stanley Black & Decker, Inc.: Company Snapshot
Table 202.Stanley Black & Decker, Inc.: Operating Segments
Table 203.Stanley Black & Decker, Inc: Product Portfolio
Table 204.Techtronic Industries Co. Ltd: Key Executives
Table 205.Techtronic Industries Co. Ltd: Company Snapshot
Table 206.Techtronic Industries Co. Ltd.: Operating Segments
Table 207.Techtronic Industries Co. Ltd: Product Portfolio
List Of Figures
Figure 01.Key Market Segments
Figure 02.Battery Power Tools Market Snapshot, 2020–2030 (Revenue)
Figure 03.Battery Power Tools Market Snapshot, By Country, 2020–2030 (Revenue)
Figure 04.Battery Power Tools Market Snapshot, 2020–2030 (Volume)
Figure 05.Battery Power Tools Market Snapshot, By Country, 2020–2030 (Volume)
Figure 06.Global Mining Drill Bitsmarket: Key Players
Figure 07.Top Investment Pockets
Figure 08.Top Winning Strategies, By Year, 2019–2021
Figure 09.Top Winning Strategies, By Development, 2019–2021 (%)
Figure 10.Top Winning Strategies, By Company, 2019–2021 (%)
Figure 11.Moderate Bargaining Power Of Suppliers
Figure 12.Low To Moderate Bargaining Power Of Buyers
Figure 13.Moderate To High Threat Of Substitutes
Figure 14.Moderate Threat Of New Entrants
Figure 15.Moderate Intensity Of Rivalry
Figure 16.Market Dynamics
Figure 17.Electric Power Tools Market, By Revenue, By Type 2020–2030 (%)
Figure 18.Global Battery Power Tool Market, By Motor Type, 2020-2030 (Revenue)
Figure 19.Global Battery Power Tool Market, By Motor Type, 2020-2030 (Volume)
Figure 20.Comparative Share Analysis Of Battery Power Tool Market For Brushed Motor, By Country, 2020 & 2030 (%, Revenue)
Figure 21.Comparative Share Analysis Of Battery Power Tool Market For Brushed Motor, By Country, 2020 & 2030 (%, Volume)
Figure 22.Comparative Share Analysis Of Battery Power Tool Market For Brushless Motor, By Country, 2020 & 2030 (%, Revenue)
Figure 23.Comparative Share Analysis Of Battery Power Tool Market For Brushless Motor, By Country, 2020 & 2030 (%, Volume)
Figure 24.Global Battery Power Tool Market, By Tool, 2020-2030 (Revenue)
Figure 25.Global Battery Power Tool Market, By Tool, 2020-2030 (Volume)
Figure 26.Comparative Share Analysis Of Battery Power Tool Market For Drills, By Country, 2020 & 2030 (%, Revenue)
Figure 27.Comparative Share Analysis Of Battery Power Tool Market For Drills, By Country, 2020 & 2030 (%, Volume)
Figure 28.Comparative Share Analysis Of Battery Power Tool Market For Saws, By Country, 2020 & 2030 (%, Revenue)
Figure 29.Comparative Share Analysis Of Battery Power Tool Market For Saws, By Country, 2020 & 2030 (%, Volume)
Figure 30.Comparative Share Analysis Of Battery Power Tool Market For Lawn Mower, By Country, 2020 & 2030 (%, Revenue)
Figure 31.Comparative Share Analysis Of Battery Power Tool Market For Lawn Mower, By Country, 2020 & 2030 (%, Volume)
Figure 32.Comparative Share Analysis Of Battery Power Tool Market For Impact Wrench, By Country, 2020 & 2030 (%, Revenue)
Figure 33.Comparative Share Analysis Of Battery Power Tool Market For Impact Wrench, By Country, 2020 & 2030 (%, Volume)
Figure 34.Comparative Share Analysis Of Battery Power Tool Market For Others, By Country, 2020 & 2030 (%, Revenue)
Figure 35.Comparative Share Analysis Of Battery Power Tool Market For Others, By Country, 2020 & 2030 (%, Volume)
Figure 36.Global Battery Power Tool Market, By Application, 2020-2030 (Revenue)
Figure 37.Global Battery Power Tool Market, By Application, 2020-2030 (Volume)
Figure 38.Comparative Share Analysis Of Battery Power Tool Market For Industrial, By Country, 2020 & 2030 (%, Revenue)
Figure 39.Comparative Share Analysis Of Battery Power Tool Market For Industrial, By Country, 2020 & 2030 (%, Volume)
Figure 40.Comparative Share Analysis Of Battery Power Tool Market For Diy, By Country, 2020 & 2030 (%, Revenue)
Figure 41.Comparative Share Analysis Of Battery Power Tool Market For Diy, By Country, 2020 & 2030 (%, Volume)
Figure 42.Battery Power Tool Market, By Region, 2020-2030 (Revenue)
Figure 43.Battery Power Tool Market, By Region, 2020-2030 (Volume)
Figure 44.U.S. Battery Power Tool Market Revenue, 2020-2030 ($Million)
Figure 45.U.S. Battery Power Tool Market Volume, 2020-2030 (Thousand Units)
Figure 46.Canada Battery Power Tool Market Revenue, 2020-2030 ($Million)
Figure 47.Canada Battery Power Tool Market Volume, 2020-2030 (Thousand Units)
Figure 48.Mexico Battery Power Tool Market Revenue, 2020-2030 ($Million)
Figure 49.Mexico Battery Power Tool Market Volume, 2020-2030 (Thousand Units)
Figure 50.Germany Battery Power Tool Market Revenue, 2020-2030 ($Million)
Figure 51.Germany Battery Power Tool Market Volume, 2020-2030 (Thousand Units)
Figure 52.Uk Battery Power Tool Market Revenue, 2020-2030 ($Million)
Figure 53.Uk Battery Power Tool Market Volume, 2020-2030 (Thousand Units)
Figure 54.France Battery Power Tool Market Revenue, 2020-2030 ($Million)
Figure 55.France Battery Power Tool Market Volume, 2020-2030 (Thousand Units)
Figure 56.Russia Battery Power Tool Market Revenue, 2020-2030 ($Million)
Figure 57.Russia Battery Power Tool Market Volume, 2020-2030 (Thousand Units)
Figure 58.Rest Of Europe Battery Power Tool Market Revenue, 2020-2030 ($Million)
Figure 59.Rest Of Europe Battery Power Tool Market Volume, 2020-2030 (Thousand Units)
Figure 60.China Battery Power Tool Market Revenue, 2020-2030 ($Million)
Figure 61.China Battery Power Tool Market Volume, 2020-2030 (Thousand Units)
Figure 62.India Battery Power Tool Market Revenue, 2020-2030 ($Million)
Figure 63.India Battery Power Tool Market Volume, 2020-2030 (Thousand Units)
Figure 64.Japan Battery Power Tool Market Revenue, 2020-2030 ($Million)
Figure 65.Japan Battery Power Tool Market Volume, 2020-2030 (Thousand Units)
Figure 66.South Korea Battery Power Tool Market Revenue, 2020-2030 ($Million)
Figure 67.South Korea Battery Power Tool Market Volume, 2020-2030 (Thousand Units)
Figure 68.Rest Of Asia-Pacific Battery Power Tool Market Revenue, 2020-2030 ($Million)
Figure 69.Rest Of Asia-Pacific Battery Power Tool Market Volume, 2020-2030 (Thousand Units)
Figure 70.Latin America Battery Power Tool Market Revenue, 2020-2030 ($Million)
Figure 71.Latin America Battery Power Tool Market Volume, 2020-2030 (Thousand Units)
Figure 72.Middle East Battery Power Tool Market Revenue, 2020-2030 ($Million)
Figure 73.Middle East Battery Power Tool Market Volume, 2020-2030 (Thousand Units)
Figure 74.Africa Battery Power Tool Market Revenue, 2020-2030 ($Million)
Figure 75.Africa Battery Power Tool Market Volume, 2020-2030 (Thousand Units)
Figure 76.Atlas Copco Ab: R&D Expenses, 2018–2020 ($Million)
Figure 77.Atlas Copco Ab: Revenue, 2018–2020 ($Million)
Figure 78.Atlas Copco Ab: Revenue Share By Segment, 2020 (%)
Figure 79.Atlas Copco Ab: Revenue Share By Region, 2020 (%)
Figure 80.Hilti Corporation: R&D Expenses, 2018–2020 ($Million)
Figure 81.Hilti Corporation: Revenue, 2018–2020 ($Million)
Figure 82.Hilti Corporation: Revenue Share By Segment, 2020 (%)
Figure 83.Hilti Corporation: Revenue Share By Region, 2020 (%)
Figure 84.Ingersoll Rand Inc: R&D Expenses, 2018–2020 ($Million)
Figure 85.Ingersoll Rand Inc: Revenue, 2018–2020 ($Million)
Figure 86.Ingersoll Rand Inc: Revenue Share By Segment, 2020 (%)
Figure 87.Ingersoll Rand Inc: Revenue Share By Region, 2020 (%)
Figure 88.Hitachi, Ltd.: R&D Expenses, 2018–2020 ($Million)
Figure 89.Hitachi, Ltd.: Revenue, 2018–2020 ($Million)
Figure 90.Hitachi, Ltd.: Revenue Share By Segment, 2020 (%)
Figure 91.Hitachi, Ltd.: Revenue Share By Region, 2020 (%)
Figure 92.Makita Corporation: R&D Expenses, 2018–2020 ($Million)
Figure 93.Makita Corporation: Revenue, 2018–2020 ($Million)
Figure 94.Makita Corporation: Revenue Share By Segment, 2020 (%)
Figure 95.Makita Corporation: Revenue Share By Region, 2020 (%)
Figure 96.Robert Bosch Gmbh: R&D Expenses, 2018–2020 ($Million)
Figure 97.Robert Bosch Gmbh: Revenue, 2018–2020 ($Million)
Figure 98.Robert Bosch Gmbh: Revenue Share By Segment, 2020 (%)
Figure 99.Robert Bosch Gmbh: Revenue Share By Region, 2020 (%)
Figure 100.Snap-On Incorporated: R&D Expenditure, 2018–2020 ($Millions)
Figure 101.Snap-On Incorporated: Net Sales, 2018–2020 ($Million)
Figure 102.Snap-On Incorporated: Revenue Share By Segment, 2020 (%)
Figure 103.Snap-On Incorporated: Revenue Share By Region, 2020 (%)
Figure 104.Stanley Black & Decker, Inc.: R&D Expenditure, 2018–2020 ($Millions)
Figure 105.Stanley Black & Decker, Inc.: Net Sales, 2018–2020 ($Million)
Figure 106.Stanley Black & Decker, Inc.: Revenue Share By Segment, 2020 (%)
Figure 107.Stanley Black & Decker, Inc.: Revenue Share By Region, 2020 (%)
Figure 108.Techtronic Industries Co. Ltd: R&D Expenses, 2018–2020 ($Million)
Figure 109.Techtronic Industries Co. Ltd.: Revenue, 2018–2020 ($Million)
Figure 110.Techtronic Industries Co. Ltd.: Revenue Share By Segment, 2020 (%)
Figure 111.Techtronic Industries Co. Ltd.: Revenue Share By Region, 2020 (%)
$8648
$14817
HAVE A QUERY?
OUR CUSTOMER
