
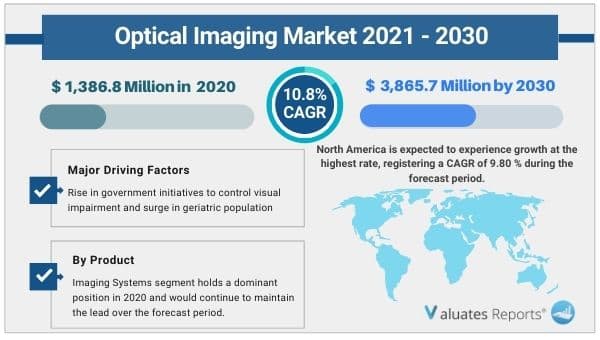
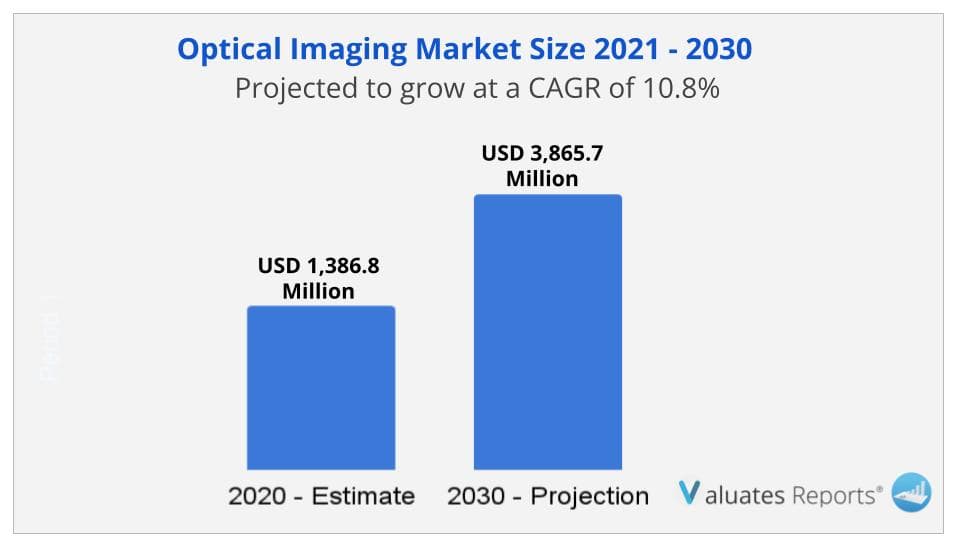
Global optical imaging market was valued at USD 1,386.8 Million in 2020, and is projected to reach USD 3,865.7 Million by 2030 registering a CAGR of 10.8% from 2021 to 2030. Key drivers of the optical imaging market growth include the surge in the geriatric population and the rising prevalence of neurological disorders, cardiovascular conditions, and eye disorders such as glaucoma, cataract, etc. Other factors contributing to the rise in growth of the market are increasing research and development activities in the life sciences sector and more usage of optical imaging techniques for drug discovery processes and preclinical research. Increasing demand for optical imaging techniques in Point Of Care(POC) diagnostics is also fueling the growth of the market.
Optical imaging is a technique for taking images of internal body parts non-invasively. Visible light and photons are used to take detailed images of the internal organs and tissues. It also captures smaller structures including cells and molecules. Optical imaging is used by doctors for the diagnosis and treatment of diseases and by scientists for research purposes.
Increasing eye disorders as a result of the rising geriatric population are driving the growth of the market. Widespread usage of optical imaging technologies for diagnostic purposes in ophthalmology practices is accelerating the growth of the market. Rising eye disorders and the growing geriatric population globally is also driving the growth of the optical imag
The rise in innovations and widespread adoption of optical imaging technologies in POC diagnostics will provide lucrative opportunities for growth.
Optical imaging provides a host of advantages for point of care diagnostics as the process becomes faster, cost-efficient and early detection enable accurate diagnosis of diseases. Recent advances such as optoelectronics, optical fibers, and micro-optics, etc are cost-effective and provide lucrative opportunities for the growth of the optical imaging market during the forecast period.
Increasing R&D initiatives and widespread application will further accelerate the growth of the market.
An increase in technological advances and rising demand for minimizing radiation-based technologies, increasing awareness of the harmful effects of radiation-based imaging, etc will further propel the growth of the optical imaging market during the forecast period. Widespread application of optical imaging technologies will also expand the growth of the market in the coming years.
Rising market penetration in emerging economies and growing research in the biotechnology and pharmaceutical sector will propel the growth of the market.
An increase in the application of Optical imaging technologies and growing market penetration in emerging economies will give a huge boost to the growth of the market. Rising research in the life sciences sector and mass application of optical imaging in drug discovery processes, preclinical research, and rising demand in the biotechnology and pharmaceutical market will significantly increase the growth of the optical imaging market during the forecast period.
Based on region, North America is expected to hold the largest optical imaging market share during the forecast period due to the presence of key market players in the region and the easy availability of optical imaging systems thereby driving the growth of the market.
Based on product type, the imaging system is expected to hold the largest optical imaging market share during the forecast period due to its non-invasive nature and other benefits such as reducing harmful radiation exposure for patients, etc. Further rising investments and mass availability of imaging systems will further drive the growth of the optical imaging systems segment during the forecast period.
Based on the therapeutic area, the Ophthalmology segment is expected to hold the largest optical imaging market share during the forecast period due to the rising usage of optical imaging in Ophthalmology and increasing cases of ophthalmic conditions such as muscular degeneration and glaucoma.
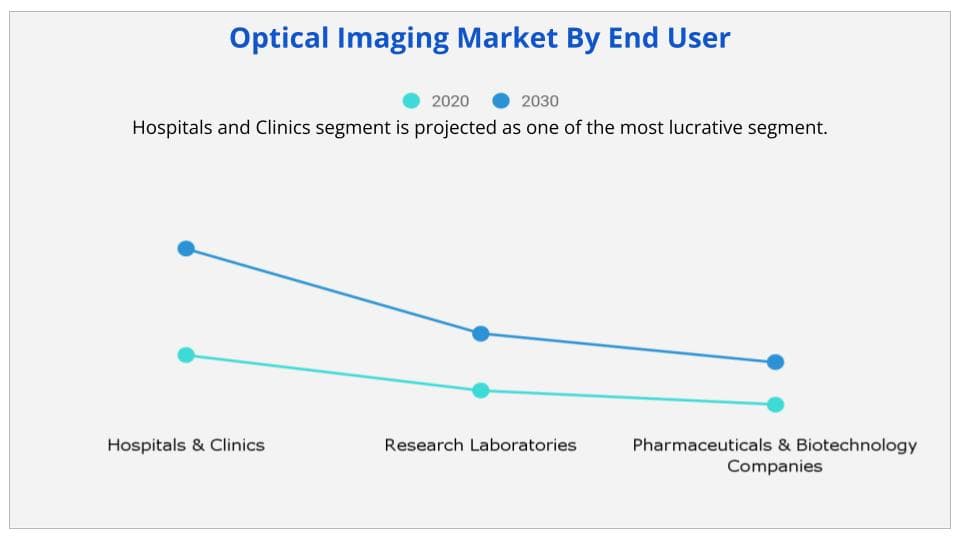
Based on end-user, the hospitals and clinic segment is expected to hold the largest optical imaging market share during the forecast period due to the increasing adoption of optical imaging services by hospitals and clinics for the diagnosis of various diseases.
|
Report Metric |
Details |
|
Report Name |
Optical Imaging Market |
|
Market size value in 2020 |
USD 1,386.8 Million |
|
Revenue forecast in 2027 |
USD 3,865.7 Million |
|
Growth Rate |
CAGR 10.8% |
|
Base year considered |
2020 |
|
Forecast Period |
2021-2030 |
|
By Type |
Imaging Systems, Illumination Systems, Camera, Software, and Lenses |
|
By Therapeutic Area |
Ophthalmology, Oncology, Cardiology, Neurology |
|
By End User |
Hospitals & Clinics, Research Laboratories, and Pharmaceuticals & Biotechnology Companies |
|
Report Coverage |
Revenue & volume forecast, company share, competitive landscape, growth factors, and trends |
|
Geographic regions covered |
North America, Europe, Asia Pacific, Latin America, Middle East & Africa |
Ans. Global optical imaging market was valued at $1,386.8 million in 2020, and is projected to reach $3,865.7 million by 2030 registering a CAGR of 10.8% from 2021 to 2030.
Ans. The key market players profiled in the report include Abbott Laboratories, Canon Inc., Carl Zeiss Foundation, Cylite Pty Ltd., Danaher Corporation, Heildelberg Engineering GmbH, Koninklijke Philips N.V., Michelson Diagnostics Ltd., Optovue, Ltd., and Topcon Corporation.
Ans. Yes, the report includes a COVID-19 impact analysis. Also, it is further extended into every individual segment of the report.
Ans. North America is expected to experience growth at the highest rate, registering a CAGR of 9.80 % during the forecast period.
CHAPTER 1:INTRODUCTION
1.1.Report description
1.2.Key benefits for stakeholders
1.3.Key market segments
1.3.1.List of key players profiled in the report
1.4.Research methodology
1.4.1.Secondary research
1.4.2.Primary research
1.4.3.Analyst tools and models
CHAPTER 2:EXECUTIVE SUMMARY
2.1.Key findings of the study
2.2.CXO perspective
CHAPTER 3:MARKET LANDSCAPE
3.1.Market definition and scope
3.2.Key findings
3.2.1.Top investment pockets
3.2.2.Top winning strategies
3.3.Porter’s five force analysis
3.4.Top player positioning, 2020
3.5.Market dynamics
3.5.1.Drivers
3.5.1.1.Increase in prevalence of eye disorders
3.5.1.2.Surge in government initiatives to control visual impairment
3.5.1.3.Increase in geriatric population
3.5.2.Restraint
3.5.2.1.Lack of access to optical imaging in underdeveloped countries
3.5.3.Opportunity
3.5.3.1.High market growth potential in emerging markets
3.5.4.Impact analysis
3.6.COVID-19 impact analysis on optical imaging market
CHAPTER 4:OPTICAL IMAGING MARKET, BY PRODUCT TYPE
4.1.Overview
4.1.1.Market size and forecast
4.2.Imaging systems
4.2.1.Key market trends, growth factors, and opportunities
4.2.2.Market size and forecast, by region
4.2.3.Market analysis, by country
4.2.4.Market size and forecast, by type
4.2.4.1.Optical imaging systems
4.2.4.1.1.Market size and forecast
4.2.4.2.Spectral imaging systems
4.2.4.2.1.Market size and forecast
4.3.Software
4.3.1.Key market trends, growth factors, and opportunities
4.3.2.Market size and forecast, by region
4.3.3.Market analysis, by country
4.4.Lenses
4.4.1.Key market trends, growth factors, and opportunities
4.4.2.Market size and forecast, by region
4.4.3.Market analysis, by country
4.5.Camera
4.5.1.Key market trends, growth factors, and opportunities
4.5.2.Market size and forecast
4.5.3.Market analysis, by country
4.6.Illumination systems
4.6.1.Key market trends, growth factors, and opportunities
4.6.2.Market size and forecast, by region
4.6.3.Market analysis, by country
CHAPTER 5:OPTICAL IMAGING MARKET, BY THERAPEUTIC AREA
5.1.Overview
5.1.1.Market size and forecast
5.2.Ophthalmology
5.2.1.Market size and forecast, by region
5.2.2.Market analysis, by country
5.3.Oncology
5.3.1.Market size and forecast, by region
5.3.2.Market analysis, by country
5.4.Cardiology
5.4.1.Market size and forecast, by region
5.4.2.Market analysis, by country
5.5.Neurology
5.5.1.Market size and forecast, by region
5.5.2.Market analysis, by country
5.6.Others
5.6.1.Market size and forecast, by region
5.6.2.Market analysis, by country
CHAPTER 6:OPTICAL IMAGING MARKET, BY END USER
6.1.Overview
6.1.1.Market size and forecast
6.2.Hospitals & clinics
6.2.1.Market size and forecast, by region
6.2.2.Market analysis, by country
6.3.Research laboratories
6.3.1.Market size and forecast, by region
6.3.2.Market analysis, by country
6.4.Pharmaceuticals & biotechnology companies
6.4.1.Market size and forecast, by region
6.4.2.Market analysis, by country
CHAPTER 7:OPTICAL IMAGING MARKET, BY REGION
7.1.Overview
7.1.1.Market size and forecast
7.2.North America
7.2.1.Key market trends, growth factors, and opportunities
7.2.2.Market size and forecast, by country
7.2.2.1.U.S.
7.2.2.1.1.U.S. optical imaging market, by product type
7.2.2.1.2.U.S. optical imaging market, by therapeutic area
7.2.2.1.3.U.S. optical imaging market, by end user
7.2.2.2.Canada
7.2.2.2.1.Canada optical imaging market, by product type
7.2.2.2.2.Canada optical imaging market, by therapeutic area
7.2.2.2.3.Canada optical imaging market, by end user
7.2.2.3.Mexico
7.2.2.3.1.Mexico optical imaging market, by product type
7.2.2.3.2.Mexico optical imaging market, by therapeutic area
7.2.2.3.3.Mexico optical imaging market, by end user
7.2.3.North America market size and forecast, by product type
7.2.4.North America market size and forecast, by therapeutic area
7.2.5.North America market size and forecast, by end user
7.3.Europe
7.3.1.Key market trends, growth factors, and opportunities
7.3.2.Market size and forecast, by country
7.3.2.1.Germany
7.3.2.1.1.Germany optical imaging market, by product type
7.3.2.1.2.Germany optical imaging market, by therapeutic area
7.3.2.1.3.Germany optical imaging market, by end user
7.3.2.2.France
7.3.2.2.1.France optical imaging market, by product type
7.3.2.2.2.France optical imaging market, by therapeutic area
7.3.2.2.3.France optical imaging market, by end user
7.3.2.3.UK
7.3.2.3.1.UK optical imaging market, by product type
7.3.2.3.2.UK optical imaging market, by therapeutic area
7.3.2.3.3.UK optical imaging market, by end user
7.3.2.4.Italy
7.3.2.4.1.Italy optical imaging market, by product type
7.3.2.4.2.Italy optical imaging market, by therapeutic area
7.3.2.4.3.Italy optical imaging market, by end user
7.3.2.5.Spain
7.3.2.5.1.Spain optical imaging market, by product type
7.3.2.5.2.Spain optical imaging market, by therapeutic area
7.3.2.5.3.Spain optical imaging market, by end user
7.3.2.6.Rest of Europe
7.3.2.6.1.Rest of Europe optical imaging market, by product type
7.3.2.6.2.Rest of Europe optical imaging market, by therapeutic area
7.3.2.6.3.Rest of Europe optical imaging market, by end user
7.3.3.Europe market size and forecast, by product type
7.3.4.Europe market size and forecast, by therapeutic area
7.3.5.Europe market size and forecast, by end user
7.4.Asia-Pacific
7.4.1.Key market trends, growth factors, and opportunities
7.4.2.Market size and forecast, by country
7.4.2.1.Japan
7.4.2.1.1.Japan optical imaging market, by product type
7.4.2.1.2.Japan optical imaging market, by therapeutic area
7.4.2.1.3.Japan optical imaging market, by end user
7.4.2.2.China
7.4.2.2.1.China optical imaging market, by product type
7.4.2.2.2.China optical imaging market, by therapeutic area
7.4.2.2.3.China optical imaging market, by end user
7.4.2.3.Australia
7.4.2.3.1.Australia optical imaging market, by product type
7.4.2.3.2.Australia optical imaging market, by therapeutic area
7.4.2.3.3.Australia optical imaging market, by end user
7.4.2.4.India
7.4.2.4.1.India optical imaging market, by product type
7.4.2.4.2.India optical imaging market, by therapeutic area
7.4.2.4.3.India optical imaging market, by end user
7.4.2.5.South Korea
7.4.2.5.1.South Korea optical imaging market, by product type
7.4.2.5.2.South Korea optical imaging market, by therapeutic area
7.4.2.5.3.South Korea optical imaging market, by end user
7.4.2.6.Rest of Asia-Pacific
7.4.2.6.1.Rest of Asia-Pacific optical imaging market, by product type
7.4.2.6.2.Rest of Asia-Pacific optical imaging market, by therapeutic area
7.4.2.6.3.Rest of Asia-Pacific optical imaging market, by end user
7.4.3.Asia-Pacific market size and forecast, by product type
7.4.4.Asia-Pacific market size and forecast, by therapeutic area
7.4.5.Asia-Pacific market size and forecast, by end user
7.5.LAMEA
7.5.1.Key market trends, growth factors, and opportunities
7.5.2.Market size and forecast, by country
7.5.2.1.Brazil
7.5.2.1.1.Brazil optical imaging market, by product type
7.5.2.1.2.Brazil optical imaging market, by therapeutic area
7.5.2.1.3.Brazil optical imaging market, by end user
7.5.2.2.Saudi Arabia
7.5.2.2.1.Saudi Arabia optical imaging market, by product type
7.5.2.2.2.Saudi Arabia optical imaging market, by therapeutic area
7.5.2.2.3.Saudi Arabia optical imaging market, by end user
7.5.2.3.South Africa
7.5.2.3.1.South Africa optical imaging market, by product type
7.5.2.3.2.South Africa optical imaging market, by therapeutic area
7.5.2.3.3.South Africa optical imaging market, by end user
7.5.2.4.Rest of LAMEA
7.5.2.4.1.Rest of LAMEA optical imaging market, by product type
7.5.2.4.2.Rest of LAMEA optical imaging market, by therapeutic area
7.5.2.4.3.Rest of LAMEA optical imaging market, by end user
7.5.3.LAMEA market size and forecast, by product type
7.5.4.LAMEA market size and forecast, by therapeutic area
7.5.5.LAMEA market size and forecast, by end user
CHAPTER 8:COMPANY PROFILES
8.1.ABBOTT LABORATORIES
8.1.1.Company overview
8.1.2.Company snapshot
8.1.3.Operating business segments
8.1.4.Product portfolio
8.1.5.Business performance
8.1.6.Key strategic moves and developments
8.2.CANON INC.
8.2.1.Company overview
8.2.2.Company snapshot
8.2.3.Operating business segments
8.2.4.Product portfolio
8.2.5.Business performance
8.2.6.Key strategic moves and developments
8.3.CARL ZEISS FOUNDATION (CARL ZEISS MEDITEC AG)
8.3.1.Company overview
8.3.2.Company snapshot
8.3.3.Operating business segments
8.3.4.Product portfolio
8.4.CYLITE PTY LTD.
8.4.1.Company overview
8.4.2.Company snapshot
8.4.3.Operating business segments
8.4.4.Product portfolio
8.4.5.Key strategic moves and developments
8.5.DANAHER CORPORATION (LEICA MICROSYSTEMS GMBH)
8.5.1.Company overview
8.5.2.Company snapshot
8.5.3.Operating business segments
8.5.4.Product portfolio
8.5.5.Business performance
8.6.HEIDELBERG ENGINEERING GMBH (HEIDELBERG ENGINEERING INC.)
8.6.1.Company overview
8.6.2.Company snapshot
8.6.3.Operating business segments
8.6.4.Product portfolio
8.6.5.Key strategic moves and developments
8.7.KONINKLIJKE PHILIPS N.V
8.7.1.Company overview
8.7.2.Company snapshot
8.7.3.Operating business segments
8.7.4.Product portfolio
8.7.5.Business performance
8.8.MICHELSON DIAGNOSTICS LTD.
8.8.1.Company overview
8.8.2.Company snapshot
8.8.3.Operating business segments
8.8.4.Product portfolio
8.9.OPTOVUE, LTD.
8.9.1.Company overview
8.9.2.Company snapshot
8.9.3.Operating business segments
8.9.4.Product portfolio
8.9.5.Key strategic moves and developments
8.10.TOPCON CORPORATION (TOPCON HEALTHCARE)
8.10.1.Company overview
8.10.2.Company snapshot
8.10.3.Operating business segments
8.10.4.Product portfolio
8.10.5.Business performance
8.10.6.Key strategic moves and developments
LIST OF TABLES
TABLE 01.OPTICAL IMAGING MARKET, BY PRODUCT TYPE, 2020-2030 ($MILLION)
TABLE 02.OPTICAL IMAGING MARKET FOR IMAGING SYSTEMS, BY REGION, 2020-2030($MILLION)
TABLE 03.OPTICAL IMAGING MARKET FOR IMAGING SYSTEMS, BY TYPE, 2020–2030 ($MILLION)
TABLE 04.OPTICAL IMAGING MARKET FOR SOFTWARE, BY REGION, 2020-2030($MILLION)
TABLE 05.OPTICAL IMAGING MARKET FOR LENSES, BY REGION, 2020-2030($MILLION)
TABLE 06.OPTICAL IMAGING MARKET FOR CAMERA, BY REGION, 2020–2030 ($MILLION)
TABLE 07.OPTICAL IMAGING MARKET FOR ILLUMINATION SYSTEMS, BY REGION, 2020-2030($MILLION)
TABLE 08.OPTICAL IMAGING MARKET, BY THERAPEUTIC AREA, 2020-2030 ($MILLION)
TABLE 09.OPTICAL IMAGING MARKET FOR OPHTHALMOLOGY, BY REGION, 2020-2030 ($MILLION)
TABLE 10.OPTICAL IMAGING MARKET FOR ONCOLOGY, BY REGION, 2020-2030 ($MILLION)
TABLE 11.OPTICAL IMAGING MARKET FOR CARDIOLOGY, BY REGION, 2020-2030 ($MILLION)
TABLE 12.OPTICAL IMAGING MARKET FOR NEUROLOGY, BY REGION, 2020-2030 ($MILLION)
TABLE 13.OPTICAL IMAGING MARKET FOR OTHERS, BY REGION, 2020-2030 ($MILLION)
TABLE 14.OPTICAL IMAGING MARKET, BY END USER, 2020-2030 ($MILLION)
TABLE 15.OPTICAL IMAGING MARKET FOR HOSPITALS & CLINICS, BY REGION, 2020-2030($MILLION)
TABLE 16.OPTICAL IMAGING MARKET FOR RESEARCH LABORATORIES, BY REGION, 2020-2030($MILLION)
TABLE 17.OPTICAL IMAGING MARKET FOR PHARMACEUTICALS & BIOTECHNOLOGY COMPANIES, BY REGION, 2020-2030 ($MILLION)
TABLE 18.OPTICAL IMAGING MARKET, BY REGION, 2020–2030 ($MILLION)
TABLE 19.NORTH AMERICA OPTICAL IMAGING MARKET, BY COUNTRY, 2020–2030 ($MILLION)
TABLE 20.U.S. OPTICAL IMAGING MARKET, BY PRODUCT TYPE, 2020–2030 ($MILLION)
TABLE 21.U.S. OPTICAL IMAGING MARKET, BY THERAPEUTIC AREA, 2020–2030 ($MILLION)
TABLE 22.U.S. OPTICAL IMAGING MARKET, BY END USER, 2020–2030 ($MILLION)
TABLE 23.CANADA OPTICAL IMAGING MARKET, BY PRODUCT TYPE, 2020–2030 ($MILLION)
TABLE 24.CANADA OPTICAL IMAGING MARKET, BY THERAPEUTIC AREA, 2020–2030 ($MILLION)
TABLE 25.CANADA OPTICAL IMAGING MARKET, BY END USER, 2020–2030 ($MILLION)
TABLE 26.MEXICO OPTICAL IMAGING MARKET, BY PRODUCT TYPE, 2020–2030 ($MILLION)
TABLE 27.MEXICO OPTICAL IMAGING MARKET, BY THERAPEUTIC AREA, 2020–2030 ($MILLION)
TABLE 28.MEXICO OPTICAL IMAGING MARKET, BY END USER, 2020–2030 ($MILLION)
TABLE 29.NORTH AMERICA OPTICAL IMAGING MARKET, BY PRODUCT TYPE, 2020–2030 ($MILLION)
TABLE 30.NORTH AMERICA OPTICAL IMAGING MARKET, BY THERAPEUTIC AREA, 2020–2030 ($MILLION)
TABLE 31.NORTH AMERICA OPTICAL IMAGING MARKET, BY END USER, 2020–2030 ($MILLION)
TABLE 32.EUROPE OPTICAL IMAGING MARKET, BY COUNTRY, 2020–2030 ($MILLION)
TABLE 33.GERMANY OPTICAL IMAGING MARKET, BY PRODUCT TYPE, 2020–2030 ($MILLION)
TABLE 34.GERMANY OPTICAL IMAGING MARKET, BY THERAPEUTIC AREA, 2020–2030 ($MILLION)
TABLE 35.GERMANY OPTICAL IMAGING MARKET, BY END USER, 2020–2030 ($MILLION)
TABLE 36.FRANCE OPTICAL IMAGING MARKET, BY PRODUCT TYPE, 2020–2030 ($MILLION)
TABLE 37.FRANCE OPTICAL IMAGING MARKET, BY THERAPEUTIC AREA, 2020–2030 ($MILLION)
TABLE 38.FRANCE OPTICAL IMAGING MARKET, BY END USER, 2020–2030 ($MILLION)
TABLE 39.UK OPTICAL IMAGING MARKET, BY PRODUCT TYPE, 2020–2030 ($MILLION)
TABLE 40.UK OPTICAL IMAGING MARKET, BY THERAPEUTIC AREA, 2020–2030 ($MILLION)
TABLE 41.UK OPTICAL IMAGING MARKET, BY END USER, 2020–2030 ($MILLION)
TABLE 42.ITALY OPTICAL IMAGING MARKET, BY PRODUCT TYPE, 2020–2030 ($MILLION)
TABLE 43.ITALY OPTICAL IMAGING MARKET, BY THERAPEUTIC AREA, 2020–2030 ($MILLION)
TABLE 44.ITALY OPTICAL IMAGING MARKET, BY END USER, 2020–2030 ($MILLION)
TABLE 45.SPAIN OPTICAL IMAGING MARKET, BY PRODUCT TYPE, 2020–2030 ($MILLION)
TABLE 46.SPAIN OPTICAL IMAGING MARKET, BY THERAPEUTIC AREA, 2020–2030 ($MILLION)
TABLE 47.SPAIN OPTICAL IMAGING MARKET, BY END USER, 2020–2030 ($MILLION)
TABLE 48.REST OF EUROPE OPTICAL IMAGING MARKET, BY PRODUCT TYPE, 2020–2030 ($MILLION)
TABLE 49.REST OF EUROPE OPTICAL IMAGING MARKET, BY THERAPEUTIC AREA, 2020–2030 ($MILLION)
TABLE 50.REST OF EUROPE OPTICAL IMAGING MARKET, BY END USER, 2020–2030 ($MILLION)
TABLE 51.EUROPE OPTICAL IMAGING MARKET, BY PRODUCT TYPE, 2020–2030 ($MILLION)
TABLE 52.EUROPE OPTICAL IMAGING MARKET, BY THERAPEUTIC AREA, 2020–2030 ($MILLION)
TABLE 53.EUROPE OPTICAL IMAGING MARKET, BY END USER, 2020–2030 ($MILLION)
TABLE 54.ASIA-PACIFIC OPTICAL IMAGING MARKET, BY COUNTRY, 2020–2030 ($MILLION)
TABLE 55.JAPAN OPTICAL IMAGING MARKET, BY PRODUCT TYPE, 2020–2030 ($MILLION)
TABLE 56.JAPAN OPTICAL IMAGING MARKET, BY THERAPEUTIC AREA, 2020–2030 ($MILLION)
TABLE 57.JAPAN OPTICAL IMAGING MARKET, BY END USER, 2020–2030 ($MILLION)
TABLE 58.CHINA OPTICAL IMAGING MARKET, BY PRODUCT TYPE, 2020–2030 ($MILLION)
TABLE 59.CHINA OPTICAL IMAGING MARKET, BY THERAPEUTIC AREA, 2020–2030 ($MILLION)
TABLE 60.CHINA OPTICAL IMAGING MARKET, BY END USER, 2020–2030 ($MILLION)
TABLE 61.AUSTRALIA OPTICAL IMAGING MARKET, BY PRODUCT TYPE, 2020–2030 ($MILLION)
TABLE 62.AUSTRALIA OPTICAL IMAGING MARKET, BY THERAPEUTIC AREA, 2020–2030 ($MILLION)
TABLE 63.AUSTRALIA OPTICAL IMAGING MARKET, BY END USER, 2020–2030 ($MILLION)
TABLE 64.INDIA OPTICAL IMAGING MARKET, BY PRODUCT TYPE, 2020–2030 ($MILLION)
TABLE 65.INDIA OPTICAL IMAGING MARKET, BY THERAPEUTIC AREA, 2020–2030 ($MILLION)
TABLE 66.INDIA OPTICAL IMAGING MARKET, BY END USER, 2020–2030 ($MILLION)
TABLE 67.SOUTH KOREA OPTICAL IMAGING MARKET, BY PRODUCT TYPE, 2020–2030 ($MILLION)
TABLE 68.SOUTH KOREA OPTICAL IMAGING MARKET, BY THERAPEUTIC AREA, 2020–2030 ($MILLION)
TABLE 69.SOUTH KOREA OPTICAL IMAGING MARKET, BY END USER, 2020–2030 ($MILLION)
TABLE 70.REST OF ASIA-PACIFIC OPTICAL IMAGING MARKET, BY PRODUCT TYPE, 2020–2030 ($MILLION)
TABLE 71.REST OF ASIA-PACIFIC OPTICAL IMAGING MARKET, BY THERAPEUTIC AREA, 2020–2030 ($MILLION)
TABLE 72.REST OF ASIA-PACIFIC OPTICAL IMAGING MARKET, BY END USER, 2020–2030 ($MILLION)
TABLE 73.ASIA-PACIFIC OPTICAL IMAGING MARKET, BY PRODUCT TYPE, 2020–2030 ($MILLION)
TABLE 74.ASIA-PACIFIC OPTICAL IMAGING MARKET, BY THERAPEUTIC AREA, 2020–2030 ($MILLION)
TABLE 75.ASIA-PACIFIC OPTICAL IMAGING MARKET, BY END USER, 2020–2030 ($MILLION)
TABLE 76.LAMEA OPTICAL IMAGING MARKET, BY COUNTRY, 2020–2030 ($MILLION)
TABLE 77.BRAZIL OPTICAL IMAGING MARKET, BY PRODUCT TYPE, 2020–2030 ($MILLION)
TABLE 78.BRAZIL OPTICAL IMAGING MARKET, BY THERAPEUTIC AREA, 2020–2030 ($MILLION)
TABLE 79.BRAZIL OPTICAL IMAGING MARKET, BY END USER, 2020–2030 ($MILLION)
TABLE 80.SAUDI ARABIA OPTICAL IMAGING MARKET, BY PRODUCT TYPE, 2020–2030 ($MILLION)
TABLE 81.SAUDI ARABIA OPTICAL IMAGING MARKET, BY THERAPEUTIC AREA, 2020–2030 ($MILLION)
TABLE 82.SAUDI ARABIA OPTICAL IMAGING MARKET, BY END USER, 2020–2030 ($MILLION)
TABLE 83.SOUTH AFRICA OPTICAL IMAGING MARKET, BY PRODUCT TYPE, 2020–2030 ($MILLION)
TABLE 84.SOUTH AFRICA OPTICAL IMAGING MARKET, BY THERAPEUTIC AREA, 2020–2030 ($MILLION)
TABLE 85.SOUTH AFRICA OPTICAL IMAGING MARKET, BY END USER, 2020–2030 ($MILLION)
TABLE 86.REST OF LAMEA OPTICAL IMAGING MARKET, BY PRODUCT TYPE, 2020–2030 ($MILLION)
TABLE 87.REST OF LAMEA OPTICAL IMAGING MARKET, BY THERAPEUTIC AREA, 2020–2030 ($MILLION)
TABLE 88.REST OF LAMEA OPTICAL IMAGING MARKET, BY END USER, 2020–2030 ($MILLION)
TABLE 89.LAMEA OPTICAL IMAGING MARKET, BY PRODUCT TYPE, 2020–2030 ($MILLION)
TABLE 90.LAMEA OPTICAL IMAGING MARKET, BY THERAPEUTIC AREA, 2020–2030 ($MILLION)
TABLE 91.LAMEA OPTICAL IMAGING MARKET, BY END USER, 2020–2030 ($MILLION)
TABLE 92.ABBOTT: COMPANY SNAPSHOT
TABLE 93.ABBOTT: OPERATING SEGMENTS
TABLE 94.ABBOTT: PRODUCT PORTFOLIO
TABLE 95.ABBOTT: KEY DEVELOPMENTS
TABLE 96.CANON: COMPANY SNAPSHOT
TABLE 97.CANON: OPERATING SEGMENTS
TABLE 98.CANON: PRODUCT PORTFOLIO
TABLE 99.CANON: KEY DEVELOPMENTS
TABLE 100.CARL ZEISS: COMPANY SNAPSHOT
TABLE 101.CARL ZEISS: PRODUCT SEGMENTS
TABLE 102.CARL ZEISS: PRODUCT PORTFOLIO
TABLE 103.CYLITE: COMPANY SNAPSHOT
TABLE 104.CYLITE: OPERATING BUSINESS SEGMENT
TABLE 105.CYLITE: PRODUCT PORTFOLIO
TABLE 106.CYLITE: KEY DEVELOPMENTS
TABLE 107.DANAHER: COMPANY SNAPSHOT
TABLE 108.DANAHER: PRODUCT SEGMENTS
TABLE 109.DANAHER: PRODUCT PORTFOLIO
TABLE 110.HEILDELBERG: COMPANY SNAPSHOT
TABLE 111.HEILDELBERG: PRODUCT SEGMENTS
TABLE 112.HEILDELBERG: PRODUCT PORTFOLIO
TABLE 113.HEILDELBERG: KEY DEVELOPMENTS
TABLE 114.PHILIPS: COMPANY SNAPSHOT
TABLE 115.PHILIPS: PRODUCT SEGMENTS
TABLE 116.PHILIPS: PRODUCT PORTFOLIO
TABLE 117.MICHELSON: COMPANY SNAPSHOT
TABLE 118.OPTOVUE: OPERATING BUSINESS SEGMENTS
TABLE 119.MICHELSON: PRODUCT PORTFOLIO
TABLE 120.OPTOVUE: COMPANY SNAPSHOT
TABLE 121.OPTOVUE: OPERATING BUSINESS SEGMENTS
TABLE 122.OPTOVUE: PRODUCT PORTFOLIO
TABLE 123.OPTOVUE: KEY DEVELOPMENTS
TABLE 124.TOPCON: COMPANY SNAPSHOT
TABLE 125.TOPCON: OPERATING SEGMENTS
TABLE 126.TOPCON: PRODUCT PORTFOLIO
TABLE 127.TOPCON: KEY DEVELOPMENTS
LIST OF FIGURES
FIGURE 01.GLOBAL OPTICAL IMAGING MARKET SEGMENTATION
FIGURE 02.TOP INVESTMENT POCKETS
FIGURE 03.TOP WINNING STRATEGIES, BY YEAR, 2019-2021
FIGURE 04.TOP WINNING STRATEGIES, BY DEVELOPMENT, 2019-2021
FIGURE 05.TOP WINNING STRATEGIES, BY COMPANY, 2019-2021
FIGURE 06.HIGH BARGAINING POWER OF SUPPLIERS
FIGURE 07.MODERATE BARGAINING POWER OF BUYERS
FIGURE 08.HIGH THREAT OF SUBSTITUTES
FIGURE 09.MODERATE THREAT OF NEW ENTRANTS
FIGURE 10.MODERATE INTENSITY OF RIVALRY
FIGURE 11.TOP PLAYER POSITIONING, 2020
FIGURE 12.IMPACT ANALYSIS
FIGURE 13.COMPARATIVE SHARE ANALYSIS OF OPTICAL IMAGING SYSTEMS MARKET, BY COUNTRY, 2020 & 2030 ($MILLION)
FIGURE 14.OPTICAL IMAGING SYSTEMS MARKET, 2020–2030 ($MILLION)
FIGURE 15.SPECTRAL IMAGING SYSTEMS MARKET, 2020–2030 ($MILLION)
FIGURE 16.COMPARATIVE SHARE ANALYSIS OF OPTICAL IMAGING MARKET FOR SOFTWARE, BY COUNTRY, 2020 & 2030 ($MILLION)
FIGURE 17.COMPARATIVE SHARE ANALYSIS OF OPTICAL IMAGING MARKET FOR LENSES, BY COUNTRY, 2020 & 2030 ($MILLION)
FIGURE 18.COMPARATIVE ANALYSIS OF OPTICAL IMAGING MARKET FOR CAMERA, BY COUNTRY, 2020 & 2030 ($MILLION)
FIGURE 19.COMPARATIVE SHARE ANALYSIS OF OPTICAL IMAGING MARKET FOR ILLUMINATION SYSTEMS, BY COUNTRY, 2020 & 2030 ($MILLION)
FIGURE 20.COMPARATIVE ANALYSIS OF OPTICAL IMAGING MARKET FOR OPHTHALMOLOGY, BY COUNTRY, 2020 & 2030 ($MILLION)
FIGURE 21.COMPARATIVE ANALYSIS OF OPTICAL IMAGING MARKET FOR ONCOLOGY, BY COUNTRY, 2020 & 2030 ($MILLION)
FIGURE 22.COMPARATIVE ANALYSIS OF OPTICAL IMAGING MARKET FOR CARDIOLOGY, BY COUNTRY, 2020 & 2030 ($MILLION)
FIGURE 23.COMPARATIVE ANALYSIS OF OPTICAL IMAGING MARKET FOR NEUROLOGY, BY COUNTRY, 2020 & 2030 ($MILLION)
FIGURE 24.COMPARATIVE ANALYSIS OF OPTICAL IMAGING MARKET FOR OTHERS, BY COUNTRY, 2020 & 2030 ($MILLION)
FIGURE 25.COMPARATIVE SHARE ANALYSIS OF OPTICAL IMAGING MARKET FOR HOSPITALS & CLINICS, BY COUNTRY, 2020 & 2030 ($MILLION)
FIGURE 26.COMPARATIVE SHARE ANALYSIS OF OPTICAL IMAGING MARKET FOR RESEARCH LABORATORIES, BY COUNTRY, 2020 & 2030 ($MILLION)
FIGURE 27.COMPARATIVE SHARE ANALYSIS OF OPTICAL IMAGING MARKET FOR PHARMACEUTICALS & BIOTECHNOLOGY COMPANIES, BY COUNTRY, 2020 & 2030 ($MILLION)
FIGURE 28.ABBOTT: NET SALES, 2018–2020 ($MILLION)
FIGURE 29.ABBOTT: REVENUE SHARE BY SEGMENT, 2020 (%)
FIGURE 30.ABBOTT: REVENUE SHARE BY REGION, 2020(%)
FIGURE 31.CANON: NET SALES, 2018–2020 ($MILLION)
FIGURE 32.CANON: REVENUE SHARE BY SEGMENT, 2020 (%)
FIGURE 33.CANON: REVENUE SHARE BY REGION, 2020(%)
FIGURE 34.DANAHER: NET SALES, 2018–2020 ($MILLION)
FIGURE 35.DANAHER: REVENUE SHARE BY SEGMENT, 2020 (%)
FIGURE 36.DANAHER: REVENUE SHARE BY REGION, 2020(%)
FIGURE 37.PHILIPS: NET SALES, 2018–2020 ($MILLION)
FIGURE 38.PHILIPS: REVENUE SHARE BY SEGMENT, 2020 (%)
FIGURE 39.PHILIPS: REVENUE SHARE BY REGION, 2020(%)
FIGURE 40.TOPCON: NET SALES, 2019–2020 ($MILLION)
FIGURE 41.TOPCON: REVENUE SHARE BY SEGMENT, 2020 (%)
FIGURE 42.TOPCON: REVENUE SHARE BY REGION, 2020 (%)
$6168
$10663
HAVE A QUERY?
OUR CUSTOMER

SIMILAR REPORTS