
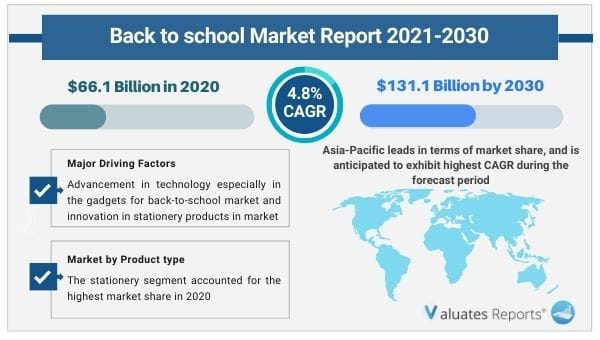
The global back-to-school market size was valued at USD 66.1 Billion in 2020 and is projected to reach USD 131.1 Billion by 2030, registering a CAGR of 4.8% from 2021 to 2030. The stationary segment dominated in terms of market share in 2020 and is expected to retain its dominance throughout the forecast period.
The expansion of the back-to-school market is fueled by advancements in the retail and digital industries. The expansion of the global market is being fueled by an increase in the retail sales of school supplies and stationery through online distribution channels during the coming years. Consumers may now access improved online payment channels quickly and easily, which is driving industry expansion. The industry is also fueled by parents in developing nations like India, China, Brazil, South Africa, and others spending more money on school supplies and stationery for their kids.
The opening months of the COVID-19 pandemic saw a small decline in the purchase of school supplies. As the world returns to normal and schools once more go from an online to an offline mode, the market is anticipated to grow steadily and healthily over the course of the forecast period. Developments in the brick-and-mortar retail sectors also contribute to market growth. Shopping centers, department stores, and specialized stores are extending to new areas as a result of the fast industrialization and urbanization, assisting in the market expansion. The increased usage of electronic items as a substitute for writing and reading materials including notebooks, pens, and pencils is limiting the growth of the global market.
It is anticipated that the need for various stationery items would decline as smart classroom and green school initiatives that promote global sustainability, recycling, and waste reduction become more prevalent. E-commerce or online channels are anticipated to present the market's players with several growth chances. The back-to-school industry is expected to benefit from the online distribution channel given the trend of growing dependence on online transactions and digital technologies due to the comfort and ease of operation. In the e-commerce industry, important players are entering and growing their presence.
The LAMEA and Asia-Pacific areas contain a number of emerging nations. The youth of these nations must be educated to participate in the development if progress is to be made. In order to raise the literacy rate, the governments of several nations in the region are placing a strong emphasis on elementary education and educational initiatives. However, a large majority of the population in the area still resides in rural areas where there are no schools or other educational facilities.
Governments are investing major funds and resources in the construction of educational infrastructure in these areas with an emphasis on education and skill development in order to address this problem. Additionally, a lot of NGOs support these government initiatives by giving kids school supplies so they can learn. It is projected that the government's and non-governmental organizations' efforts to advance education in the area will increase demand for back-to-school supplies, fueling the market's expansion.
Based on region, Asia Pacific is expected to be the most lucrative region. The region's high market share was influenced by a strong presence of significant players/manufacturers in the area and a strong distribution network. Due to the rising population in nations like China and India, there is also a greater need for stationery and school supplies in the regional market.
| Report Metric | Details |
| Report Name | Back to school Market |
| The market size in 2020 | USD 66.1 Billion |
| The revenue forecast in 2030 | USD 131.1 Billion |
| Growth Rate | CAGR 4.8% |
| Market size available for years | 2021-2030 |
| Forecast units | Value (USD) |
| Segments covered | Type, Application, Industry, Regions |
| Report coverage | Revenue & volume forecast, company share, competitive landscape, growth factors, and trends |
| Geographic regions covered | North America, Europe, Asia Pacific, Latin America, Middle East & Africa |
Ans. The global back-to-school market was valued at $66.1 billion in 2020, and is projected reach $131.1 billion by 2030, registering a CAGR of 4.8% from 2021 to 2030
Ans. By distribution channel, the maximum sales of back-to-school supplies were observed from the specialty stores segment in 2020, while the e-commerce segment is expected to witness highest growth during the forecast period.
Ans. Asia-Pacific leads in terms of market share, and is anticipated to exhibit highest CAGR during the forecast period
Ans. Advancement in technology especially in the gadgets for back-to-school market and innovation in stationery products in market are likely to shape back-to-school market during the forecasted period
Ans. The key players profiled for in the global back-to-school market analysis include Acco Brands, Faber Castell, Harlequin International Group Pty Ltd., ITC Limited, Mitsubishi Pencil Co., Ltd., Pelikan International Corporation Berhad, Schwan Stabilo Group, Staedetler, Wh Smith Plc, and Zebra Pen Corp. Other prominent players analyzed in the report are Faber-Castell, Nike, Skybags., Izod, Staedtler.
Ans. Yes, the report includes a COVID-19 impact analysis. Also, it is further extended into every individual segment of the report.
CHAPTER 1:INTRODUCTION
1.1.Report description
1.2.Key benefits for stakeholders
1.3.Key market segments
1.4.Research methodology
1.4.1.Primary research
1.4.2.Secondary research
1.4.3.Analyst tools and models
CHAPTER 2:EXECUTIVE SUMMARY
2.1.Key findings
2.1.1.Top impacting factors
2.1.2.Top investment pockets
2.2.CXO perspective
CHAPTER 3:MARKET OVERVIEW
3.1.Market definition and scope
3.2.Porter's five forces analysis
3.2.1.Bargaining power of suppliers
3.2.2.Bargaining power of buyers
3.2.3.Threat of substitution
3.2.4.Threat of new entrants
3.2.5.Intensity of competitive rivalry
3.3.Supply chain analysis
3.4.Market dynamics
3.4.1.Drivers
3.4.1.1.Increase in campaigns and sales promotion
3.4.1.2.Increase in government expenditure and emphasis on primary education
3.4.1.3.Innovation in back-to-school products
3.4.2.Restraints
3.4.2.1.Outbreak of COVID-19
3.4.2.2.Choking hazard of small components and toxicity of certain stationery products
3.4.3.Opportunities
3.4.3.1.Digital transformation in education will shape the future
3.4.3.2.Increase in popularity of online shopping
3.1.COVID-19 analysis
3.1.1.Overview
3.1.2.Impact on consumer goods sector
3.1.3.Impact on back-to-school market
3.1.4.Multiple scenario
CHAPTER 4:BACK-TO-SCHOOL MARKET, BY PRODUCT TYPE
4.1.Overview
4.1.1.Market size and forecast, by product type
4.2.Backpack
4.2.1.Key market trends, growth factors, and opportunities
4.2.2.Market size and forecast, by region
4.2.3.Market analysis, by country
4.3.Electronic
4.3.1.Key market trends, growth factors, and opportunities
4.3.2.Market size and forecast, by region
4.3.3.Market analysis, by country
4.4.Stationery
4.4.1.Key market trends, growth factors, and opportunities
4.4.2.Market size and forecast, by region
4.4.3.Market analysis, by country
4.5.Clothing
4.5.1.Key market trends, growth factors, and opportunities
4.5.2.Market size and forecast, by region
4.5.3.Market analysis, by country
4.6.Shoes
4.6.1.Key market trends, growth factors, and opportunities
4.6.2.Market size and forecast, by region
4.6.3.Market analysis, by country
4.7.Others
4.7.1.Key market trends, growth factors, and opportunities
4.7.2.Market size and forecast, by region
4.7.3.Market analysis, by country
CHAPTER 5:BACK-TO-SCHOOL MARKET, BY DISTRIBUTION CHANNEL
5.1.Overview
5.1.1.Market size and forecast, by distribution channel
5.2.Hypermarket/supermarket
5.2.1.Key market trends, growth factors, and opportunities
5.2.2.Market size and forecast, by region
5.2.3.Market analysis, by country
5.3.E-commerce
5.3.1.Key market trends, growth factors, and opportunities
5.3.2.Market size and forecast, by region
5.3.3.Market analysis, by country
5.4.Dollar Stores
5.4.1.Key market trends, growth factors, and opportunities
5.4.2.Market size and forecast, by region
5.4.3.Market analysis, by country
5.5.Specialty stores
5.5.1.Key market trends, growth factors, and opportunities
5.5.2.Market size and forecast, by region
5.5.3.Market analysis, by country
5.6.Others
5.6.1.Key market trends, growth factors, and opportunities
5.6.2.Market size and forecast, by region
5.6.3.Market analysis, by country
CHAPTER 6:BACK-TO-SCHOOL MARKET, BY REGION
6.1.Overview
6.1.1.Market size and forecast, by region
6.2.North America
6.2.1.Key market trends, growth factors, and opportunities
6.2.2.Market size and forecast, by product type
6.2.3.Market size and forecast, by distribution channel
6.2.4.Market analysis, by country
6.2.4.1.U.S.
6.2.4.1.1.Market size and forecast, by product type
6.2.4.1.2.Market size and forecast, by distribution channel
6.2.4.2.Canada
6.2.4.2.1.Market size and forecast, by product type
6.2.4.2.2.Market size and forecast, by distribution channel
6.2.4.3.Mexico
6.2.4.3.1.Market size and forecast, by product type
6.2.4.3.2.Market size and forecast, by distribution channel
6.3.Europe
6.3.1.Key market trends, growth factors, and opportunities
6.3.2.Market size and forecast, by product type
6.3.3.Market size and forecast, by distribution channel
6.3.4.Market analysis, by country
6.3.4.1.UK
6.3.4.1.1.Market size and forecast, by product type
6.3.4.1.2.Market size and forecast, by distribution channel
6.3.4.2.Germany
6.3.4.2.1.Market size and forecast, by product type
6.3.4.2.2.Market size and forecast, by distribution channel
6.3.4.3.France
6.3.4.3.1.Market size and forecast, by product type
6.3.4.3.2.Market size and forecast, by distribution channel
6.3.4.4.Italy
6.3.4.4.1.Market size and forecast, by product type
6.3.4.4.2.Market size and forecast, by distribution channel
6.3.4.5.Spain
6.3.4.5.1.Market size and forecast, by product type
6.3.4.5.2.Market size and forecast, by distribution channel
6.3.4.6.Rest of Europe
6.3.4.6.1.Market size and forecast, by product type
6.3.4.6.2.Market size and forecast, by distribution channel
6.4.Asia-Pacific
6.4.1.Key market trends, growth factors, and opportunities
6.4.2.Market size and forecast, by product type
6.4.3.Market size and forecast, by distribution channel
6.4.4.Market analysis, by country
6.4.4.1.China
6.4.4.1.1.Market size and forecast, by product type
6.4.4.1.2.Market size and forecast, by distribution channel
6.4.4.2.India
6.4.4.2.1.Market size and forecast, by product type
6.4.4.2.2.Market size and forecast, by distribution channel
6.4.4.3.Japan
6.4.4.3.1.Market size and forecast, by product type
6.4.4.3.2.Market size and forecast, by distribution channel
6.4.4.4.Australia
6.4.4.4.1.Market size and forecast, by product type
6.4.4.4.2.Market size and forecast, by distribution channel
6.4.4.5.South Korea
6.4.4.5.1.Market size and forecast, by product type
6.4.4.5.2.Market size and forecast, by distribution channel
6.4.4.6.Indonesia
6.4.4.6.1.Market size and forecast, by product type
6.4.4.6.2.Market size and forecast, by distribution channel
6.4.4.7.Malaysia
6.4.4.7.1.Market size and forecast, by product type
6.4.4.7.2.Market size and forecast, by distribution channel
6.4.4.8.Singapore
6.4.4.8.1.Market size and forecast, by product type
6.4.4.8.2.Market size and forecast, by distribution channel
6.4.4.9.Vietnam
6.4.4.9.1.Market size and forecast, by product type
6.4.4.9.2.Market size and forecast, by distribution channel
6.4.4.10.Rest of Asia-Pacific
6.4.4.10.1.Market size and forecast, by product type
6.4.4.10.2.Market size and forecast, by distribution channel
6.5.LAMEA
6.5.1.Key market trends, growth factors, and opportunities
6.5.2.Market size and forecast, by product type
6.5.3.Market size and forecast, by distribution channel
6.5.4.Market analysis, by country
6.5.4.1.Latin America
6.5.4.1.1.Market size and forecast, by product type
6.5.4.1.2.Market size and forecast, by distribution channel
6.5.4.2.Middle East
6.5.4.2.1.Market size and forecast, by product type
6.5.4.2.2.Market size and forecast, by distribution channel
6.5.4.3.Africa
6.5.4.3.1.Market size and forecast, by product type
6.5.4.3.2.Market size and forecast, by distribution channel
CHAPTER 7:COMPETITION LANDSCAPE
7.1.Overview
7.2.Top player positioning
7.3.Competitive dashboard
7.4.Competitive heatmap
7.5.Product mapping
7.6.Top winning strategies
7.7.Key developments
7.7.1.Acquisition
7.7.2.Business expansion
7.7.3.Product launch
7.8.Top player positioning
CHAPTER 8:COMPANY PROFILES
8.1.ACCO BRANDS
8.1.1.Company overview
8.1.2.Key executives
8.1.3.Company snapshot
8.1.4.Operating business segments
8.1.5.Product portfolio
8.1.6.R&D Expenditure
8.1.7.Business performance
8.1.8.Key strategic moves and developments
8.2.FABER CASTELL
8.2.1.Company overview
8.2.2.Key executives
8.2.3.Company snapshot
8.2.4.Product portfolio
8.2.5.Key strategic moves and developments
8.3.ITC LIMITED
8.3.1.Company overview
8.3.2.Key executives
8.3.3.Company snapshot
8.3.4.Operating business segments
8.3.5.Product portfolio
8.3.6.R&D Expenditure
8.3.7.Business performance
8.3.8.Key strategic moves and developments
8.4.KOKUYO CAMLIN LTD.
8.4.1.Company overview
8.4.2.Key executives
8.4.3.Company snapshot
8.4.4.Product portfolio
8.4.5.R&D Expenditure
8.4.6.Business performance
8.4.7.Key strategic moves and developments
8.5.MITSUBISHI PENCIL CO., LTD.
8.5.1.Company overview
8.5.2.Key executives
8.5.3.Company snapshot
8.5.4.Product portfolio
8.5.5.Business performance
8.6.PELIKAN INTERNATIONAL CORPORATION BERHAD
8.6.1.Company overview
8.6.2.Key executives
8.6.3.Company snapshot
8.6.4.Operating business segments
8.6.5.Product portfolio
8.6.6.R&D Expenditure
8.6.7.Business performance
8.7.SCHWAN STABILO GROUP
8.7.1.Company overview
8.7.2.Key executives
8.7.3.Company snapshot
8.7.4.Product portfolio
8.8.STAEDETLER
8.8.1.Company overview
8.8.2.Key executives
8.8.3.Company snapshot
8.8.4.Product portfolio
8.8.5.Key strategic moves and developments
8.9.WH SMITH PLC
8.9.1.Company overview
8.9.2.Key executives
8.9.3.Company snapshot
8.9.4.Operating business segments
8.9.5.Product portfolio
8.9.6.Business performance
8.9.7.Key strategic moves and developments
8.10.ZEBRA PEN CORP.
8.10.1.Company overview
8.10.2.Key executives
8.10.3.Company snapshot
8.10.4.Product portfolio
8.10.5.Key strategic moves and developments
Table 01.Back-To-School Market, By Product Type, 2020–2030 ($Million)
Table 02.Back-To-School Market For Backpack, By Country, 2020–2030 ($Million)
Table 03.Back-To-School Market For Electronics, By Country, 2020–2030 ($Million)
Table 04.Back-To-School Market For Stationery , By Country, 2020–2030 ($Million)
Table 05.Back-To-School Market For Clothing , By Country, 2020–2030 ($Million)
Table 06.Back-To-School Market For Shoes , By Country, 2020–2030 ($Million)
Table 07.Back-To-School Market For Others, By Country, 2020–2030 ($Million)
Table 08.Back-To-School Market Value, By Distribution Channel, 2020–2030 ($Million)
Table 09.Back-To-School Market For Hypermarket/Supermarket, By Region, 2020–2030 ($Million)
Table 10.Back-To-School Market For E-Commerce, By Region, 2020–2030 ($Million)
Table 11.Back-To-School Market For Dollar Stores, By Region, 2020–2030 ($Million)
Table 12.Back-To-School Market For Specialty Stores, By Region, 2020–2030 ($Million)
Table 13.Back-To-School Market For Others, By Region, 2020–2030 ($Million)
Table 14.Back-To-School Market, By Region, 2020–2030 ($Million)
Table 15.North America Back-To-School Market Value, By Product Type, 2020–2030 ($Million)
Table 16.North America Back-To-School Market Value, By Sales Channel, 2020–2030 ($Million)
Table 17.North America Back-To-School Market Value, By Country, 2020–2030 ($Million)
Table 18.U.S. Back-To-School Market Value, By Product Type, 2020–2030 ($Million)
Table 19.U.S. Back-To-School Market Value, By Distribution Channel, 2020–2030 ($Million)
Table 20.Canada Back-To-School Market Value, By Product Type, 2020–2030 ($Million)
Table 21.Canada Back-To-School Market Value, By Distribution Channel, 2020–2030 ($Million)
Table 22.Mexico Back-To-School Market Value, By Product Type, 2020–2030 ($Million)
Table 23.Mexico Back-To-School Market Value, By Distribution Channel, 2020–2030 ($Million)
Table 24.Europe Back-To-School Market Value, By Product Type, 2020–2030 ($Million)
Table 25.Europe Back-To-School Market Value, By Sales Channel, 2020–2030 ($Million)
Table 26.Europe Back-To-School Market Value, By Country, 2020–2030 ($Million)
Table 27.Uk Back-To-School Market Value, By Product Type, 2020–2030 ($Million)
Table 28.Uk Back-To-School Market Value, By Distribution Channel, 2020–2030 ($Million)
Table 29.Germany Back-To-School Market Value, By Product Type, 2020–2030 ($Million)
Table 30.Germany Back-To-School Market Value, By Distribution Channel, 2020–2030 ($Million)
Table 31.France Back-To-School Market Value, By Product Type, 2020–2030 ($Million)
Table 32.France Back-To-School Market Value, By Distribution Channel, 2020–2030 ($Million)
Table 33.Italy Back-To-School Market Value, By Product Type, 2020–2030 ($Million)
Table 34.Italy Back-To-School Market Value, By Distribution Channel, 2020–2030 ($Million)
Table 35.Spain Back-To-School Market Value, By Product Type, 2020–2030 ($Million)
Table 36.Spain Back-To-School Market Value, By Distribution Channel, 2020–2030 ($Million)
Table 37.Rest Of Europe Back-To-School Market Value, By Product Type, 2020–2030 ($Million)
Table 38.Rest Of Europe Back-To-School Market Value, By Distribution Channel, 2020–2030 ($Million)
Table 39.Asia-Pacific Back-To-School Market Value, By Product Type, 2020–2030 ($Million)
Table 40.Asia-Pacific Back-To-School Market Value, By Sales Channel, 2020–2030 ($Million)
Table 41.Asia-Pacific Back-To-School Market Value, By Country, 2020–2030 ($Million)
Table 42.China Back-To-School Market Value, By Product Type, 2020–2030 ($Million)
Table 43.China Back-To-School Market Value, By Distribution Channel, 2020–2030 ($Million)
Table 44.India Back-To-School Market Value, By Product Type, 2020–2030 ($Million)
Table 45.India Back-To-School Market Value, By Distribution Channel, 2020–2030 ($Million)
Table 46.Japan Back-To-School Market Value, By Product Type, 2020–2030 ($Million)
Table 47.Japan Back-To-School Market Value, By Distribution Channel, 2020–2030 ($Million)
Table 48.Australia Back-To-School Market Value, By Product Type, 2020–2030 ($Million)
Table 49.Australia Back-To-School Market Value, By Distribution Channel, 2020–2030 ($Million)
Table 50.South Korea Back-To-School Market Value, By Product Type, 2020–2030 ($Million)
Table 51.South Korea Back-To-School Market Value, By Distribution Channel, 2020–2030 ($Million)
Table 52.Indonesia Back-To-School Market Value, By Product Type, 2020–2030 ($Million)
Table 53.Indonesia Back-To-School Market Value, By Distribution Channel, 2020–2030 ($Million)
Table 54.Malaysia Back-To-School Market Value, By Product Type, 2020–2030 ($Million)
Table 55.Malaysia Back-To-School Market Value, By Distribution Channel, 2020–2030 ($Million)
Table 56.Singapore Back-To-School Market Value, By Product Type, 2020–2030 ($Million)
Table 57.Singapore Back-To-School Market Value, By Distribution Channel, 2020–2030 ($Million)
Table 58.Vietnam Back-To-School Market Value, By Product Type, 2020–2030 ($Million)
Table 59.Vietnam Back-To-School Market Value, By Distribution Channel, 2020–2030 ($Million)
Table 60.Rest Of Asia-Pacific Back-To-School Market Value, By Product Type, 2020–2030 ($Million)
Table 61.Rest Of Asia-Pacific Back-To-School Market Value, By Distribution Channel, 2020–2030 ($Million)
Table 62.Lamea Back-To-School Market Value, By Product Type, 2020–2030 ($Million)
Table 63.Lamea Back-To-School Market Value, By Sales Channel, 2020–2030 ($Million)
Table 64.Lamea Back-To-School Market Value, By Country, 2020–2030 ($Million)
Table 65.Latin America Back-To-School Market Value, By Product Type, 2020–2030 ($Million)
Table 66.Latin America Back-To-School Market Value, By Distribution Channel, 2020–2030 ($Million)
Table 67.Middle East Back-To-School Market Value, By Product Type, 2020–2030 ($Million)
Table 68.Middle East Back-To-School Market Value, By Distribution Channel, 2020–2030 ($Million)
Table 69.Africa Back-To-School Market Value, By Product Type, 2020–2030 ($Million)
Table 70.Africa Back-To-School Market Value, By Distribution Channel, 2020–2030 ($Million)
Table 71.Acco Brands: Key Executives
Table 72.Acco Brands: Company Snapshot
Table 73.Acco Brands: Operating Segments
Table 74.Acco Brands: Product Portfolio
Table 75.Acco Brands: R&D Expenditure, 2018–2020 ($Million)
Table 76.Acco Brands: Net Sales, 2018–2020 ($Million)
Table 77.Faber-Castell : Key Executives
Table 78.Faber-Castell : Company Snapshot
Table 79.Faber-Castell : Product Portfolio
Table 80.Itc Limited: Key Executives
Table 81.Itc Limited: Company Snapshot
Table 82.Itc Limited: Operating Segments
Table 83.Itc Limited: Product Portfolio
Table 84.Itc Limited: R&D Expenditure, 2018–2020 ($Million)
Table 85.Itc Limited: Net Sales, 2018–2020 ($Million)
Table 86.Kokuyo Camlin Ltd.: Key Executives
Table 87.Kokuyo Camlin Ltd.: Company Snapshot
Table 88.Kokuyo Camlin Ltd.: Product Portfolio
Table 89.Kokuyo Camlin Ltd.: R&D Expenditure, 2018–2020 ($Million)
Table 90.Kokuyo Camlin Ltd.: Net Sales, 2018–2020 ($Million)
Table 91.Mitsubishi Pencil Co., Ltd.: Key Executives
Table 92.Mitsubishi Pencil Co., Ltd.: Company Snapshot
Table 93.Mitsubishi Pencil Co., Ltd.: Product Portfolio
Table 94.Mitsubishi Pencil Co., Ltd.: Net Sales, 2018–2020 ($Million)
Table 95.Pelikan International Corporation Berhad: Key Executives
Table 96.Pelikan International Corporation Berhad: Company Snapshot
Table 97.Pelikan International Corporation Berhad: Operating Segments
Table 98.Pelikan International Corporation Berhad: Product Portfolio
Table 99.Pelikan International Corporation Berhad: R&D Expenditure, 2018–2020 ($Million)
Table 100.Pelikan International Corporation Berhad: Net Sales, 2018–2020 ($Million)
Table 101.Schwan-Stabilo: Key Executives
Table 102.Schwan-Stabilo: Company Snapshot
Table 103.Schwan-Stabilo: Product Portfolio
Table 104.Stadetler: Key Executives
Table 105.Stadetler: Company Snapshot
Table 106.Stadetler: Product Portfolio
Table 107.Wh Smith Plc: Key Executives
Table 108.Wh Smith Plc: Company Snapshot
Table 109.Wh Smith Plc: Operating Segments
Table 110.Wh Smith Plc: Product Portfolio
Table 111.Wh Smith Plc: Net Sales, 2018–2020 ($Million)
Table 112.Zebra Pen Corp.: Key Executives
Table 113.Zebra Pen Corp.: Company Snapshot
Table 114.Zebra Pen Corp.: Product Portfolio
List Of Figures
Figure 01.Key Market Segments
Figure 02.Global Back-To-School Market Snapshot, 2021–2030
Figure 03.Top Impacting Factors
Figure 04.Top Investment Pockets
Figure 05.Moderate Bargaining Power Of Suppliers
Figure 06.Moderate Bargaining Power Of Buyers
Figure 07.High Threat Of Substitution
Figure 08.Moderate Threat Of New Entrants
Figure 09.High Intensity Of Competitive Rivalry
Figure 10.Back-To-School Market, By Product Type, 2020 (%)
Figure 11.Comparative Value Share Analysis Of Back-To-School Market For Backpack, By Country, 2020 & 2030 (%)
Figure 12.Comparative Value Share Analysis Of Back-To-School Market For Electronics, By Country, 2020 & 2030 (%)
Figure 13.Comparative Value Share Analysis Of Back-To-School Market For Stationery, By Country, 2020 & 2030 (%)
Figure 14.Comparative Value Share Analysis Of Back-To-School Market For Clothing, By Country, 2020 & 2030 (%)
Figure 15.Comparative Value Share Analysis Of Back-To-School Market For Shoes, By Country, 2020 & 2030 (%)
Figure 16.Figure 15. Comparative Value Share Analysis Of Back-To-School Market For Others, By Country, 2020 & 2030 (%)
Figure 17.Back-To-School Market, By Distribution Channel, 2020 (%)
Figure 18.Comparative Value Share Analysis Of Back-To-School For Hypermarket/Supermarket Industry, By Country, 2020 & 2030 (%)
Figure 19.Comparative Value Share Analysis Of Back-To-School Market For E-Commerce, By Country, 2020 & 2030 (%)
Figure 20.Comparative Value Share Analysis Of Back To School For Dollar Stores, By Country, 2020 & 2030 (%)
Figure 21.Comparative Value Share Analysis Of Back To School Sales For Specialty Stores, By Country, 2020 & 2030 (%)
Figure 22.Comparative Value Share Analysis Of Back To School Sales For Others, By Country, 2020 & 2030 (%)
Figure 23.Back-To-School Market, By Region 2020 (%)
Figure 24.U.S. Back-To-School Market Value, 2020-2030 ($Million)
Figure 25.Canada Back-To-School Market Value, 2020-2030 ($Million)
Figure 26.Mexico Back-To-School Market Value, 2020-2030 ($Million)
Figure 27.Uk Back-To-School Market Value, 2020-2030 ($Million)
Figure 28.Germany Back-To-School Market Value, 2020-2030 ($Million)
Figure 29.France Back-To-School Market Value, 2020-2030 ($Million)
Figure 30.Italy Back-To-School Market Value, 2020-2030 ($Million)
Figure 31.Spain Back-To-School Market Value, 2020-2030 ($Million)
Figure 32.Rest Of Europe Back-To-School Market Value, 2020-2030 ($Million)
Figure 33.China Back-To-School Market Value, 2020-2030 ($Million)
Figure 34.India Back-To-School Market Value, 2020-2030 ($Million)
Figure 35.Japan Back-To-School Market Value, 2020-2030 ($Million)
Figure 36.Australia Back-To-School Market Value, 2020-2030 ($Million)
Figure 37.South Korea Back-To-School Market Value, 2020-2030 ($Million)
Figure 38.Indonesia Back-To-School Market Value, 2020-2030 ($Million)
Figure 39.Malaysia Back-To-School Market Value, 2020-2030 ($Million)
Figure 40.Singapore Back-To-School Market Value, 2020-2030 ($Million)
Figure 41.Vietnam Back-To-School Market Value, 2020-2030 ($Million)
Figure 42.Rest Of Asia-Pacific Back-To-School Market Value, 2020-2030 ($Million)
Figure 43.Latin America Back-To-School Market Value, 2020-2030 ($Million)
Figure 44.Middle East Back-To-School Market Value, 2020-2030 ($Million)
Figure 45.Africa Back-To-School Market Value, 2020-2030 ($Million)
Figure 46.Competitive Dashboard Of Top 10 Key Players
Figure 47.Competitive Heatmap Of Top 10 Key Players
Figure 48.Product Mapping Of Top 10 Key Players
Figure 49.Top Winning Strategies, By Year, 2018–2021*
Figure 50.Top Winning Strategies, By Development, 2018–2021* (%)
Figure 51.Top Winning Strategies, By Company, 2018–2021*
Figure 52.Player Positioning Of Top 10 Key Players
Figure 53.Acco Brands: R&D Expenditure, 2018–2020 ($Million)
Figure 54.Acco Brands: Net Sales, 2018–2020 ($Million)
Figure 55.Acco Brands: Revenue Share By Segment, 20120 (%)
Figure 56.Acco Brands: Revenue Share By Region, 2020 (%)
Figure 57.Itc Limited: R&D Expenditure, 2018–2020 ($Million)
Figure 58.Itc Limited: Net Sales, 2018–2020 ($Million)
Figure 59.Itc Limited: Revenue Share By Segment, 2020 (%)
Figure 60.Itc Limited: Revenue Share By Region, 2020 (%)
Figure 61.Kokuyo Camlin Ltd.: R&D Expenditure, 2018–2020 ($Million)
Figure 62.Kokuyo Camlin Ltd.: Net Sales, 2018–2020 ($Million)
Figure 63.Mitsubishi Pencil Co., Ltd.: Net Sales, 2018–2020 ($Million)
Figure 64.Pelikan International Corporation Berhad: R&D Expenditure, 2018–2020 ($Million)
Figure 65.Pelikan International Corporation Berhad: Net Sales, 2018–2020 ($Million)
Figure 66.Pelikan International Corporation Berhad: Revenue Share By Segment, 2019 (%)
Figure 67.Schwan-Stabilo: Revenue Share By Segment, 2019 (%)
Figure 68.Wh Smith Plc: Net Sales, 2018–2020 ($Million)
Figure 69.Wh Smith Plc: Revenue Share By Segment, 2020 (%)
$6169
$10665
HAVE A QUERY?
OUR CUSTOMER
