
EdTech Market Statistics 2028
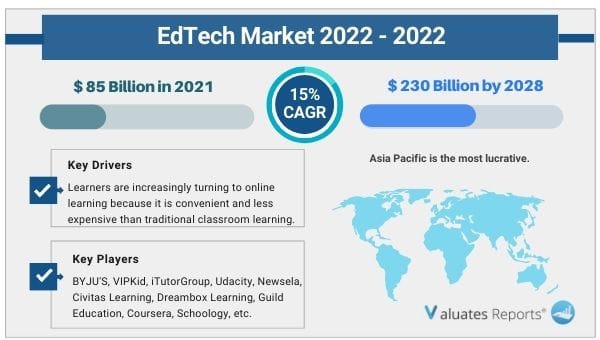
The global EdTech market size was valued at USD 85 billion in 2021, it is expected to reach over 230 billion U.S. dollars by 2028, growing at a CAGR of 15% during 2022-2028. Learners are increasingly choosing online learning over traditional classroom learning because it is more convenient and less expensive. The edtech market is expected to grow as a result of these factors. Furthermore, due to the recent COVID-19 outbreak, all educational institutions have been forced to adopt an online learning model, which has aided the edtech market's growth.
Personalized learning, the growth of gamification, the adoption of the hybrid model, improvements in connectivity infrastructure and smartphone penetration, and growing investments by private equity and venture capital are some of the other edtech trends.
Trends Influencing the Growth of the EdTech Market
Online learning platforms provide a flexible environment by allowing students to learn at their own pace and allowing educators to use digital resources to make learning more interesting and collaborative. Adaptive learning is a type of Edtech that tailors study materials to a student's abilities and knowledge level. Adaptive exams can assist teachers in determining what obstacles each student faces and focusing on those in order to smooth out the bumps. With adaptive learning, students are actively engaged in their learning, resulting in the best possible outcomes. This, in turn, is expected to propel the edtech market forward.
The edtech market is expected to grow due to the rise of gamification. Engaging students is especially important in situations where there is less direct interaction with teachers and classmates. Because it improves the appeal of learning processes, innovation, fun, productivity, the ability to retain knowledge, and the ability to learn new skills, gamification is the preferred training methodology for keeping students engaged. This technique refers to the application of thought and game techniques in non-entertainment settings such as education or work.
Offline learning will continue in schools, but a hybrid learning model will be the way to go. The educational digital revolution has been in the works for quite some time, and the pandemic has only accelerated it. Students value the convenience and cost-effectiveness of online learning, especially now that the Internet is widely available on mobile devices. This, in turn, is expected to propel the edtech market forward. This behavioral shift benefits even teachers who were previously confined to their neighborhoods because they can now teach students from all over the world.
The digital form of education is expected to benefit students of all ages, socioeconomic backgrounds, and geographic locations. The digital form of education is expected to benefit students of all ages, socioeconomic backgrounds, and geographic locations. Advanced technologies such as artificial intelligence (AI) and augmented reality (AR) are expected to drive the digital education market during the forecasted period, fostering education through game-based learning (gamification), hybrid models, and mobile-based learning, and attracting a large number of investors to invest.
EdTech Market Share Analysis
Based on application, The most profitable segment is expected to be K-12. The high percentage can be attributed to the growing trend of game-based learning in K-12 education. The majority of K-12 teachers support gamification initiatives in schools that incorporate practical, project-based work to help students improve their math learning skills.
Based on type, The most profitable segment is expected to be K-12. The growing popularity of digital classrooms in the education sector can be attributed to the high percentage. For example, interactive whiteboards are becoming more popular and provide a better experience. The features include dry-erase surfaces, digital pens, communication software, and other multi-touch options. Users can also save and share notes on a variety of digital devices, such as tablets, smartphones, and laptops.
Based on region, The most profitable region is expected to be the Asia Pacific. The increased use of the internet and smart devices by the general public can be attributed to this increase. In recent years, developing countries such as India have seen an increase in affordable broadband connectivity, which has resulted in a slew of new businesses reaching out to the populace. Furthermore, in developing countries, stakeholders in the education sector are increasingly turning to technology to help bridge the gap between educational infrastructure and teaching resources.
| Report Metric | Details |
| Report Name | Edtech Market |
| The market size in 2021 | USD 85 Billion |
| The revenue forecast in 2028 | USD 230 Billion |
| Growth Rate | Compound Annual Growth Rate (CAGR) of 15% from 2022 to 2028 |
| Market size available for years | 2022-2028 |
| Forecast units | Value (USD) |
| Segments covered | Type, Application & Regions |
| Report coverage | Revenue & volume forecast, company share, competitive landscape, growth factors, and trends |
| Geographic regions covered | North America, Europe, Asia Pacific, Latin America, Middle East & Africa |
Ans. The global EdTech market size was valued at USD 85 billion in 2021, it is expected to reach over 230 billion U.S. dollars by 2028.
Ans. The global EdTech market is expected to grow at a compound annual growth rate of 15% from 2022 to 2028.
Ans. Some of the major companies are BYJU'S, VIPKid, iTutorGroup, Udacity, Newsela, Civitas Learning, Dreambox Learning, Guild Education, Coursera, Schoology, Instructure, Knewton, 17zuoye, Yuanfudao, Udemy, Age of Learning, HuJiang.
Table of Contents
1 Report Business Overview
1.1 Study Scope
1.2 Market Analysis by Type
1.2.1 Global EdTech Market Size Growth Rate by Type, 2017 VS 2021 VS 2028
1.2.2 Hardware
1.2.3 Software
1.2.4 Content
1.3 Market by Application
1.3.1 Global EdTech Market Size Growth Rate by Application, 2017 VS 2021 VS 2028
1.3.2 Preschool
1.3.3 K-12
1.3.4 Higher Education
1.3.5 Others
1.4 Study Objectives
1.5 Years Considered
2 Global Growth Trends
2.1 Global EdTech Market Perspective (2017-2028)
2.2 EdTech Growth Trends by Region
2.2.1 EdTech Market Size by Region: 2017 VS 2021 VS 2028
2.2.2 EdTech Historic Market Size by Region (2017-2022)
2.2.3 EdTech Forecasted Market Size by Region (2023-2028)
2.3 EdTech Market Dynamics
2.3.1 EdTech Industry Trends
2.3.2 EdTech Market Drivers
2.3.3 EdTech Market Challenges
2.3.4 EdTech Market Restraints
3 Competition Landscape by Key Players
3.1 Global Top EdTech Players by Revenue
3.1.1 Global Top EdTech Players by Revenue (2017-2022)
3.1.2 Global EdTech Revenue Market Share by Players (2017-2022)
3.2 Global EdTech Market Share by Company Type (Tier 1, Tier 2, and Tier 3)
3.3 Players Covered: Ranking by EdTech Revenue
3.4 Global EdTech Market Concentration Ratio
3.4.1 Global EdTech Market Concentration Ratio (CR5 and HHI)
3.4.2 Global Top 10 and Top 5 Companies by EdTech Revenue in 2021
3.5 EdTech Key Players Head office and Area Served
3.6 Key Players EdTech Product Solution and Service
3.7 Date of Enter into EdTech Market
3.8 Mergers & Acquisitions, Expansion Plans
4 EdTech Breakdown Data by Type
4.1 Global EdTech Historic Market Size by Type (2017-2022)
4.2 Global EdTech Forecasted Market Size by Type (2023-2028)
5 EdTech Breakdown Data by Application
5.1 Global EdTech Historic Market Size by Application (2017-2022)
5.2 Global EdTech Forecasted Market Size by Application (2023-2028)
6 North America
6.1 North America EdTech Market Size (2017-2028)
6.2 North America EdTech Market Size by Type
6.2.1 North America EdTech Market Size by Type (2017-2022)
6.2.2 North America EdTech Market Size by Type (2023-2028)
6.2.3 North America EdTech Market Share by Type (2017-2028)
6.3 North America EdTech Market Size by Application
6.3.1 North America EdTech Market Size by Application (2017-2022)
6.3.2 North America EdTech Market Size by Application (2023-2028)
6.3.3 North America EdTech Market Share by Application (2017-2028)
6.4 North America EdTech Market Size by Country
6.4.1 North America EdTech Market Size by Country (2017-2022)
6.4.2 North America EdTech Market Size by Country (2023-2028)
6.4.3 United States
6.4.4 Canada
7 Europe
7.1 Europe EdTech Market Size (2017-2028)
7.2 Europe EdTech Market Size by Type
7.2.1 Europe EdTech Market Size by Type (2017-2022)
7.2.2 Europe EdTech Market Size by Type (2023-2028)
7.2.3 Europe EdTech Market Share by Type (2017-2028)
7.3 Europe EdTech Market Size by Application
7.3.1 Europe EdTech Market Size by Application (2017-2022)
7.3.2 Europe EdTech Market Size by Application (2023-2028)
7.3.3 Europe EdTech Market Share by Application (2017-2028)
7.4 Europe EdTech Market Size by Country
7.4.1 Europe EdTech Market Size by Country (2017-2022)
7.4.2 Europe EdTech Market Size by Country (2023-2028)
7.4.3 Germany
7.4.4 France
7.4.5 U.K.
7.4.6 Italy
7.4.7 Russia
7.4.8 Nordic Countries
8 Asia-Pacific
8.1 Asia-Pacific EdTech Market Size (2017-2028)
8.2 Asia-Pacific EdTech Market Size by Type
8.2.1 Asia-Pacific EdTech Market Size by Type (2017-2022)
8.2.2 Asia-Pacific EdTech Market Size by Type (2023-2028)
8.2.3 Asia-Pacific EdTech Market Share by Type (2017-2028)
8.3 Asia-Pacific EdTech Market Size by Application
8.3.1 Asia-Pacific EdTech Market Size by Application (2017-2022)
8.3.2 Asia-Pacific EdTech Market Size by Application (2023-2028)
8.3.3 Asia-Pacific EdTech Market Share by Application (2017-2028)
8.4 Asia-Pacific EdTech Market Size by Region
8.4.1 Asia-Pacific EdTech Market Size by Region (2017-2022)
8.4.2 Asia-Pacific EdTech Market Size by Region (2023-2028)
8.4.3 China
8.4.4 Japan
8.4.5 South Korea
8.4.6 Southeast Asia
8.4.7 India
8.4.8 Australia
9 Latin America
9.1 Latin America EdTech Market Size (2017-2028)
9.2 Latin America EdTech Market Size by Type
9.2.1 Latin America EdTech Market Size by Type (2017-2022)
9.2.2 Latin America EdTech Market Size by Type (2023-2028)
9.2.3 Latin America EdTech Market Share by Type (2017-2028)
9.3 Latin America EdTech Market Size by Application
9.3.1 Latin America EdTech Market Size by Application (2017-2022)
9.3.2 Latin America EdTech Market Size by Application (2023-2028)
9.3.3 Latin America EdTech Market Share by Application (2017-2028)
9.4 Latin America EdTech Market Size by Country
9.4.1 Latin America EdTech Market Size by Country (2017-2022)
9.4.2 Latin America EdTech Market Size by Country (2023-2028)
9.4.3 Mexico
9.4.4 Brazil
10 Middle East & Africa
10.1 Middle East & Africa EdTech Market Size (2017-2028)
10.2 Middle East & Africa EdTech Market Size by Type
10.2.1 Middle East & Africa EdTech Market Size by Type (2017-2022)
10.2.2 Middle East & Africa EdTech Market Size by Type (2023-2028)
10.2.3 Middle East & Africa EdTech Market Share by Type (2017-2028)
10.3 Middle East & Africa EdTech Market Size by Application
10.3.1 Middle East & Africa EdTech Market Size by Application (2017-2022)
10.3.2 Middle East & Africa EdTech Market Size by Application (2023-2028)
10.3.3 Middle East & Africa EdTech Market Share by Application (2017-2028)
10.4 Middle East & Africa EdTech Market Size by Country
10.4.1 Middle East & Africa EdTech Market Size by Country (2017-2022)
10.4.2 Middle East & Africa EdTech Market Size by Country (2023-2028)
10.4.3 Turkey
10.4.4 Saudi Arabia
10.4.5 UAE
11 Key Players Profiles
11.1 BYJU'S
11.1.1 BYJU'S Company Details
11.1.2 BYJU'S Business Overview
11.1.3 BYJU'S EdTech Introduction
11.1.4 BYJU'S Revenue in EdTech Business (2017-2022)
11.1.5 BYJU'S Recent Developments
11.2 VIPKid
11.2.1 VIPKid Company Details
11.2.2 VIPKid Business Overview
11.2.3 VIPKid EdTech Introduction
11.2.4 VIPKid Revenue in EdTech Business (2017-2022)
11.2.5 VIPKid Recent Developments
11.3 iTutorGroup
11.3.1 iTutorGroup Company Details
11.3.2 iTutorGroup Business Overview
11.3.3 iTutorGroup EdTech Introduction
11.3.4 iTutorGroup Revenue in EdTech Business (2017-2022)
11.3.5 iTutorGroup Recent Developments
11.4 Udacity
11.4.1 Udacity Company Details
11.4.2 Udacity Business Overview
11.4.3 Udacity EdTech Introduction
11.4.4 Udacity Revenue in EdTech Business (2017-2022)
11.4.5 Udacity Recent Developments
11.5 Newsela
11.5.1 Newsela Company Details
11.5.2 Newsela Business Overview
11.5.3 Newsela EdTech Introduction
11.5.4 Newsela Revenue in EdTech Business (2017-2022)
11.5.5 Newsela Recent Developments
11.6 Civitas Learning
11.6.1 Civitas Learning Company Details
11.6.2 Civitas Learning Business Overview
11.6.3 Civitas Learning EdTech Introduction
11.6.4 Civitas Learning Revenue in EdTech Business (2017-2022)
11.6.5 Civitas Learning Recent Developments
11.7 Dreambox Learning
11.7.1 Dreambox Learning Company Details
11.7.2 Dreambox Learning Business Overview
11.7.3 Dreambox Learning EdTech Introduction
11.7.4 Dreambox Learning Revenue in EdTech Business (2017-2022)
11.7.5 Dreambox Learning Recent Developments
11.8 Guild Education
11.8.1 Guild Education Company Details
11.8.2 Guild Education Business Overview
11.8.3 Guild Education EdTech Introduction
11.8.4 Guild Education Revenue in EdTech Business (2017-2022)
11.8.5 Guild Education Recent Developments
11.9 Coursera
11.9.1 Coursera Company Details
11.9.2 Coursera Business Overview
11.9.3 Coursera EdTech Introduction
11.9.4 Coursera Revenue in EdTech Business (2017-2022)
11.9.5 Coursera Recent Developments
11.10 Schoology
11.10.1 Schoology Company Details
11.10.2 Schoology Business Overview
11.10.3 Schoology EdTech Introduction
11.10.4 Schoology Revenue in EdTech Business (2017-2022)
11.10.5 Schoology Recent Developments
11.11 Instructure
11.11.1 Instructure Company Details
11.11.2 Instructure Business Overview
11.11.3 Instructure EdTech Introduction
11.11.4 Instructure Revenue in EdTech Business (2017-2022)
11.11.5 Instructure Recent Developments
11.12 Knewton
11.12.1 Knewton Company Details
11.12.2 Knewton Business Overview
11.12.3 Knewton EdTech Introduction
11.12.4 Knewton Revenue in EdTech Business (2017-2022)
11.12.5 Knewton Recent Developments
11.13 17zuoye
11.13.1 17zuoye Company Details
11.13.2 17zuoye Business Overview
11.13.3 17zuoye EdTech Introduction
11.13.4 17zuoye Revenue in EdTech Business (2017-2022)
11.13.5 17zuoye Recent Developments
11.14 Yuanfudao
11.14.1 Yuanfudao Company Details
11.14.2 Yuanfudao Business Overview
11.14.3 Yuanfudao EdTech Introduction
11.14.4 Yuanfudao Revenue in EdTech Business (2017-2022)
11.14.5 Yuanfudao Recent Developments
11.15 Udemy
11.15.1 Udemy Company Details
11.15.2 Udemy Business Overview
11.15.3 Udemy EdTech Introduction
11.15.4 Udemy Revenue in EdTech Business (2017-2022)
11.15.5 Udemy Recent Developments
11.16 Age of Learning
11.16.1 Age of Learning Company Details
11.16.2 Age of Learning Business Overview
11.16.3 Age of Learning EdTech Introduction
11.16.4 Age of Learning Revenue in EdTech Business (2017-2022)
11.16.5 Age of Learning Recent Developments
11.17 HuJiang
11.17.1 HuJiang Company Details
11.17.2 HuJiang Business Overview
11.17.3 HuJiang EdTech Introduction
11.17.4 HuJiang Revenue in EdTech Business (2017-2022)
11.17.5 HuJiang Recent Developments
12 Analyst's Viewpoints/Conclusions
13 Appendix
13.1 Research Methodology
13.1.1 Methodology/Research Approach
13.1.2 Data Source
13.2 Author Details
13.3 Disclaimer
Tables & Figures :
Table 1. Global EdTech Market Size Growth Rate by Type (US$ Million), 2017 VS 2021 VS 2028
Table 2. Key Players of Hardware
Table 3. Key Players of Software
Table 4. Key Players of Content
Table 5. Global EdTech Market Size Growth Rate by Application (US$ Million), 2017 VS 2021 VS 2028
Table 6. Global EdTech Market Size by Region (US$ Million): 2017 VS 2021 VS 2028
Table 7. Global EdTech Market Size by Region (2017-2022) & (US$ Million)
Table 8. Global EdTech Market Share by Region (2017-2022)
Table 9. Global EdTech Forecasted Market Size by Region (2023-2028) & (US$ Million)
Table 10. Global EdTech Market Share by Region (2023-2028)
Table 11. EdTech Market Trends
Table 12. EdTech Market Drivers
Table 13. EdTech Market Challenges
Table 14. EdTech Market Restraints
Table 15. Global EdTech Revenue by Players (2017-2022) & (US$ Million)
Table 16. Global EdTech Revenue Share by Players (2017-2022)
Table 17. Global Top EdTech by Company Type (Tier 1, Tier 2, and Tier 3) & (based on the Revenue in EdTech as of 2021)
Table 18. Ranking of Global Top EdTech Companies by Revenue (US$ Million) in 2021
Table 19. Global 5 Largest Players Market Share by EdTech Revenue (CR5 and HHI) & (2017-2022)
Table 20. Key Players Headquarters and Area Served
Table 21. Key Players EdTech Product Solution and Service
Table 22. Date of Enter into EdTech Market
Table 23. Mergers & Acquisitions, Expansion Plans
Table 24. Global EdTech Market Size by Type (2017-2022) & (US$ Million)
Table 25. Global EdTech Revenue Market Share by Type (2017-2022)
Table 26. Global EdTech Forecasted Market Size by Type (2023-2028) & (US$ Million)
Table 27. Global EdTech Revenue Market Share by Type (2023-2028)
Table 28. Global EdTech Market Size by Application (2017-2022) & (US$ Million)
Table 29. Global EdTech Revenue Share by Application (2017-2022)
Table 30. Global EdTech Forecasted Market Size by Application (2023-2028) & (US$ Million)
Table 31. Global EdTech Revenue Share by Application (2023-2028)
Table 32. North America EdTech Market Size by Type (2017-2022) & (US$ Million)
Table 33. North America EdTech Market Size by Type (2023-2028) & (US$ Million)
Table 34. North America EdTech Market Size by Application (2017-2022) & (US$ Million)
Table 35. North America EdTech Market Size by Application (2023-2028) & (US$ Million)
Table 36. North America EdTech Market Size by Country (2017-2022) & (US$ Million)
Table 37. North America EdTech Market Size by Country (2023-2028) & (US$ Million)
Table 38. Europe EdTech Market Size by Type (2017-2022) & (US$ Million)
Table 39. Europe EdTech Market Size by Type (2023-2028) & (US$ Million)
Table 40. Europe EdTech Market Size by Application (2017-2022) & (US$ Million)
Table 41. Europe EdTech Market Size by Application (2023-2028) & (US$ Million)
Table 42. Europe EdTech Market Size by Country (2017-2022) & (US$ Million)
Table 43. Europe EdTech Market Size by Country (2023-2028) & (US$ Million)
Table 44. Asia Pacific EdTech Market Size by Type (2017-2022) & (US$ Million)
Table 45. Asia Pacific EdTech Market Size by Type (2023-2028) & (US$ Million)
Table 46. Asia Pacific EdTech Market Size by Application (2017-2022) & (US$ Million)
Table 47. Asia Pacific EdTech Market Size by Application (2023-2028) & (US$ Million)
Table 48. Asia Pacific EdTech Market Size by Region (2017-2022) & (US$ Million)
Table 49. Asia Pacific EdTech Market Size by Region (2023-2028) & (US$ Million)
Table 50. Latin America EdTech Market Size by Type (2017-2022) & (US$ Million)
Table 51. Latin America EdTech Market Size by Type (2023-2028) & (US$ Million)
Table 52. Latin America EdTech Market Size by Application (2017-2022) & (US$ Million)
Table 53. Latin America EdTech Market Size by Application (2023-2028) & (US$ Million)
Table 54. Latin America EdTech Market Size by Country (2017-2022) & (US$ Million)
Table 55. Latin America EdTech Market Size by Country (2023-2028) & (US$ Million)
Table 56. Middle East and Africa EdTech Market Size by Type (2017-2022) & (US$ Million)
Table 57. Middle East and Africa EdTech Market Size by Type (2023-2028) & (US$ Million)
Table 58. Middle East and Africa EdTech Market Size by Application (2017-2022) & (US$ Million)
Table 59. Middle East and Africa EdTech Market Size by Application (2023-2028) & (US$ Million)
Table 60. Middle East and Africa EdTech Market Size by Country (2017-2022) & (US$ Million)
Table 61. Middle East and Africa EdTech Market Size by Country (2023-2028) & (US$ Million)
Table 62. BYJU'S Company Details
Table 63. BYJU'S Business Overview
Table 64. BYJU'S EdTech Product
Table 65. BYJU'S Revenue in EdTech Business (2017-2022) & (US$ Million)
Table 66. BYJU'S Recent Developments
Table 67. VIPKid Company Details
Table 68. VIPKid Business Overview
Table 69. VIPKid EdTech Product
Table 70. VIPKid Revenue in EdTech Business (2017-2022) & (US$ Million)
Table 71. VIPKid Recent Developments
Table 72. iTutorGroup Company Details
Table 73. iTutorGroup Business Overview
Table 74. iTutorGroup EdTech Product
Table 75. iTutorGroup Revenue in EdTech Business (2017-2022) & (US$ Million)
Table 76. iTutorGroup Recent Developments
Table 77. Udacity Company Details
Table 78. Udacity Business Overview
Table 79. Udacity EdTech Product
Table 80. Udacity Revenue in EdTech Business (2017-2022) & (US$ Million)
Table 81. Udacity Recent Developments
Table 82. Newsela Company Details
Table 83. Newsela Business Overview
Table 84. Newsela EdTech Product
Table 85. Newsela Revenue in EdTech Business (2017-2022) & (US$ Million)
Table 86. Newsela Recent Developments
Table 87. Civitas Learning Company Details
Table 88. Civitas Learning Business Overview
Table 89. Civitas Learning EdTech Product
Table 90. Civitas Learning Revenue in EdTech Business (2017-2022) & (US$ Million)
Table 91. Civitas Learning Recent Developments
Table 92. Dreambox Learning Company Details
Table 93. Dreambox Learning Business Overview
Table 94. Dreambox Learning EdTech Product
Table 95. Dreambox Learning Revenue in EdTech Business (2017-2022) & (US$ Million)
Table 96. Dreambox Learning Recent Developments
Table 97. Guild Education Company Details
Table 98. Guild Education Business Overview
Table 99. Guild Education EdTech Product
Table 100. Guild Education Revenue in EdTech Business (2017-2022) & (US$ Million)
Table 101. Guild Education Recent Developments
Table 102. Coursera Company Details
Table 103. Coursera Business Overview
Table 104. Coursera EdTech Product
Table 105. Coursera Revenue in EdTech Business (2017-2022) & (US$ Million)
Table 106. Coursera Recent Developments
Table 107. Schoology Company Details
Table 108. Schoology Business Overview
Table 109. Schoology EdTech Product
Table 110. Schoology Revenue in EdTech Business (2017-2022) & (US$ Million)
Table 111. Schoology Recent Developments
Table 112. Instructure Company Details
Table 113. Instructure Business Overview
Table 114. Instructure EdTech Product
Table 115. Instructure Revenue in EdTech Business (2017-2022) & (US$ Million)
Table 116. Instructure Recent Developments
Table 117. Knewton Company Details
Table 118. Knewton Business Overview
Table 119. Knewton EdTech Product
Table 120. Knewton Revenue in EdTech Business (2017-2022) & (US$ Million)
Table 121. Knewton Recent Developments
Table 122. 17zuoye Company Details
Table 123. 17zuoye Business Overview
Table 124. 17zuoye EdTech Product
Table 125. 17zuoye Revenue in EdTech Business (2017-2022) & (US$ Million)
Table 126. 17zuoye Recent Developments
Table 127. Yuanfudao Company Details
Table 128. Yuanfudao Business Overview
Table 129. Yuanfudao EdTech Product
Table 130. Yuanfudao Revenue in EdTech Business (2017-2022) & (US$ Million)
Table 131. Yuanfudao Recent Developments
Table 132. Udemy Company Details
Table 133. Udemy Business Overview
Table 134. Udemy EdTech Product
Table 135. Udemy Revenue in EdTech Business (2017-2022) & (US$ Million)
Table 136. Udemy Recent Developments
Table 137. Age of Learning Company Details
Table 138. Age of Learning Business Overview
Table 139. Age of Learning EdTech Product
Table 140. Age of Learning Revenue in EdTech Business (2017-2022) & (US$ Million)
Table 141. Age of Learning Recent Developments
Table 142. HuJiang Company Details
Table 143. HuJiang Business Overview
Table 144. HuJiang EdTech Product
Table 145. HuJiang Revenue in EdTech Business (2017-2022) & (US$ Million)
Table 146. HuJiang Recent Developments
Table 147. Research Programs/Design for This Report
Table 148. Key Data Information from Secondary Sources
Table 149. Key Data Information from Primary Sources
List of Figures
Figure 1. Global EdTech Market Share by Type: 2021 VS 2028
Figure 2. Hardware Features
Figure 3. Software Features
Figure 4. Content Features
Figure 5. Global EdTech Market Share by Application: 2021 VS 2028
Figure 6. Preschool Case Studies
Figure 7. K-12 Case Studies
Figure 8. Higher Education Case Studies
Figure 9. Others Case Studies
Figure 10. EdTech Report Years Considered
Figure 11. Global EdTech Market Size (US$ Million), Year-over-Year: 2017-2028
Figure 12. Global EdTech Market Size, (US$ Million), 2017 VS 2021 VS 2028
Figure 13. Global EdTech Market Share by Region: 2021 VS 2028
Figure 14. Global EdTech Market Share by Players in 2021
Figure 15. Global Top EdTech Players by Company Type (Tier 1, Tier 2, and Tier 3) & (based on the Revenue in EdTech as of 2021)
Figure 16. The Top 10 and 5 Players Market Share by EdTech Revenue in 2021
Figure 17. North America EdTech Market Size YoY (2017-2028) & (US$ Million)
Figure 18. North America EdTech Market Size Market Share by Type (2017-2028)
Figure 19. North America EdTech Market Size Market Share by Application (2017-2028)
Figure 20. North America EdTech Market Size Share by Country (2017-2028)
Figure 21. United States EdTech Market Size YoY Growth (2017-2028) & (US$ Million)
Figure 22. Canada EdTech Market Size YoY Growth (2017-2028) & (US$ Million)
Figure 23. Europe EdTech Market Size YoY (2017-2028) & (US$ Million)
Figure 24. Europe EdTech Market Size Market Share by Type (2017-2028)
Figure 25. Europe EdTech Market Size Market Share by Application (2017-2028)
Figure 26. Europe EdTech Market Size Share by Country (2017-2028)
Figure 27. Germany EdTech Market Size YoY Growth (2017-2028) & (US$ Million)
Figure 28. France EdTech Market Size YoY Growth (2017-2028) & (US$ Million)
Figure 29. U.K. EdTech Market Size YoY Growth (2017-2028) & (US$ Million)
Figure 30. Italy EdTech Market Size YoY Growth (2017-2028) & (US$ Million)
Figure 31. Russia EdTech Market Size YoY Growth (2017-2028) & (US$ Million)
Figure 32. Nordic Countries EdTech Market Size YoY Growth (2017-2028) & (US$ Million)
Figure 33. Asia-Pacific EdTech Market Size YoY (2017-2028) & (US$ Million)
Figure 34. Asia Pacific EdTech Market Size Market Share by Type (2017-2028)
Figure 35. Asia Pacific EdTech Market Size Market Share by Application (2017-2028)
Figure 36. Asia Pacific EdTech Market Size Share by Region (2017-2028)
Figure 37. China EdTech Market Size YoY Growth (2017-2028) & (US$ Million)
Figure 38. Japan EdTech Market Size YoY Growth (2017-2028) & (US$ Million)
Figure 39. South Korea EdTech Market Size YoY Growth (2017-2028) & (US$ Million)
Figure 40. Southeast Asia EdTech Market Size YoY Growth (2017-2028) & (US$ Million)
Figure 41. India EdTech Market Size YoY Growth (2017-2028) & (US$ Million)
Figure 42. Australia EdTech Market Size YoY Growth (2017-2028) & (US$ Million)
List of Figures
Figure 43. Latin America EdTech Market Size YoY (2017-2028) & (US$ Million)
Figure 44. Latin America EdTech Market Size Market Share by Type (2017-2028)
Figure 45. Latin America EdTech Market Size Market Share by Application (2017-2028)
Figure 46. Latin America EdTech Market Size Share by Country (2017-2028)
Figure 47. Mexico EdTech Market Size YoY Growth (2017-2028) & (US$ Million)
Figure 48. Brazil EdTech Market Size YoY Growth (2017-2028) & (US$ Million)
Figure 49. Middle East & Africa EdTech Market Size YoY (2017-2028) & (US$ Million)
Figure 50. Middle East and Africa EdTech Market Size Market Share by Type (2017-2028)
Figure 51. Middle East and Africa EdTech Market Size Market Share by Application (2017-2028)
Figure 52. Middle East and Africa EdTech Market Size Share by Country (2017-2028)
Figure 53. Turkey EdTech Market Size YoY Growth (2017-2028) & (US$ Million)
Figure 54. Saudi Arabia EdTech Market Size YoY Growth (2017-2028) & (US$ Million)
Figure 55. UAE EdTech Market Size YoY Growth (2017-2028) & (US$ Million)
Figure 56. BYJU'S Revenue Growth Rate in EdTech Business (2017-2022)
Figure 57. VIPKid Revenue Growth Rate in EdTech Business (2017-2022)
Figure 58. iTutorGroup Revenue Growth Rate in EdTech Business (2017-2022)
Figure 59. Udacity Revenue Growth Rate in EdTech Business (2017-2022)
Figure 60. Newsela Revenue Growth Rate in EdTech Business (2017-2022)
Figure 61. Civitas Learning Revenue Growth Rate in EdTech Business (2017-2022)
Figure 62. Dreambox Learning Revenue Growth Rate in EdTech Business (2017-2022)
Figure 63. Guild Education Revenue Growth Rate in EdTech Business (2017-2022)
Figure 64. Coursera Revenue Growth Rate in EdTech Business (2017-2022)
Figure 65. Schoology Revenue Growth Rate in EdTech Business (2017-2022)
Figure 66. Instructure Revenue Growth Rate in EdTech Business (2017-2022)
Figure 67. Knewton Revenue Growth Rate in EdTech Business (2017-2022)
Figure 68. 17zuoye Revenue Growth Rate in EdTech Business (2017-2022)
Figure 69. Yuanfudao Revenue Growth Rate in EdTech Business (2017-2022)
Figure 70. Udemy Revenue Growth Rate in EdTech Business (2017-2022)
Figure 71. Age of Learning Revenue Growth Rate in EdTech Business (2017-2022)
Figure 72. HuJiang Revenue Growth Rate in EdTech Business (2017-2022)
Figure 73. Bottom-up and Top-down Approaches for This Report
Figure 74. Data Triangulation
Figure 75. Key Executives Interviewed
$4900
$9800
HAVE A QUERY?
OUR CUSTOMER

SIMILAR REPORTS