
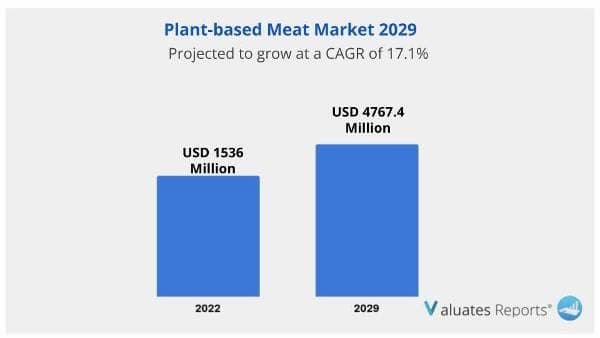
The global Plant-based Meat market was valued at USD 1536 million in 2022 and is anticipated to reach USD 4767.4 million by 2029, witnessing a CAGR of 17.1% during the forecast period 2023-2029. The global increase in vegans and flexitarians, improved public knowledge of the health advantages of plant-based meat over animal meat, increased government initiatives, and considerable financial expenditures have all contributed to the substantial growth of the plant-based meat industry.
Market expansion is anticipated to be fueled by rising consumer interest in plant-based diets and heightened awareness of animal rights thanks to numerous animal welfare organizations. The plant-based meat market is anticipated to grow as a result of worries about greenhouse gases (GHG) produced by the practices of the meat industry.
Plant-based meat is particularly crafted to resemble regular meat in terms of appearance, flavor, and cooking. Artificial meat can take the shape of a burger patty, nuggets, crumbles, or even sausages, and as it becomes more and more popular, the meat industry and everything we thought we knew about veggie burgers is being upended.
Vegetarian diets that exclude animal products and include plant-based meat are growing more and more popular. Vegetarian ingredients are getting more popular among customers who wish to stop animal cruelty and eat sustainable food and beverage products, while veganism is becoming more popular among consumers for ethical and health reasons. The plant-based meat market is predicted to rise as a result of this trend.
As more individuals learn about the health advantages of plant-based meat over animal meat, the market for plant-based meat is expected to expand. As a result of the plant-based trend, people are consuming more fruits, vegetables, legumes, nuts, and seeds. Consumers are becoming more aware of the numerous health advantages of plant-based products recently. Overconsumption of meat from animals has been connected to dietary conditions such as obesity, type 2 diabetes, heart disease, and cancer.
On the other hand, such diseases do not arise from the consumption of plant-based meat. They also aid in the improvement of a stronger immune system. Two key factors that have helped plant-based meats gain public notice and therefore raise their demand are their nutritional advantages and comparative safety to traditional meat.
Leading companies in the sector are working with fast-food chains and networks of restaurants to increase consumer acceptance of their plant-based meat substitutes. The market for plant-based meat is then anticipated to grow as a result. Burgers, sausages, and chicken nuggets made from plants are quickly taking the place of traditionally processed meats in fast-food franchises and restaurant chains.
Furthermore, the plant-based meat market is expanding quickly worldwide, with producers ranging from small start-ups to significant consumer packaged goods (CPG) businesses. Even the largest meat producers in the world are embracing plant-based meat due to its affordability, variety, accessibility, and quality as well as its vegetarian lifestyle.
Beyond Meat and other prominent producers of plant-based meat can be found worldwide. More than 30% of the market share is held by the largest producer.
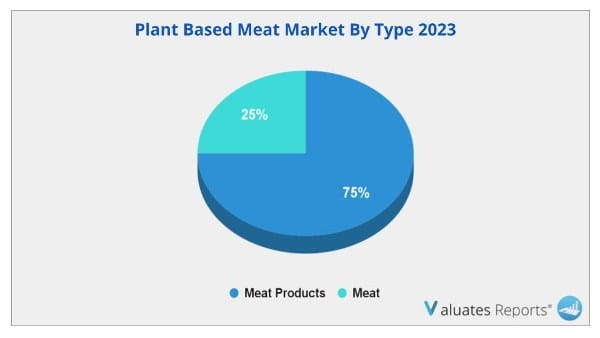
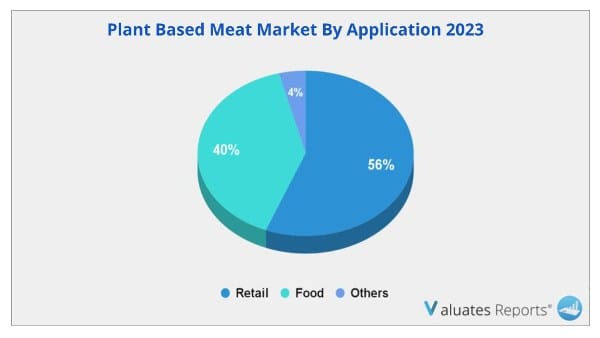
Meat and meat products made up 75% and 25% of them, respectively. Food and retail applications together account for 56% and 40% of all applications.
During the projected period, soy-based meat is anticipated to be the most profitable subsegment. Soy-based meat products not only have lower formulation costs than conventional animal- and dairy-based food items, but they also have a smaller carbon impact. Due to improved eating qualities such as greater microwave ability and sliceability, the product is anticipated to experience increased demand, which will drive up the market as a whole.
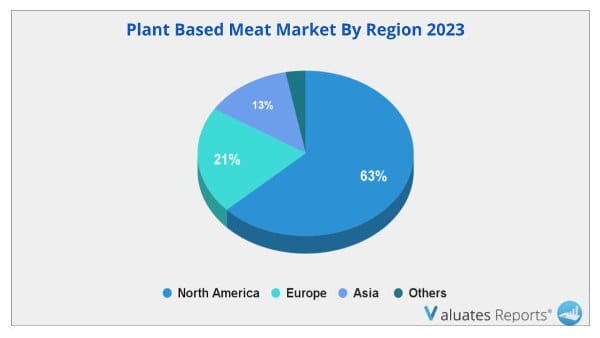
The largest market in the globe is North America, which makes up over 63% of it. Europe and Asia Pacific are next, with 21% and 13% of the market, respectively. The market is expanding in this region as a result of rising vegetarian meat consumption and higher consumer awareness of the risks connected with consuming tainted meat products. Consumer perceptions of food sustainability and safety are expected to change much more as plant-based food consumption rises, especially with regard to plant-based meat.
| Report Metric | Details |
| Report Name | Plant Based Meat Market |
| The market size in 2022 | USD 1536 Million |
| The revenue forecast in 2029 | USD 4767.4 Million |
| Growth Rate | Compound Annual Growth Rate (CAGR) of 17.1% from 2023 to 2029 |
| Market size available for years | 2023-2029 |
| Forecast units | Value (USD) |
| Segments covered | Type, Application & Regions |
| Report coverage | Revenue & volume forecast, company share, competitive landscape, growth factors, and trends |
| Geographic regions covered | North America, Europe, Asia Pacific, Latin America, Middle East & Africa |
Ans. The global Plant-based Meat market was valued at US$ 1536 million in 2022 and is anticipated to reach US$ 4767.4 million by 2029, witnessing a CAGR of 17.1% during the forecast period 2023-2029.
Ans. The global Plant-based Meat market is expected to grow at a compound annual growth rate of 17.1% from 2023 to 2029.
Ans. Some of the major companies are Beyond Meat, Impossible Foods, Turtle Island Foods, Maple Leaf, Yves Veggie Cuisine, Nestle, Kellogg's, Qishan Foods, Hongchang Food, Sulian Food, Starfield, PFI Foods, Fuzhou Sutianxia, Zhen Meat, Vesta Food Lab, Cargill, Unilever, Omnipork.
1 Plant-based Meat Market Overview
1.1 Product Overview and Scope of Plant-based Meat
1.2 Plant-based Meat Segment by Type
1.2.1 Global Plant-based Meat Market Value Comparison by Type (2023-2029)
1.2.2 Meat Products
1.2.3 Meat
1.3 Plant-based Meat Segment by Application
1.3.1 Global Plant-based Meat Market Value by Application: (2023-2029)
1.3.2 Food
1.3.3 Retail
1.3.4 Others
1.4 Global Plant-based Meat Market Size Estimates and Forecasts
1.4.1 Global Plant-based Meat Revenue 2018-2029
1.4.2 Global Plant-based Meat Sales 2018-2029
1.4.3 Global Plant-based Meat Market Average Price (2018-2029)
1.5 Assumptions and Limitations
2 Plant-based Meat Market Competition by Manufacturers
2.1 Global Plant-based Meat Sales Market Share by Manufacturers (2018-2023)
2.2 Global Plant-based Meat Revenue Market Share by Manufacturers (2018-2023)
2.3 Global Plant-based Meat Average Price by Manufacturers (2018-2023)
2.4 Global Plant-based Meat Industry Ranking 2021 VS 2022 VS 2023
2.5 Global Key Manufacturers of Plant-based Meat, Manufacturing Sites & Headquarters
2.6 Global Key Manufacturers of Plant-based Meat, Product Type & Application
2.7 Plant-based Meat Market Competitive Situation and Trends
2.7.1 Plant-based Meat Market Concentration Rate
2.7.2 The Global Top 5 and Top 10 Largest Plant-based Meat Players Market Share by Revenue
2.7.3 Global Plant-based Meat Market Share by Company Type (Tier 1, Tier 2 and Tier 3)
2.8 Manufacturers Mergers & Acquisitions, Expansion Plans
3 Plant-based Meat Retrospective Market Scenario by Region
3.1 Global Plant-based Meat Market Size by Region: 2018 Versus 2022 Versus 2029
3.2 Global Plant-based Meat Global Plant-based Meat Sales by Region: 2018-2029
3.2.1 Global Plant-based Meat Sales by Region: 2018-2023
3.2.2 Global Plant-based Meat Sales by Region: 2024-2029
3.3 Global Plant-based Meat Global Plant-based Meat Revenue by Region: 2018-2029
3.3.1 Global Plant-based Meat Revenue by Region: 2018-2023
3.3.2 Global Plant-based Meat Revenue by Region: 2024-2029
3.4 North America Plant-based Meat Market Facts & Figures by Country
3.4.1 North America Plant-based Meat Market Size by Country: 2018 VS 2022 VS 2029
3.4.2 North America Plant-based Meat Sales by Country (2018-2029)
3.4.3 North America Plant-based Meat Revenue by Country (2018-2029)
3.4.4 United States
3.4.5 Canada
3.5 Europe Plant-based Meat Market Facts & Figures by Country
3.5.1 Europe Plant-based Meat Market Size by Country: 2018 VS 2022 VS 2029
3.5.2 Europe Plant-based Meat Sales by Country (2018-2029)
3.5.3 Europe Plant-based Meat Revenue by Country (2018-2029)
3.5.4 Germany
3.5.5 France
3.5.6 U.K.
3.5.7 Italy
3.5.8 Russia
3.6 Asia Pacific Plant-based Meat Market Facts & Figures by Country
3.6.1 Asia Pacific Plant-based Meat Market Size by Country: 2018 VS 2022 VS 2029
3.6.2 Asia Pacific Plant-based Meat Sales by Country (2018-2029)
3.6.3 Asia Pacific Plant-based Meat Revenue by Country (2018-2029)
3.6.4 China
3.6.5 Japan
3.6.6 South Korea
3.6.7 India
3.6.8 Australia
3.6.9 China Taiwan
3.6.10 Indonesia
3.6.11 Thailand
3.6.12 Malaysia
3.7 Latin America Plant-based Meat Market Facts & Figures by Country
3.7.1 Latin America Plant-based Meat Market Size by Country: 2018 VS 2022 VS 2029
3.7.2 Latin America Plant-based Meat Sales by Country (2018-2029)
3.7.3 Latin America Plant-based Meat Revenue by Country (2018-2029)
3.7.4 Mexico
3.7.5 Brazil
3.7.6 Argentina
3.8 Middle East and Africa Plant-based Meat Market Facts & Figures by Country
3.8.1 Middle East and Africa Plant-based Meat Market Size by Country: 2018 VS 2022 VS 2029
3.8.2 Middle East and Africa Plant-based Meat Sales by Country (2018-2029)
3.8.3 Middle East and Africa Plant-based Meat Revenue by Country (2018-2029)
3.8.4 Turkey
3.8.5 Saudi Arabia
3.8.6 UAE
4 Segment by Type
4.1 Global Plant-based Meat Sales by Type (2018-2029)
4.1.1 Global Plant-based Meat Sales by Type (2018-2023)
4.1.2 Global Plant-based Meat Sales by Type (2024-2029)
4.1.3 Global Plant-based Meat Sales Market Share by Type (2018-2029)
4.2 Global Plant-based Meat Revenue by Type (2018-2029)
4.2.1 Global Plant-based Meat Revenue by Type (2018-2023)
4.2.2 Global Plant-based Meat Revenue by Type (2024-2029)
4.2.3 Global Plant-based Meat Revenue Market Share by Type (2018-2029)
4.3 Global Plant-based Meat Price by Type (2018-2029)
5 Segment by Application
5.1 Global Plant-based Meat Sales by Application (2018-2029)
5.1.1 Global Plant-based Meat Sales by Application (2018-2023)
5.1.2 Global Plant-based Meat Sales by Application (2024-2029)
5.1.3 Global Plant-based Meat Sales Market Share by Application (2018-2029)
5.2 Global Plant-based Meat Revenue by Application (2018-2029)
5.2.1 Global Plant-based Meat Revenue by Application (2018-2023)
5.2.2 Global Plant-based Meat Revenue by Application (2024-2029)
5.2.3 Global Plant-based Meat Revenue Market Share by Application (2018-2029)
5.3 Global Plant-based Meat Price by Application (2018-2029)
6 Key Companies Profiled
6.1 Beyond Meat
6.1.1 Beyond Meat Corporation Information
6.1.2 Beyond Meat Description and Business Overview
6.1.3 Beyond Meat Plant-based Meat Sales, Revenue and Gross Margin (2018-2023)
6.1.4 Beyond Meat Plant-based Meat Product Portfolio
6.1.5 Beyond Meat Recent Developments/Updates
6.2 Impossible Foods
6.2.1 Impossible Foods Corporation Information
6.2.2 Impossible Foods Description and Business Overview
6.2.3 Impossible Foods Plant-based Meat Sales, Revenue and Gross Margin (2018-2023)
6.2.4 Impossible Foods Plant-based Meat Product Portfolio
6.2.5 Impossible Foods Recent Developments/Updates
6.3 Turtle Island Foods
6.3.1 Turtle Island Foods Corporation Information
6.3.2 Turtle Island Foods Description and Business Overview
6.3.3 Turtle Island Foods Plant-based Meat Sales, Revenue and Gross Margin (2018-2023)
6.3.4 Turtle Island Foods Plant-based Meat Product Portfolio
6.3.5 Turtle Island Foods Recent Developments/Updates
6.4 Maple Leaf
6.4.1 Maple Leaf Corporation Information
6.4.2 Maple Leaf Description and Business Overview
6.4.3 Maple Leaf Plant-based Meat Sales, Revenue and Gross Margin (2018-2023)
6.4.4 Maple Leaf Plant-based Meat Product Portfolio
6.4.5 Maple Leaf Recent Developments/Updates
6.5 Yves Veggie Cuisine
6.5.1 Yves Veggie Cuisine Corporation Information
6.5.2 Yves Veggie Cuisine Description and Business Overview
6.5.3 Yves Veggie Cuisine Plant-based Meat Sales, Revenue and Gross Margin (2018-2023)
6.5.4 Yves Veggie Cuisine Plant-based Meat Product Portfolio
6.5.5 Yves Veggie Cuisine Recent Developments/Updates
6.6 Nestle
6.6.1 Nestle Corporation Information
6.6.2 Nestle Description and Business Overview
6.6.3 Nestle Plant-based Meat Sales, Revenue and Gross Margin (2018-2023)
6.6.4 Nestle Plant-based Meat Product Portfolio
6.6.5 Nestle Recent Developments/Updates
6.7 Kellogg's
6.6.1 Kellogg's Corporation Information
6.6.2 Kellogg's Description and Business Overview
6.6.3 Kellogg's Plant-based Meat Sales, Revenue and Gross Margin (2018-2023)
6.4.4 Kellogg's Plant-based Meat Product Portfolio
6.7.5 Kellogg's Recent Developments/Updates
6.8 Qishan Foods
6.8.1 Qishan Foods Corporation Information
6.8.2 Qishan Foods Description and Business Overview
6.8.3 Qishan Foods Plant-based Meat Sales, Revenue and Gross Margin (2018-2023)
6.8.4 Qishan Foods Plant-based Meat Product Portfolio
6.8.5 Qishan Foods Recent Developments/Updates
6.9 Hongchang Food
6.9.1 Hongchang Food Corporation Information
6.9.2 Hongchang Food Description and Business Overview
6.9.3 Hongchang Food Plant-based Meat Sales, Revenue and Gross Margin (2018-2023)
6.9.4 Hongchang Food Plant-based Meat Product Portfolio
6.9.5 Hongchang Food Recent Developments/Updates
6.10 Sulian Food
6.10.1 Sulian Food Corporation Information
6.10.2 Sulian Food Description and Business Overview
6.10.3 Sulian Food Plant-based Meat Sales, Revenue and Gross Margin (2018-2023)
6.10.4 Sulian Food Plant-based Meat Product Portfolio
6.10.5 Sulian Food Recent Developments/Updates
6.11 Starfield
6.11.1 Starfield Corporation Information
6.11.2 Starfield Plant-based Meat Description and Business Overview
6.11.3 Starfield Plant-based Meat Sales, Revenue and Gross Margin (2018-2023)
6.11.4 Starfield Plant-based Meat Product Portfolio
6.11.5 Starfield Recent Developments/Updates
6.12 PFI Foods
6.12.1 PFI Foods Corporation Information
6.12.2 PFI Foods Plant-based Meat Description and Business Overview
6.12.3 PFI Foods Plant-based Meat Sales, Revenue and Gross Margin (2018-2023)
6.12.4 PFI Foods Plant-based Meat Product Portfolio
6.12.5 PFI Foods Recent Developments/Updates
6.13 Fuzhou Sutianxia
6.13.1 Fuzhou Sutianxia Corporation Information
6.13.2 Fuzhou Sutianxia Plant-based Meat Description and Business Overview
6.13.3 Fuzhou Sutianxia Plant-based Meat Sales, Revenue and Gross Margin (2018-2023)
6.13.4 Fuzhou Sutianxia Plant-based Meat Product Portfolio
6.13.5 Fuzhou Sutianxia Recent Developments/Updates
6.14 Zhen Meat
6.14.1 Zhen Meat Corporation Information
6.14.2 Zhen Meat Plant-based Meat Description and Business Overview
6.14.3 Zhen Meat Plant-based Meat Sales, Revenue and Gross Margin (2018-2023)
6.14.4 Zhen Meat Plant-based Meat Product Portfolio
6.14.5 Zhen Meat Recent Developments/Updates
6.15 Vesta Food Lab
6.15.1 Vesta Food Lab Corporation Information
6.15.2 Vesta Food Lab Plant-based Meat Description and Business Overview
6.15.3 Vesta Food Lab Plant-based Meat Sales, Revenue and Gross Margin (2018-2023)
6.15.4 Vesta Food Lab Plant-based Meat Product Portfolio
6.15.5 Vesta Food Lab Recent Developments/Updates
6.16 Cargill
6.16.1 Cargill Corporation Information
6.16.2 Cargill Plant-based Meat Description and Business Overview
6.16.3 Cargill Plant-based Meat Sales, Revenue and Gross Margin (2018-2023)
6.16.4 Cargill Plant-based Meat Product Portfolio
6.16.5 Cargill Recent Developments/Updates
6.17 Unilever
6.17.1 Unilever Corporation Information
6.17.2 Unilever Plant-based Meat Description and Business Overview
6.17.3 Unilever Plant-based Meat Sales, Revenue and Gross Margin (2018-2023)
6.17.4 Unilever Plant-based Meat Product Portfolio
6.17.5 Unilever Recent Developments/Updates
6.18 Omnipork
6.18.1 Omnipork Corporation Information
6.18.2 Omnipork Plant-based Meat Description and Business Overview
6.18.3 Omnipork Plant-based Meat Sales, Revenue and Gross Margin (2018-2023)
6.18.4 Omnipork Plant-based Meat Product Portfolio
6.18.5 Omnipork Recent Developments/Updates
7 Industry Chain and Sales Channels Analysis
7.1 Plant-based Meat Industry Chain Analysis
7.2 Plant-based Meat Key Raw Materials
7.2.1 Key Raw Materials
7.2.2 Raw Materials Key Suppliers
7.3 Plant-based Meat Production Mode & Process
7.4 Plant-based Meat Sales and Marketing
7.4.1 Plant-based Meat Sales Channels
7.4.2 Plant-based Meat Distributors
7.5 Plant-based Meat Customers
8 Plant-based Meat Market Dynamics
8.1 Plant-based Meat Industry Trends
8.2 Plant-based Meat Market Drivers
8.3 Plant-based Meat Market Challenges
8.4 Plant-based Meat Market Restraints
9 Research Finding and Conclusion
10 Methodology and Data Source
10.1 Methodology/Research Approach
10.1.1 Research Programs/Design
10.1.2 Market Size Estimation
10.1.3 Market Breakdown and Data Triangulation
10.2 Data Source
10.2.1 Secondary Sources
10.2.2 Primary Sources
10.3 Author List
10.4 Disclaimer
List of Tables
Table 1. Global Plant-based Meat Market Value Comparison by Type (2023-2029) & (US$ Million)
Table 2. Global Plant-based Meat Market Value Comparison by Application (2023-2029) & (US$ Million)
Table 3. Global Plant-based Meat Market Competitive Situation by Manufacturers in 2022
Table 4. Global Plant-based Meat Sales (Tons) of Key Manufacturers (2018-2023)
Table 5. Global Plant-based Meat Sales Market Share by Manufacturers (2018-2023)
Table 6. Global Plant-based Meat Revenue (US$ Million) by Manufacturers (2018-2023)
Table 7. Global Plant-based Meat Revenue Share by Manufacturers (2018-2023)
Table 8. Global Market Plant-based Meat Average Price (US$/Ton) of Key Manufacturers (2018-2023)
Table 9. Global Key Players of Plant-based Meat, Industry Ranking, 2021 VS 2022 VS 2023
Table 10. Global Key Manufacturers of Plant-based Meat, Manufacturing Sites & Headquarters
Table 11. Global Key Manufacturers of Plant-based Meat, Product Type & Application
Table 12. Global Key Manufacturers of Plant-based Meat, Date of Enter into This Industry
Table 13. Global Manufacturers Market Concentration Ratio (CR5 and HHI)
Table 14. Global Plant-based Meat by Company Type (Tier 1, Tier 2, and Tier 3) & (based on the Revenue in Plant-based Meat as of 2022)
Table 15. Manufacturers Mergers & Acquisitions, Expansion Plans
Table 16. Global Plant-based Meat Market Size by Region (US$ Million): 2018 VS 2022 VS 2029
Table 17. Global Plant-based Meat Sales by Region (2018-2023) & (Tons)
Table 18. Global Plant-based Meat Sales Market Share by Region (2018-2023)
Table 19. Global Plant-based Meat Sales by Region (2024-2029) & (Tons)
Table 20. Global Plant-based Meat Sales Market Share by Region (2024-2029)
Table 21. Global Plant-based Meat Revenue by Region (2018-2023) & (US$ Million)
Table 22. Global Plant-based Meat Revenue Market Share by Region (2018-2023)
Table 23. Global Plant-based Meat Revenue by Region (2024-2029) & (US$ Million)
Table 24. Global Plant-based Meat Revenue Market Share by Region (2024-2029)
Table 25. North America Plant-based Meat Revenue by Country: 2018 VS 2022 VS 2029 (US$ Million)
Table 26. North America Plant-based Meat Sales by Country (2018-2023) & (Tons)
Table 27. North America Plant-based Meat Sales by Country (2024-2029) & (Tons)
Table 28. North America Plant-based Meat Revenue by Country (2018-2023) & (US$ Million)
Table 29. North America Plant-based Meat Revenue by Country (2024-2029) & (US$ Million)
Table 30. Europe Plant-based Meat Revenue by Country: 2018 VS 2022 VS 2029 (US$ Million)
Table 31. Europe Plant-based Meat Sales by Country (2018-2023) & (Tons)
Table 32. Europe Plant-based Meat Sales by Country (2024-2029) & (Tons)
Table 33. Europe Plant-based Meat Revenue by Country (2018-2023) & (US$ Million)
Table 34. Europe Plant-based Meat Revenue by Country (2024-2029) & (US$ Million)
Table 35. Asia Pacific Plant-based Meat Revenue by Region: 2018 VS 2022 VS 2029 (US$ Million)
Table 36. Asia Pacific Plant-based Meat Sales by Region (2018-2023) & (Tons)
Table 37. Asia Pacific Plant-based Meat Sales by Region (2024-2029) & (Tons)
Table 38. Asia Pacific Plant-based Meat Revenue by Region (2018-2023) & (US$ Million)
Table 39. Asia Pacific Plant-based Meat Revenue by Region (2024-2029) & (US$ Million)
Table 40. Latin America Plant-based Meat Revenue by Country: 2018 VS 2022 VS 2029 (US$ Million)
Table 41. Latin America Plant-based Meat Sales by Country (2018-2023) & (Tons)
Table 42. Latin America Plant-based Meat Sales by Country (2024-2029) & (Tons)
Table 43. Latin America Plant-based Meat Revenue by Country (2018-2023) & (US$ Million)
Table 44. Latin America Plant-based Meat Revenue by Country (2024-2029) & (US$ Million)
Table 45. Middle East & Africa Plant-based Meat Revenue by Country: 2018 VS 2022 VS 2029 (US$ Million)
Table 46. Middle East & Africa Plant-based Meat Sales by Country (2018-2023) & (Tons)
Table 47. Middle East & Africa Plant-based Meat Sales by Country (2024-2029) & (Tons)
Table 48. Middle East & Africa Plant-based Meat Revenue by Country (2018-2023) & (US$ Million)
Table 49. Middle East & Africa Plant-based Meat Revenue by Country (2024-2029) & (US$ Million)
Table 50. Global Plant-based Meat Sales (Tons) by Type (2018-2023)
Table 51. Global Plant-based Meat Sales (Tons) by Type (2024-2029)
Table 52. Global Plant-based Meat Sales Market Share by Type (2018-2023)
Table 53. Global Plant-based Meat Sales Market Share by Type (2024-2029)
Table 54. Global Plant-based Meat Revenue (US$ Million) by Type (2018-2023)
Table 55. Global Plant-based Meat Revenue (US$ Million) by Type (2024-2029)
Table 56. Global Plant-based Meat Revenue Market Share by Type (2018-2023)
Table 57. Global Plant-based Meat Revenue Market Share by Type (2024-2029)
Table 58. Global Plant-based Meat Price (US$/Ton) by Type (2018-2023)
Table 59. Global Plant-based Meat Price (US$/Ton) by Type (2024-2029)
Table 60. Global Plant-based Meat Sales (Tons) by Application (2018-2023)
Table 61. Global Plant-based Meat Sales (Tons) by Application (2024-2029)
Table 62. Global Plant-based Meat Sales Market Share by Application (2018-2023)
Table 63. Global Plant-based Meat Sales Market Share by Application (2024-2029)
Table 64. Global Plant-based Meat Revenue (US$ Million) by Application (2018-2023)
Table 65. Global Plant-based Meat Revenue (US$ Million) by Application (2024-2029)
Table 66. Global Plant-based Meat Revenue Market Share by Application (2018-2023)
Table 67. Global Plant-based Meat Revenue Market Share by Application (2024-2029)
Table 68. Global Plant-based Meat Price (US$/Ton) by Application (2018-2023)
Table 69. Global Plant-based Meat Price (US$/Ton) by Application (2024-2029)
Table 70. Beyond Meat Corporation Information
Table 71. Beyond Meat Description and Business Overview
Table 72. Beyond Meat Plant-based Meat Sales (Tons), Revenue (US$ Million), Price (US$/Ton) and Gross Margin (2018-2023)
Table 73. Beyond Meat Plant-based Meat Product
Table 74. Beyond Meat Recent Developments/Updates
Table 75. Impossible Foods Corporation Information
Table 76. Impossible Foods Description and Business Overview
Table 77. Impossible Foods Plant-based Meat Sales (Tons), Revenue (US$ Million), Price (US$/Ton) and Gross Margin (2018-2023)
Table 78. Impossible Foods Plant-based Meat Product
Table 79. Impossible Foods Recent Developments/Updates
Table 80. Turtle Island Foods Corporation Information
Table 81. Turtle Island Foods Description and Business Overview
Table 82. Turtle Island Foods Plant-based Meat Sales (Tons), Revenue (US$ Million), Price (US$/Ton) and Gross Margin (2018-2023)
Table 83. Turtle Island Foods Plant-based Meat Product
Table 84. Turtle Island Foods Recent Developments/Updates
Table 85. Maple Leaf Corporation Information
Table 86. Maple Leaf Description and Business Overview
Table 87. Maple Leaf Plant-based Meat Sales (Tons), Revenue (US$ Million), Price (US$/Ton) and Gross Margin (2018-2023)
Table 88. Maple Leaf Plant-based Meat Product
Table 89. Maple Leaf Recent Developments/Updates
Table 90. Yves Veggie Cuisine Corporation Information
Table 91. Yves Veggie Cuisine Description and Business Overview
Table 92. Yves Veggie Cuisine Plant-based Meat Sales (Tons), Revenue (US$ Million), Price (US$/Ton) and Gross Margin (2018-2023)
Table 93. Yves Veggie Cuisine Plant-based Meat Product
Table 94. Yves Veggie Cuisine Recent Developments/Updates
Table 95. Nestle Corporation Information
Table 96. Nestle Description and Business Overview
Table 97. Nestle Plant-based Meat Sales (Tons), Revenue (US$ Million), Price (US$/Ton) and Gross Margin (2018-2023)
Table 98. Nestle Plant-based Meat Product
Table 99. Nestle Recent Developments/Updates
Table 100. Kellogg's Corporation Information
Table 101. Kellogg's Description and Business Overview
Table 102. Kellogg's Plant-based Meat Sales (Tons), Revenue (US$ Million), Price (US$/Ton) and Gross Margin (2018-2023)
Table 103. Kellogg's Plant-based Meat Product
Table 104. Kellogg's Recent Developments/Updates
Table 105. Qishan Foods Corporation Information
Table 106. Qishan Foods Description and Business Overview
Table 107. Qishan Foods Plant-based Meat Sales (Tons), Revenue (US$ Million), Price (US$/Ton) and Gross Margin (2018-2023)
Table 108. Qishan Foods Plant-based Meat Product
Table 109. Qishan Foods Recent Developments/Updates
Table 110. Hongchang Food Corporation Information
Table 111. Hongchang Food Description and Business Overview
Table 112. Hongchang Food Plant-based Meat Sales (Tons), Revenue (US$ Million), Price (US$/Ton) and Gross Margin (2018-2023)
Table 113. Hongchang Food Plant-based Meat Product
Table 114. Hongchang Food Recent Developments/Updates
Table 115. Sulian Food Corporation Information
Table 116. Sulian Food Description and Business Overview
Table 117. Sulian Food Plant-based Meat Sales (Tons), Revenue (US$ Million), Price (US$/Ton) and Gross Margin (2018-2023)
Table 118. Sulian Food Plant-based Meat Product
Table 119. Sulian Food Recent Developments/Updates
Table 120. Starfield Corporation Information
Table 121. Starfield Description and Business Overview
Table 122. Starfield Plant-based Meat Sales (Tons), Revenue (US$ Million), Price (US$/Ton) and Gross Margin (2018-2023)
Table 123. Starfield Plant-based Meat Product
Table 124. Starfield Recent Developments/Updates
Table 125. PFI Foods Corporation Information
Table 126. PFI Foods Description and Business Overview
Table 127. PFI Foods Plant-based Meat Sales (Tons), Revenue (US$ Million), Price (US$/Ton) and Gross Margin (2018-2023)
Table 128. PFI Foods Plant-based Meat Product
Table 129. PFI Foods Recent Developments/Updates
Table 130. Fuzhou Sutianxia Corporation Information
Table 131. Fuzhou Sutianxia Description and Business Overview
Table 132. Fuzhou Sutianxia Plant-based Meat Sales (Tons), Revenue (US$ Million), Price (US$/Ton) and Gross Margin (2018-2023)
Table 133. Fuzhou Sutianxia Plant-based Meat Product
Table 134. Fuzhou Sutianxia Recent Developments/Updates
Table 135. Zhen Meat Corporation Information
Table 136. Zhen Meat Description and Business Overview
Table 137. Zhen Meat Plant-based Meat Sales (Tons), Revenue (US$ Million), Price (US$/Ton) and Gross Margin (2018-2023)
Table 138. Zhen Meat Plant-based Meat Product
Table 139. Zhen Meat Recent Developments/Updates
Table 140. Vesta Food Lab Corporation Information
Table 141. Vesta Food Lab Description and Business Overview
Table 142. Vesta Food Lab Plant-based Meat Sales (Tons), Revenue (US$ Million), Price (US$/Ton) and Gross Margin (2018-2023)
Table 143. Vesta Food Lab Plant-based Meat Product
Table 144. Vesta Food Lab Recent Developments/Updates
Table 145. Cargill Corporation Information
Table 146. Cargill Description and Business Overview
Table 147. Cargill Plant-based Meat Sales (Tons), Revenue (US$ Million), Price (US$/Ton) and Gross Margin (2018-2023)
Table 148. Cargill Plant-based Meat Product
Table 149. Cargill Recent Developments/Updates
Table 150. Unilever Corporation Information
Table 151. Unilever Description and Business Overview
Table 152. Unilever Plant-based Meat Sales (Tons), Revenue (US$ Million), Price (US$/Ton) and Gross Margin (2018-2023)
Table 153. Unilever Plant-based Meat Product
Table 154. Unilever Recent Developments/Updates
Table 155. Omnipork Corporation Information
Table 156. Omnipork Description and Business Overview
Table 157. Omnipork Plant-based Meat Sales (Tons), Revenue (US$ Million), Price (US$/Ton) and Gross Margin (2018-2023)
Table 158. Omnipork Plant-based Meat Product
Table 159. Omnipork Recent Developments/Updates
Table 160. Key Raw Materials Lists
Table 161. Raw Materials Key Suppliers Lists
Table 162. Plant-based Meat Distributors List
Table 163. Plant-based Meat Customers List
Table 164. Plant-based Meat Market Trends
Table 165. Plant-based Meat Market Drivers
Table 166. Plant-based Meat Market Challenges
Table 167. Plant-based Meat Market Restraints
Table 168. Research Programs/Design for This Report
Table 169. Key Data Information from Secondary Sources
Table 170. Key Data Information from Primary Sources
List of Figures
Figure 1. Product Picture of Plant-based Meat
Figure 2. Global Plant-based Meat Market Value Comparison by Type (2023-2029) & (US$ Million)
Figure 3. Global Plant-based Meat Market Share by Type in 2022 & 2029
Figure 4. Meat Products Product Picture
Figure 5. Meat Product Picture
Figure 6. Global Plant-based Meat Market Value Comparison by Application (2023-2029) & (US$ Million)
Figure 7. Global Plant-based Meat Market Share by Application in 2022 & 2029
Figure 8. Food
Figure 9. Retail
Figure 10. Others
Figure 11. Global Plant-based Meat Revenue, (US$ Million), 2018 VS 2022 VS 2029
Figure 12. Global Plant-based Meat Market Size (2018-2029) & (US$ Million)
Figure 13. Global Plant-based Meat Sales (2018-2029) & (Tons)
Figure 14. Global Plant-based Meat Average Price (US$/Ton) & (2018-2029)
Figure 15. Plant-based Meat Report Years Considered
Figure 16. Plant-based Meat Sales Share by Manufacturers in 2022
Figure 17. Global Plant-based Meat Revenue Share by Manufacturers in 2022
Figure 18. The Global 5 and 10 Largest Plant-based Meat Players: Market Share by Revenue in 2022
Figure 19. Plant-based Meat Market Share by Company Type (Tier 1, Tier 2 and Tier 3): 2018 VS 2022
Figure 20. Global Plant-based Meat Market Size by Region (US$ Million): 2018 VS 2022 VS 2029
Figure 21. North America Plant-based Meat Sales Market Share by Country (2018-2029)
Figure 22. North America Plant-based Meat Revenue Market Share by Country (2018-2029)
Figure 23. United States Plant-based Meat Revenue Growth Rate (2018-2029) & (US$ Million)
Figure 24. Canada Plant-based Meat Revenue Growth Rate (2018-2029) & (US$ Million)
Figure 25. Europe Plant-based Meat Sales Market Share by Country (2018-2029)
Figure 26. Europe Plant-based Meat Revenue Market Share by Country (2018-2029)
Figure 27. Germany Plant-based Meat Revenue Growth Rate (2018-2029) & (US$ Million)
Figure 28. France Plant-based Meat Revenue Growth Rate (2018-2029) & (US$ Million)
Figure 29. U.K. Plant-based Meat Revenue Growth Rate (2018-2029) & (US$ Million)
Figure 30. Italy Plant-based Meat Revenue Growth Rate (2018-2029) & (US$ Million)
Figure 31. Russia Plant-based Meat Revenue Growth Rate (2018-2029) & (US$ Million)
Figure 32. Asia Pacific Plant-based Meat Sales Market Share by Region (2018-2029)
Figure 33. Asia Pacific Plant-based Meat Revenue Market Share by Region (2018-2029)
Figure 34. China Plant-based Meat Revenue Growth Rate (2018-2029) & (US$ Million)
Figure 35. Japan Plant-based Meat Revenue Growth Rate (2018-2029) & (US$ Million)
Figure 36. South Korea Plant-based Meat Revenue Growth Rate (2018-2029) & (US$ Million)
Figure 37. India Plant-based Meat Revenue Growth Rate (2018-2029) & (US$ Million)
Figure 38. Australia Plant-based Meat Revenue Growth Rate (2018-2029) & (US$ Million)
Figure 39. China Taiwan Plant-based Meat Revenue Growth Rate (2018-2029) & (US$ Million)
Figure 40. Indonesia Plant-based Meat Revenue Growth Rate (2018-2029) & (US$ Million)
Figure 41. Thailand Plant-based Meat Revenue Growth Rate (2018-2029) & (US$ Million)
Figure 42. Malaysia Plant-based Meat Revenue Growth Rate (2018-2029) & (US$ Million)
Figure 43. Latin America Plant-based Meat Sales Market Share by Country (2018-2029)
Figure 44. Latin America Plant-based Meat Revenue Market Share by Country (2018-2029)
Figure 45. Mexico Plant-based Meat Revenue Growth Rate (2018-2029) & (US$ Million)
Figure 46. Brazil Plant-based Meat Revenue Growth Rate (2018-2029) & (US$ Million)
Figure 47. Argentina Plant-based Meat Revenue Growth Rate (2018-2029) & (US$ Million)
Figure 48. Middle East & Africa Plant-based Meat Sales Market Share by Country (2018-2029)
Figure 49. Middle East & Africa Plant-based Meat Revenue Market Share by Country (2018-2029)
Figure 50. Turkey Plant-based Meat Revenue Growth Rate (2018-2029) & (US$ Million)
Figure 51. Saudi Arabia Plant-based Meat Revenue Growth Rate (2018-2029) & (US$ Million)
Figure 52. UAE Plant-based Meat Revenue Growth Rate (2018-2029) & (US$ Million)
Figure 53. Global Sales Market Share of Plant-based Meat by Type (2018-2029)
Figure 54. Global Revenue Market Share of Plant-based Meat by Type (2018-2029)
Figure 55. Global Plant-based Meat Price (US$/Ton) by Type (2018-2029)
Figure 56. Global Sales Market Share of Plant-based Meat by Application (2018-2029)
Figure 57. Global Revenue Market Share of Plant-based Meat by Application (2018-2029)
Figure 58. Global Plant-based Meat Price (US$/Ton) by Application (2018-2029)
Figure 59. Plant-based Meat Value Chain
Figure 60. Plant-based Meat Production Process
Figure 61. Channels of Distribution (Direct Vs Distribution)
Figure 62. Distributors Profiles
Figure 63. Bottom-up and Top-down Approaches for This Report
Figure 64. Data Triangulation
Figure 65. Key Executives Interviewed
$2900
$5800
HAVE A QUERY?
OUR CUSTOMER

SIMILAR REPORTS