
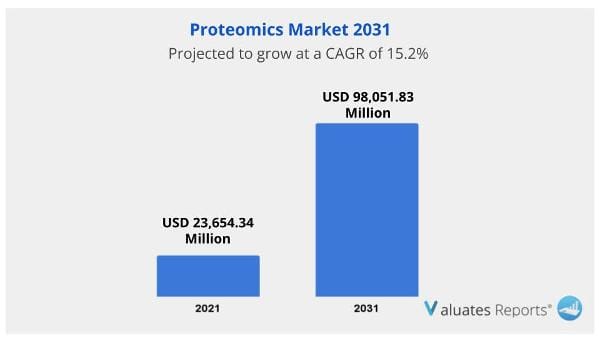
The global Proteomics Market Size was valued at USD 23,654.34 million in 2021 and is projected to reach USD 98,051.83 million by 2031, growing at a CAGR of 15.2% from 2022 to 2031. The market for proteomics will expand as the increasing focus is placed on the use of products in the development of pharmaceuticals, the identification of biomarkers, and clinical diagnostics for the diagnosis and treatment of diseases.
The rise of the proteomics market is further aided by the protein research being done to treat COVID-19 patients. Additionally, the necessity for personalized treatments and increased R&D spending will foster the expansion of the proteomics market.
The practice of treating each patient as an individual has replaced the once-universal science of diagnostic and treatment approaches in medicine. Only genetic analysis is now feasible. However, epigenetic, transcriptional, proteomic, posttranslational, metabolic, and environmental factors can affect a patient's response to the illness and treatment. As more analytical and diagnostic techniques are incorporated into clinical practice, the tailored medicine program develops into precision medicine, offering a thorough grasp of the patient's situation. Proteomics can aid precision medicine due to the high precision and sensitivity of mass spectrometric analysis of proteomes. The proteomics market is anticipated to increase as a result of this factor.
A biomarker is an observable sign of a healthy or unhealthy biological situation in the body. In clinical settings, cancer biomarkers are used to track the development of the disease and how well it responds to therapy. 2D-PAGE is used in the finding of biomarkers. The protein profiles of healthy and diseased cells, including tumor tissues and body fluids, can also be contrasted. Cancer biomarkers are divided into three groups based on their intended uses: diagnostic, prognostic, and predictive. Predictive biomarkers can be used to forecast treatment outcomes. This will therefore fuel the market for proteomics to rise.
Chemical, functional, and clinical proteomics-based techniques are used in the multi-stage, complex process of drug development. Proteomics is now being used for patient therapy and care in addition to medication development. 2-DE cannot be used in the creation of new drugs because it cannot separate the membrane proteins that characterize around 50% of important therapeutic targets. Furthermore, 2-DE cannot detect proteins with low quantities. For drug discovery proteomics, it is essential to comprehend how proteins function and interact with other molecules. These methods ought to allow for the detection of low-abundance proteins and their activity. As a result, phage proteins have been recognized and distinguished utilizing a range of methods, such as protein chips and MS. The market for proteomics is anticipated to grow more rapidly as a result.
Additionally, increased healthcare services, significant government investments in healthcare infrastructure, and proteomics-related R&D operations have become vital tools for small and large businesses globally due to the surge in demand for customized medications for particular ailments. This is expected to aid in the market's expansion. The Proteomics Market Size is being driven by the demand for proteomics in both developed and developing countries, such as China, Brazil, and India.
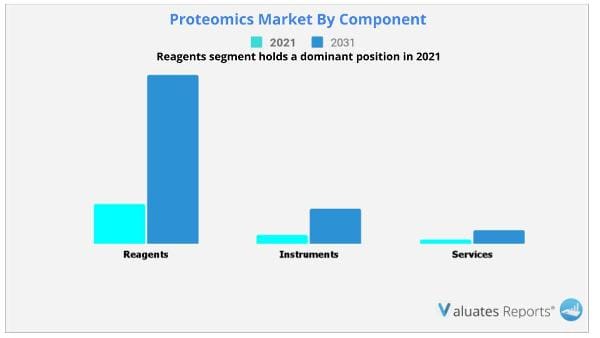
The segment with the largest revenue in 2021 was reagents, and it is anticipated that throughout the forecast period, it would expand at a CAGR of 15.5%. The reagent market has the greatest proteomics market share in 2021 and is predicted to keep its dominance during the forecast period because reagents are widely utilized in academic research institutions and research labs to examine a variety of biological samples. The market is expanding as a result of the rising demand for reagents.
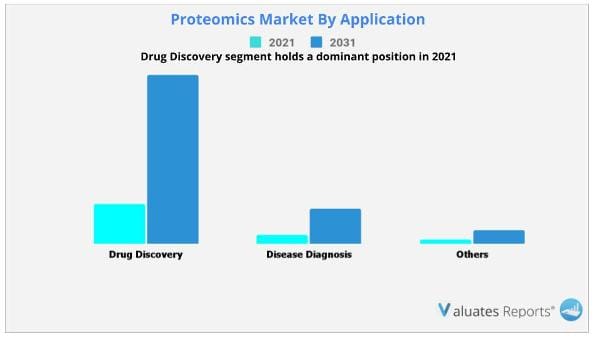
The market for worldwide proteomics applications was driven by the drug discovery sector in 2021, which accounted for roughly 15.8% of the market. The drug discovery industry is expected to continue to rule the world over the forecasted time period, just as it did in 2021. This is because breakthroughs in proteomics have enabled researchers to develop medications that are specifically tailored for different people in order to achieve greater effectiveness and fewer side effects.
North America dominated the proteomics market in 2021, and it is predicted that it would do so again throughout the forecast period. The existence of multiple key companies, a highly established healthcare infrastructure, and an increase in the use of tailored drugs are predicted to fuel market expansion.
Asia-Pacific offers lucrative opportunities for key players operating in the proteomics market due to an increase in the outsourcing of proteomics-based projects, public and private funding for research and development for proteomics studies, favorable government regulations, rising prevalence of target diseases with an aging population, and rising proteomics adoption, which results in registering the fastest growth rate during the forecast period.
Thermo Fisher Scientific Inc., Merck KGaA, Waters Corporation, Bio-Rad Laboratories Inc, Agilent Technologies Inc., Li-Cor Inc, Bruker Corporation, Perkin Elmer Inc, Danaher Corporation, Horiba Ltd.
| Report Metric | Details |
| Report Name | Proteomics Market |
| The market size in 2021 | USD 23,654.34 Million |
| The revenue forecast in 2031 | USD 98,051.83 Million |
| Growth Rate | Compound Annual Growth Rate (CAGR) of 15.2% from 2022 to 2031 |
| Market size available for years | 2022-2031 |
| Forecast units | Value (USD) |
| Segments covered | Service, Industry, Traveler, Regions |
| Report coverage | Revenue & volume forecast, company share, competitive landscape, growth factors, and trends |
| Geographic regions covered | North America, Europe, Asia Pacific, Latin America, Middle East & Africa |
Ans. The global Proteomics Market Size was valued at $23,654.34 million in 2021, and is projected to reach $98,051.83 million by 2031, growing at a CAGR of 15.2% from 2022 to 2031.
Ans. Most of the growth during this period was derived from the Asia-Pacific owing to the rise in prevalence of cancer and chronic diseases and the increase in interest of researchers to utilize proteomics in disease diagnosis & treatment, improving health awareness, rising disposable incomes, as well as the well-established presence of domestic companies in the region.
Ans. The global express delivery market is estimated to grow with a Compound Annual Growth Rate (CAGR) of 15.2% during the forecast period.
Ans. By Application, Drug Discovery segment holds a dominant position in 2021 and would continue to maintain the lead over the forecast period.
Ans. North America segment holds a dominant position in 2021 and would continue to maintain the lead over the forecast period.
Ans. The key players profiled in this report include Thermo Fisher Scientific Inc., Merck KGaA, Waters Corporation, Bio-Rad Laboratories Inc, Agilent Technologies Inc., Li-Cor Inc, Bruker Corporation, Perkin Elmer Inc, Danaher Corporation, Horiba Ltd.
CHAPTER 1:INTRODUCTION
1.1.Report description
1.2.Key market segments
1.3.Key benefits to the stakeholders
1.4.Research Methodology
1.4.1.Secondary research
1.4.2.Primary research
1.4.3.Analyst tools and models
CHAPTER 2:EXECUTIVE SUMMARY
2.1.Key findings of the study
2.2.CXO Perspective
CHAPTER 3:MARKET OVERVIEW
3.1.Market definition and scope
3.2.Key findings
3.2.1.Top investment pockets
3.3.Porter’s five forces analysis
3.4.Market dynamics
3.4.1.Drivers
3.4.2.Restraints
3.4.3.Opportunities
3.5.COVID-19 Impact Analysis on the market
CHAPTER 4: PROTEOMICS MARKET, BY COMPONENT
4.1 Overview
4.1.1 Market size and forecast
4.2. Reagents
4.2.1 Key market trends, growth factors and opportunities
4.2.2 Market size and forecast, by region
4.2.3 Market share analysis by country
4.2.4 Reagents Proteomics Market by Reagents Type
4.3. Instruments
4.3.1 Key market trends, growth factors and opportunities
4.3.2 Market size and forecast, by region
4.3.3 Market share analysis by country
4.3.4 Instruments Proteomics Market by Instruments Type
4.3.4.1 Spectrometry Proteomics Market by Type
4.3.4.2 Chromatography Proteomics Market by Type
4.4. Services
4.4.1 Key market trends, growth factors and opportunities
4.4.2 Market size and forecast, by region
4.4.3 Market share analysis by country
CHAPTER 5: PROTEOMICS MARKET, BY APPLICATION
5.1 Overview
5.1.1 Market size and forecast
5.2. Drug Discovery
5.2.1 Key market trends, growth factors and opportunities
5.2.2 Market size and forecast, by region
5.2.3 Market share analysis by country
5.3. Disease Diagnosis
5.3.1 Key market trends, growth factors and opportunities
5.3.2 Market size and forecast, by region
5.3.3 Market share analysis by country
5.4. Others
5.4.1 Key market trends, growth factors and opportunities
5.4.2 Market size and forecast, by region
5.4.3 Market share analysis by country
CHAPTER 6: PROTEOMICS MARKET, BY REGION
6.1 Overview
6.1.1 Market size and forecast
6.2 North America
6.2.1 Key trends and opportunities
6.2.2 North America Market size and forecast, by Component
6.2.3 North America Market size and forecast, by Application
6.2.4 North America Market size and forecast, by country
6.2.4.1 U.S.
6.2.4.1.1 Key market trends, growth factors and opportunities
6.2.4.1.2 Market size and forecast, by Component
6.2.4.1.3 Market size and forecast, by Application
6.2.4.2 Canada
6.2.4.2.1 Key market trends, growth factors and opportunities
6.2.4.2.2 Market size and forecast, by Component
6.2.4.2.3 Market size and forecast, by Application
6.2.4.3 Mexico
6.2.4.3.1 Key market trends, growth factors and opportunities
6.2.4.3.2 Market size and forecast, by Component
6.2.4.3.3 Market size and forecast, by Application
6.3 Europe
6.3.1 Key trends and opportunities
6.3.2 Europe Market size and forecast, by Component
6.3.3 Europe Market size and forecast, by Application
6.3.4 Europe Market size and forecast, by country
6.3.4.1 Germany
6.3.4.1.1 Key market trends, growth factors and opportunities
6.3.4.1.2 Market size and forecast, by Component
6.3.4.1.3 Market size and forecast, by Application
6.3.4.2 France
6.3.4.2.1 Key market trends, growth factors and opportunities
6.3.4.2.2 Market size and forecast, by Component
6.3.4.2.3 Market size and forecast, by Application
6.3.4.3 UK
6.3.4.3.1 Key market trends, growth factors and opportunities
6.3.4.3.2 Market size and forecast, by Component
6.3.4.3.3 Market size and forecast, by Application
6.3.4.4 Italy
6.3.4.4.1 Key market trends, growth factors and opportunities
6.3.4.4.2 Market size and forecast, by Component
6.3.4.4.3 Market size and forecast, by Application
6.3.4.5 Spain
6.3.4.5.1 Key market trends, growth factors and opportunities
6.3.4.5.2 Market size and forecast, by Component
6.3.4.5.3 Market size and forecast, by Application
6.3.4.6 Rest of Europe
6.3.4.6.1 Key market trends, growth factors and opportunities
6.3.4.6.2 Market size and forecast, by Component
6.3.4.6.3 Market size and forecast, by Application
6.4 Asia-Pacific
6.4.1 Key trends and opportunities
6.4.2 Asia-Pacific Market size and forecast, by Component
6.4.3 Asia-Pacific Market size and forecast, by Application
6.4.4 Asia-Pacific Market size and forecast, by country
6.4.4.1 Japan
6.4.4.1.1 Key market trends, growth factors and opportunities
6.4.4.1.2 Market size and forecast, by Component
6.4.4.1.3 Market size and forecast, by Application
6.4.4.2 China
6.4.4.2.1 Key market trends, growth factors and opportunities
6.4.4.2.2 Market size and forecast, by Component
6.4.4.2.3 Market size and forecast, by Application
6.4.4.3 Australia
6.4.4.3.1 Key market trends, growth factors and opportunities
6.4.4.3.2 Market size and forecast, by Component
6.4.4.3.3 Market size and forecast, by Application
6.4.4.4 India
6.4.4.4.1 Key market trends, growth factors and opportunities
6.4.4.4.2 Market size and forecast, by Component
6.4.4.4.3 Market size and forecast, by Application
6.4.4.5 South Korea
6.4.4.5.1 Key market trends, growth factors and opportunities
6.4.4.5.2 Market size and forecast, by Component
6.4.4.5.3 Market size and forecast, by Application
6.4.4.6 Rest of Asia-Pacific
6.4.4.6.1 Key market trends, growth factors and opportunities
6.4.4.6.2 Market size and forecast, by Component
6.4.4.6.3 Market size and forecast, by Application
6.5 LAMEA
6.5.1 Key trends and opportunities
6.5.2 LAMEA Market size and forecast, by Component
6.5.3 LAMEA Market size and forecast, by Application
6.5.4 LAMEA Market size and forecast, by country
6.5.4.1 Brazil
6.5.4.1.1 Key market trends, growth factors and opportunities
6.5.4.1.2 Market size and forecast, by Component
6.5.4.1.3 Market size and forecast, by Application
6.5.4.2 Saudi Arabia
6.5.4.2.1 Key market trends, growth factors and opportunities
6.5.4.2.2 Market size and forecast, by Component
6.5.4.2.3 Market size and forecast, by Application
6.5.4.3 South Africa
6.5.4.3.1 Key market trends, growth factors and opportunities
6.5.4.3.2 Market size and forecast, by Component
6.5.4.3.3 Market size and forecast, by Application
6.5.4.4 Rest of LAMEA
6.5.4.4.1 Key market trends, growth factors and opportunities
6.5.4.4.2 Market size and forecast, by Component
6.5.4.4.3 Market size and forecast, by Application
CHAPTER 7: COMPANY LANDSCAPE
7.1. Introduction
7.2. Top winning strategies
7.3. Product Mapping of Top 10 Player
7.4. Competitive Dashboard
7.5. Competitive Heatmap
7.6. Top player positioning, 2021
CHAPTER 8: COMPANY PROFILES
8.1 Thermo Fisher Scientific Inc.
8.1.1 Company overview
8.1.2 Key Executives
8.1.3 Company snapshot
8.1.4 Operating business segments
8.1.5 Product portfolio
8.1.6 Business performance
8.1.7 Key strategic moves and developments
8.2 Merck KGaA
8.2.1 Company overview
8.2.2 Key Executives
8.2.3 Company snapshot
8.2.4 Operating business segments
8.2.5 Product portfolio
8.2.6 Business performance
8.2.7 Key strategic moves and developments
8.3 Waters Corporation
8.3.1 Company overview
8.3.2 Key Executives
8.3.3 Company snapshot
8.3.4 Operating business segments
8.3.5 Product portfolio
8.3.6 Business performance
8.3.7 Key strategic moves and developments
8.4 Bio-Rad Laboratories Inc
8.4.1 Company overview
8.4.2 Key Executives
8.4.3 Company snapshot
8.4.4 Operating business segments
8.4.5 Product portfolio
8.4.6 Business performance
8.4.7 Key strategic moves and developments
8.5 Agilent Technologies Inc.
8.5.1 Company overview
8.5.2 Key Executives
8.5.3 Company snapshot
8.5.4 Operating business segments
8.5.5 Product portfolio
8.5.6 Business performance
8.5.7 Key strategic moves and developments
8.6 Li-Cor Inc
8.6.1 Company overview
8.6.2 Key Executives
8.6.3 Company snapshot
8.6.4 Operating business segments
8.6.5 Product portfolio
8.6.6 Business performance
8.6.7 Key strategic moves and developments
8.7 Bruker Corporation
8.7.1 Company overview
8.7.2 Key Executives
8.7.3 Company snapshot
8.7.4 Operating business segments
8.7.5 Product portfolio
8.7.6 Business performance
8.7.7 Key strategic moves and developments
8.8 Perkin Elmer Inc
8.8.1 Company overview
8.8.2 Key Executives
8.8.3 Company snapshot
8.8.4 Operating business segments
8.8.5 Product portfolio
8.8.6 Business performance
8.8.7 Key strategic moves and developments
8.9 Danaher Corporation
8.9.1 Company overview
8.9.2 Key Executives
8.9.3 Company snapshot
8.9.4 Operating business segments
8.9.5 Product portfolio
8.9.6 Business performance
8.9.7 Key strategic moves and developments
8.10 Horiba Ltd.
8.10.1 Company overview
8.10.2 Key Executives
8.10.3 Company snapshot
8.10.4 Operating business segments
8.10.5 Product portfolio
8.10.6 Business performance
8.10.7 Key strategic moves and developments
LIST OF TABLES
TABLE 1. GLOBAL PROTEOMICS MARKET, BY COMPONENT, 2021-2031 (REVENUE, $MILLION)
TABLE 2. PROTEOMICS MARKET FOR REAGENTS, BY REGION, 2021-2031 (REVENUE, $MILLION)
TABLE 3. GLOBAL REAGENTS PROTEOMICS MARKET, BY REAGENTS TYPE, 2021-2031 (REVENUE, $MILLION)
TABLE 4. PROTEOMICS MARKET FOR INSTRUMENTS, BY REGION, 2021-2031 (REVENUE, $MILLION)
TABLE 5. GLOBAL INSTRUMENTS PROTEOMICS MARKET, BY INSTRUMENTS TYPE, 2021-2031 (REVENUE, $MILLION)
TABLE 6. GLOBAL SPECTROMETRY PROTEOMICS MARKET, BY TYPE, 2021-2031 (REVENUE, $MILLION)
TABLE 7. GLOBAL CHROMATOGRAPHY PROTEOMICS MARKET, BY TYPE, 2021-2031 (REVENUE, $MILLION)
TABLE 8. PROTEOMICS MARKET FOR SERVICES, BY REGION, 2021-2031 (REVENUE, $MILLION)
TABLE 9. GLOBAL PROTEOMICS MARKET, BY APPLICATION, 2021-2031 (REVENUE, $MILLION)
TABLE 10. PROTEOMICS MARKET FOR DRUG DISCOVERY, BY REGION, 2021-2031 (REVENUE, $MILLION)
TABLE 11. PROTEOMICS MARKET FOR DISEASE DIAGNOSIS, BY REGION, 2021-2031 (REVENUE, $MILLION)
TABLE 12. PROTEOMICS MARKET FOR OTHERS, BY REGION, 2021-2031 (REVENUE, $MILLION)
TABLE 13. PROTEOMICS MARKET, BY REGION, 2021-2031 (REVENUE, $MILLION)
TABLE 14. NORTH AMERICA PROTEOMICS MARKET, BY COMPONENT, 2021-2031 (REVENUE, $MILLION)
TABLE 15. NORTH AMERICA PROTEOMICS MARKET, BY APPLICATION, 2021-2031 (REVENUE, $MILLION)
TABLE 16. NORTH AMERICA PROTEOMICS MARKET, BY COUNTRY, 2021-2031 (REVENUE, $MILLION)
TABLE 17. U.S. PROTEOMICS MARKET, BY COMPONENT, 2021-2031 (REVENUE, $MILLION)
TABLE 18. U.S. PROTEOMICS MARKET, BY APPLICATION, 2021-2031 (REVENUE, $MILLION)
TABLE 19. CANADA PROTEOMICS MARKET, BY COMPONENT, 2021-2031 (REVENUE, $MILLION)
TABLE 20. CANADA PROTEOMICS MARKET, BY APPLICATION, 2021-2031 (REVENUE, $MILLION)
TABLE 21. MEXICO PROTEOMICS MARKET, BY COMPONENT, 2021-2031 (REVENUE, $MILLION)
TABLE 22. MEXICO PROTEOMICS MARKET, BY APPLICATION, 2021-2031 (REVENUE, $MILLION)
TABLE 23. EUROPE PROTEOMICS MARKET, BY COMPONENT, 2021-2031 (REVENUE, $MILLION)
TABLE 24. EUROPE PROTEOMICS MARKET, BY APPLICATION, 2021-2031 (REVENUE, $MILLION)
TABLE 25. EUROPE PROTEOMICS MARKET, BY COUNTRY, 2021-2031 (REVENUE, $MILLION)
TABLE 26. GERMANY PROTEOMICS MARKET, BY COMPONENT, 2021-2031 (REVENUE, $MILLION)
TABLE 27. GERMANY PROTEOMICS MARKET, BY APPLICATION, 2021-2031 (REVENUE, $MILLION)
TABLE 28. FRANCE PROTEOMICS MARKET, BY COMPONENT, 2021-2031 (REVENUE, $MILLION)
TABLE 29. FRANCE PROTEOMICS MARKET, BY APPLICATION, 2021-2031 (REVENUE, $MILLION)
TABLE 30. UK PROTEOMICS MARKET, BY COMPONENT, 2021-2031 (REVENUE, $MILLION)
TABLE 31. UK PROTEOMICS MARKET, BY APPLICATION, 2021-2031 (REVENUE, $MILLION)
TABLE 32. ITALY PROTEOMICS MARKET, BY COMPONENT, 2021-2031 (REVENUE, $MILLION)
TABLE 33. ITALY PROTEOMICS MARKET, BY APPLICATION, 2021-2031 (REVENUE, $MILLION)
TABLE 34. SPAIN PROTEOMICS MARKET, BY COMPONENT, 2021-2031 (REVENUE, $MILLION)
TABLE 35. SPAIN PROTEOMICS MARKET, BY APPLICATION, 2021-2031 (REVENUE, $MILLION)
TABLE 36. REST OF EUROPE PROTEOMICS MARKET, BY COMPONENT, 2021-2031 (REVENUE, $MILLION)
TABLE 37. REST OF EUROPE PROTEOMICS MARKET, BY APPLICATION, 2021-2031 (REVENUE, $MILLION)
TABLE 38. ASIA-PACIFIC PROTEOMICS MARKET, BY COMPONENT, 2021-2031 (REVENUE, $MILLION)
TABLE 39. ASIA-PACIFIC PROTEOMICS MARKET, BY APPLICATION, 2021-2031 (REVENUE, $MILLION)
TABLE 40. ASIA-PACIFIC PROTEOMICS MARKET, BY COUNTRY, 2021-2031 (REVENUE, $MILLION)
TABLE 41. JAPAN PROTEOMICS MARKET, BY COMPONENT, 2021-2031 (REVENUE, $MILLION)
TABLE 42. JAPAN PROTEOMICS MARKET, BY APPLICATION, 2021-2031 (REVENUE, $MILLION)
TABLE 43. CHINA PROTEOMICS MARKET, BY COMPONENT, 2021-2031 (REVENUE, $MILLION)
TABLE 44. CHINA PROTEOMICS MARKET, BY APPLICATION, 2021-2031 (REVENUE, $MILLION)
TABLE 45. AUSTRALIA PROTEOMICS MARKET, BY COMPONENT, 2021-2031 (REVENUE, $MILLION)
TABLE 46. AUSTRALIA PROTEOMICS MARKET, BY APPLICATION, 2021-2031 (REVENUE, $MILLION)
TABLE 47. INDIA PROTEOMICS MARKET, BY COMPONENT, 2021-2031 (REVENUE, $MILLION)
TABLE 48. INDIA PROTEOMICS MARKET, BY APPLICATION, 2021-2031 (REVENUE, $MILLION)
TABLE 49. SOUTH KOREA PROTEOMICS MARKET, BY COMPONENT, 2021-2031 (REVENUE, $MILLION)
TABLE 50. SOUTH KOREA PROTEOMICS MARKET, BY APPLICATION, 2021-2031 (REVENUE, $MILLION)
TABLE 51. REST OF ASIA-PACIFIC PROTEOMICS MARKET, BY COMPONENT, 2021-2031 (REVENUE, $MILLION)
TABLE 52. REST OF ASIA-PACIFIC PROTEOMICS MARKET, BY APPLICATION, 2021-2031 (REVENUE, $MILLION)
TABLE 53. LAMEA PROTEOMICS MARKET, BY COMPONENT, 2021-2031 (REVENUE, $MILLION)
TABLE 54. LAMEA PROTEOMICS MARKET, BY APPLICATION, 2021-2031 (REVENUE, $MILLION)
TABLE 55. LAMEA PROTEOMICS MARKET, BY COUNTRY, 2021-2031 (REVENUE, $MILLION)
TABLE 56. BRAZIL PROTEOMICS MARKET, BY COMPONENT, 2021-2031 (REVENUE, $MILLION)
TABLE 57. BRAZIL PROTEOMICS MARKET, BY APPLICATION, 2021-2031 (REVENUE, $MILLION)
TABLE 58. SAUDI ARABIA PROTEOMICS MARKET, BY COMPONENT, 2021-2031 (REVENUE, $MILLION)
TABLE 59. SAUDI ARABIA PROTEOMICS MARKET, BY APPLICATION, 2021-2031 (REVENUE, $MILLION)
TABLE 60. SOUTH AFRICA PROTEOMICS MARKET, BY COMPONENT, 2021-2031 (REVENUE, $MILLION)
TABLE 61. SOUTH AFRICA PROTEOMICS MARKET, BY APPLICATION, 2021-2031 (REVENUE, $MILLION)
TABLE 62. REST OF LAMEA PROTEOMICS MARKET, BY COMPONENT, 2021-2031 (REVENUE, $MILLION)
TABLE 63. REST OF LAMEA PROTEOMICS MARKET, BY APPLICATION, 2021-2031 (REVENUE, $MILLION)
TABLE 65.THERMO FISHER SCIENTIFIC INC.: KEY EXECUTIVES
TABLE 65.THERMO FISHER SCIENTIFIC INC.: COMPANY SNAPSHOT
TABLE 66.THERMO FISHER SCIENTIFIC INC.: OPERATING SEGMENTS
TABLE 67.THERMO FISHER SCIENTIFIC INC.: PRODUCT PORTFOLIO
TABLE 68.THERMO FISHER SCIENTIFIC INC.: NET SALES
TABLE 69.THERMO FISHER SCIENTIFIC INC.: KEY STRATERGIES
TABLE 71.BIO-RAD LABORATORIES INC: KEY EXECUTIVES
TABLE 71.BIO-RAD LABORATORIES INC: COMPANY SNAPSHOT
TABLE 72.BIO-RAD LABORATORIES INC: OPERATING SEGMENTS
TABLE 73.BIO-RAD LABORATORIES INC: PRODUCT PORTFOLIO
TABLE 74.BIO-RAD LABORATORIES INC: NET SALES
TABLE 75.BIO-RAD LABORATORIES INC: KEY STRATERGIES
TABLE 77.AGILENT TECHNOLOGIES INC.: KEY EXECUTIVES
TABLE 77.AGILENT TECHNOLOGIES INC.: COMPANY SNAPSHOT
TABLE 78.AGILENT TECHNOLOGIES INC.: OPERATING SEGMENTS
TABLE 79.AGILENT TECHNOLOGIES INC.: PRODUCT PORTFOLIO
TABLE 80.AGILENT TECHNOLOGIES INC.: NET SALES
TABLE 81.AGILENT TECHNOLOGIES INC.: KEY STRATERGIES
TABLE 83.MERCK KGAA: KEY EXECUTIVES
TABLE 83.MERCK KGAA: COMPANY SNAPSHOT
TABLE 84.MERCK KGAA: OPERATING SEGMENTS
TABLE 85.MERCK KGAA: PRODUCT PORTFOLIO
TABLE 86.MERCK KGAA: NET SALES
TABLE 87.MERCK KGAA: KEY STRATERGIES
TABLE 89.LI-COR INC: KEY EXECUTIVES
TABLE 89.LI-COR INC: COMPANY SNAPSHOT
TABLE 90.LI-COR INC: OPERATING SEGMENTS
TABLE 91.LI-COR INC: PRODUCT PORTFOLIO
TABLE 92.LI-COR INC: NET SALES
TABLE 93.LI-COR INC: KEY STRATERGIES
TABLE 95.WATERS CORPORATION: KEY EXECUTIVES
TABLE 95.WATERS CORPORATION: COMPANY SNAPSHOT
TABLE 96.WATERS CORPORATION: OPERATING SEGMENTS
TABLE 97.WATERS CORPORATION: PRODUCT PORTFOLIO
TABLE 98.WATERS CORPORATION: NET SALES
TABLE 99.WATERS CORPORATION: KEY STRATERGIES
TABLE 101.BRUKER CORPORATION: KEY EXECUTIVES
TABLE 101.BRUKER CORPORATION: COMPANY SNAPSHOT
TABLE 102.BRUKER CORPORATION: OPERATING SEGMENTS
TABLE 103.BRUKER CORPORATION: PRODUCT PORTFOLIO
TABLE 104.BRUKER CORPORATION: NET SALES
TABLE 105.BRUKER CORPORATION: KEY STRATERGIES
TABLE 107.PERKIN ELMER INC: KEY EXECUTIVES
TABLE 107.PERKIN ELMER INC: COMPANY SNAPSHOT
TABLE 108.PERKIN ELMER INC: OPERATING SEGMENTS
TABLE 109.PERKIN ELMER INC: PRODUCT PORTFOLIO
TABLE 110.PERKIN ELMER INC: NET SALES
TABLE 111.PERKIN ELMER INC: KEY STRATERGIES
TABLE 113.DANAHER CORPORATION: KEY EXECUTIVES
TABLE 113.DANAHER CORPORATION: COMPANY SNAPSHOT
TABLE 114.DANAHER CORPORATION: OPERATING SEGMENTS
TABLE 115.DANAHER CORPORATION: PRODUCT PORTFOLIO
TABLE 116.DANAHER CORPORATION: NET SALES
TABLE 117.DANAHER CORPORATION: KEY STRATERGIES
TABLE 119.HORIBA LTD.: KEY EXECUTIVES
TABLE 119.HORIBA LTD.: COMPANY SNAPSHOT
TABLE 120.HORIBA LTD.: OPERATING SEGMENTS
TABLE 121.HORIBA LTD.: PRODUCT PORTFOLIO
TABLE 122.HORIBA LTD.: NET SALES
TABLE 123.HORIBA LTD.: KEY STRATERGIES
LIST OF FIGURES
FIGURE 1. SEGMENTATION OF PROTEOMICS MARKET,2021-2031
FIGURE 2.PROTEOMICS MARKET,2021-2031
FIGURE 3. TOP INVESTMENT POCKETS, BY REGION
FIGURE 4.PORTER FIVE-1
FIGURE 5.PORTER FIVE-2
FIGURE 6.PORTER FIVE-3
FIGURE 7.PORTER FIVE-4
FIGURE 8.PORTER FIVE-5
FIGURE 9.PROTEOMICS MARKET:DRIVERS, RESTRAINTS AND OPPORTUNITIES
FIGURE 10.PROTEOMICS MARKET,BY COMPONENT,2021(%)
FIGURE 11.COMPARATIVE SHARE ANALYSIS OF REAGENTS PROTEOMICS MARKET, 2021 AND 2031(%)
FIGURE 12.COMPARATIVE SHARE ANALYSIS OF INSTRUMENTS PROTEOMICS MARKET, 2021 AND 2031(%)
FIGURE 13.COMPARATIVE SHARE ANALYSIS OF SERVICES PROTEOMICS MARKET, 2021 AND 2031(%)
FIGURE 14.PROTEOMICS MARKET,BY APPLICATION,2021(%)
FIGURE 15.COMPARATIVE SHARE ANALYSIS OF DRUG DISCOVERY PROTEOMICS MARKET, 2021 AND 2031(%)
FIGURE 16.COMPARATIVE SHARE ANALYSIS OF DISEASE DIAGNOSIS PROTEOMICS MARKET, 2021 AND 2031(%)
FIGURE 17.COMPARATIVE SHARE ANALYSIS OF OTHERS PROTEOMICS MARKET, 2021 AND 2031(%)
FIGURE 18.PROTEOMICS MARKET BY REGION,2021
FIGURE 19.U.S. PROTEOMICS MARKET,2021-2031($MILLION)
FIGURE 20.CANADA PROTEOMICS MARKET,2021-2031($MILLION)
FIGURE 21.MEXICO PROTEOMICS MARKET,2021-2031($MILLION)
FIGURE 22.GERMANY PROTEOMICS MARKET,2021-2031($MILLION)
FIGURE 23.FRANCE PROTEOMICS MARKET,2021-2031($MILLION)
FIGURE 24.UK PROTEOMICS MARKET,2021-2031($MILLION)
FIGURE 25.ITALY PROTEOMICS MARKET,2021-2031($MILLION)
FIGURE 26.SPAIN PROTEOMICS MARKET,2021-2031($MILLION)
FIGURE 27.REST OF EUROPE PROTEOMICS MARKET,2021-2031($MILLION)
FIGURE 28.JAPAN PROTEOMICS MARKET,2021-2031($MILLION)
FIGURE 29.CHINA PROTEOMICS MARKET,2021-2031($MILLION)
FIGURE 30.AUSTRALIA PROTEOMICS MARKET,2021-2031($MILLION)
FIGURE 31.INDIA PROTEOMICS MARKET,2021-2031($MILLION)
FIGURE 32.SOUTH KOREA PROTEOMICS MARKET,2021-2031($MILLION)
FIGURE 33.REST OF ASIA-PACIFIC PROTEOMICS MARKET,2021-2031($MILLION)
FIGURE 34.BRAZIL PROTEOMICS MARKET,2021-2031($MILLION)
FIGURE 35.SAUDI ARABIA PROTEOMICS MARKET,2021-2031($MILLION)
FIGURE 36.SOUTH AFRICA PROTEOMICS MARKET,2021-2031($MILLION)
FIGURE 37.REST OF LAMEA PROTEOMICS MARKET,2021-2031($MILLION)
FIGURE 38. TOP WINNING STRATEGIES, BY YEAR
FIGURE 39. TOP WINNING STRATEGIES, BY DEVELOPMENT
FIGURE 40. TOP WINNING STRATEGIES, BY COMPANY
FIGURE 41.PRODUCT MAPPING OF TOP 10 PLAYERS
FIGURE 42.TOP PLAYER POSITIONING, 2021
FIGURE 43.COMPETITIVE DASHBOARD
FIGURE 44.COMPETITIVE HEATMAP OF TOP 10 KEY PLAYERS
FIGURE 45.THERMO FISHER SCIENTIFIC INC..: NET SALES ($MILLION)
FIGURE 46.BIO-RAD LABORATORIES INC.: NET SALES ($MILLION)
FIGURE 47.AGILENT TECHNOLOGIES INC..: NET SALES ($MILLION)
FIGURE 48.MERCK KGAA.: NET SALES ($MILLION)
FIGURE 49.LI-COR INC.: NET SALES ($MILLION)
FIGURE 50.WATERS CORPORATION.: NET SALES ($MILLION)
FIGURE 51.BRUKER CORPORATION.: NET SALES ($MILLION)
FIGURE 52.PERKIN ELMER INC.: NET SALES ($MILLION)
FIGURE 53.DANAHER CORPORATION.: NET SALES ($MILLION)
FIGURE 54.HORIBA LTD..: NET SALES ($MILLION)
$5730
$6454
$9600
$3840
HAVE A QUERY?
OUR CUSTOMER

SIMILAR REPORTS