
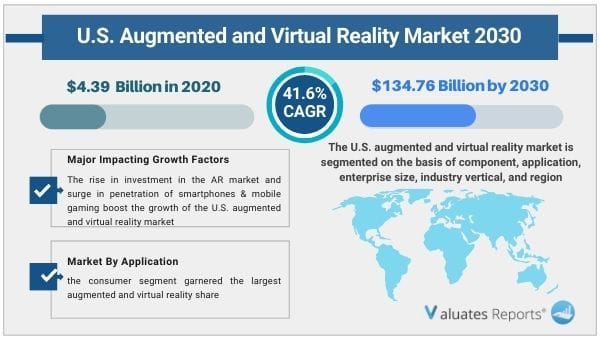
The U.S. augmented and virtual reality market size was valued at $4.39 billion in 2020, and is projected to reach $134.76 billion by 2030, registering a CAGR of 41.6% from 2021 to 2030. Virtual reality is an extensive term for a multi-sensory computer-generated experience that enables users to experience and interact with a simulated environment. Whereas, augmented reality enhances the real world using digitally produced perceptual overlays. Furthermore, virtual reality is the use of computer technology to create a simulated environment, which can be explored in 360 degrees. In addition, games, surgery, and flight simulators are the most well-known uses of virtual reality. In addition, it allows students to explore, experience, and immerse in virtual environments.
The US augmented & virtual reality industry is expected to attain significant growth during the COVID-19 pandemic, owing to increase in need among business to improve customer needs and upsurge their revenue opportunity. In addition to this, surge in investment in AI by various private sectors such as healthcare, medical research and others, to fight against the pandemic situations propels the growth of the market.
The rise in investment in the AR market and surge in penetration of smartphones & mobile gaming boost the growth of the U.S. augmented and virtual reality market. In addition, increase in adoption of augmented & virtual reality solutions in education positively impacts the growth of the U.S. AR & VR market. However, factors such lack of effective user experience design and security and privacy issues associated with AR is expected to hamper the U.S. AR and VR market growth. On the contrary, increase in usage of VR headsets in amusement and theme parks, commercial applications, and other places is expected to offer remunerative opportunities for the expansion of the U.S. augmented and virtual reality market during the forecast period.
By application, the consumer segment garnered the largest augmented and virtual reality share and is expected to maintain its dominance in the upcoming years as consumers are increasingly using augmented and virtual reality due to advancements in VR devices and growth in usage of AR devices for software development and the creation of standardized platforms which is providing lucrative opportunity for the U.S. augmented and virtual reality market growth. However, the enterprise segment is expected to witness highest growth, owing to development of new businesses and IT applications among companies across numerous industrial sectors. In addition, AR and VR technologies are disrupting the market with several real-world applications, which are emerging continuously in enterprise segments. AR and VR provide new opportunities to transform the enterprise, mainly in the areas of collaboration & communication, training & simulation, and field & customer service as well as for customer experiences. This is expected to drive the growth of the U.S. AR & VR market during the forecast period.
By industry vertical, the gaming segment garnered the largest augmented and virtual reality share and is expected to maintain its dominance in the upcoming years owing to rise in number of gaming industries and increase in cartoon production houses. Furthermore, many large companies are developing and launching games in the midst of the COVID-19 pandemic, which is expected to boost the growth of the market.
For instance, Niantic Labs, the maker of Pokémon Go, is teaming with Nintendo for a new augmented reality video game based on the spritelike Pikmin which is possible due to Niantic’s AR technology to make gamers experience the world as if Pikmin are secretly living all around us. Thus, number of such developments across the U.S. drives the growth of the market. However, the healthcare segment is expected to witness highest growth, owing to massive utilization of virtual reality for research process and pre-surgical analysis of internal organs by researchers and surgeons.
The report focuses on growth prospects, restraints, and trends of the U.S. augmented and virtual reality market analysis. The study provides Porter’s five forces analysis to understand the impact of various factors, such as bargaining power of suppliers, competitive intensity of competitors, threat of new entrants, threat of substitutes, and bargaining power of buyers, on the U.S. augmented and virtual reality market share.
The U.S. augmented and virtual reality market is segmented on the basis of component, application, enterprise size, industry vertical, and region. By component, it is divided into solution, service, and connectivity type. By application, it is bifurcated into consumer and enterprise. By enterprise size, it is categorized into large enterprise and SMEs. By industry vertical, it is classified into gaming, entertainment & media, aerospace & defense, healthcare, manufacturing, retail, education, and others.
The key players profiled in the U.S. augmented and virtual reality market analysis are Apple Inc., Cyberglove Systems, Inc., Facebook Technologies, LLC (Oculus), Google, Inc. Intel Corporation, Magic Leap, Inc., Microsoft Corporation, Niantic, Inc., PTC and Sixense Enterprises, Inc. These players have adopted various strategies to increase their market penetration and strengthen their position in the U.S. augmented and virtual reality industry.
The augmented and virtual reality market in U.S. is projected to prosper in the COVID-19 situation owing to various government, public, and other organization adopting work from home culture for their employees. In addition, healthcare is one of the main industries where the use of augmented and virtual reality has increased significantly for reducing the contact with the COVID-19 patient and increasing the safety of the doctors and other employees of the hospital. Furthermore, COVID-19 has heavily restricted supply chains across every industry, as demand curves changed overnight, and organizations needed to automate operations each and every process of supply chain industry the demand for AR & VR has increased drastically, which propels the growth of the market.
Moreover, banks are rapidly adopting AR & VR solutions to process and analyze key data such as their customer acquisition cost, customer lifetime value as well as the trends of products that are growing in popularity. In addition, the gained insights will allow banks to correctly promote the right services to the right customer demographic utilizing an optimized budget to capture more market share. However, the massive demand for VR devices was restrained by the disruption of supply chain during the pandemic due to various lockdowns.
Surge in investment in AR by various industries such as military and defense, media & entertainment, retail, and others for providing customers with enhanced experience is driving the growth of the market. In addition, companies such as IKEA, Target, and Amazon have started including AR in their apps so shoppers can see what an object will look like in their home before buying it which propels the growth of the market. Furthermore, companies like Apple Inc. and others are investing heavily in AR technology for providing common people with AR systems which is propelling the growth of the market. In addition, various companies are heavily investing in AR technology for improving their customer base and to upsurge their revenue opportunity which is driving the growth of the market. Furthermore, various healthcare organizations are investing heavily in AR technology for improving the quality of treatment a patient receives and helping medical professionals to enhance their performance by breaking down complex medical concepts into interactive 3D forms. These are the major factors that drive the growth of the market.
Amusement and theme parks, commercial applications, and other places are adopting to provide shows with low costs compared to high costs of VR headsets with the increasing popularity of VR headsets. For instance, New York show Sleep No More which is an immersive theater performance where the audience is involved in the action. In addition, according to recent surveys, over 66% of people are interested in visiting such a concert which is expected to provide lucrative opportunity for the market.
Furthermore, major theme park is investing in VR and AR to recover from the COVID-19 pandemic and help visitors feel like they are riding inside a real-life kart race. For instance, Universal Studios announced the construction of Super Nintendo World land at Universal Studios Hollywood which is a video game-themed lands that will anchor Mario Kart: Koopa’s Challenge!, a dark ride that will use augmented reality technology to help visitors feel like they are riding inside a real-life Mario Kart race. This increase in adoption of AR is not only driving the augmented and virtual reality market but is also lifting business that has lost its audience due to COVID-19 lockdown. These are the major factors providing lucrative opportunity for the market growth.
By Component
By Application
By Enterprise Size
By Industry Vertical
Key Market Players
Table of Content
CHAPTER 1:INTRODUCTION
1.1.Report description
1.2.Key benefits for stakeholders
1.3.Key market segments
1.4.Research methodology
1.4.1.Secondary research
1.4.2.Primary research
1.4.3.Analyst tools & models
CHAPTER 2:EXECUTIVE SUMMARY
2.1.Key findings
2.1.1.Top impacting factors
2.2.CXO perspective
CHAPTER 3:MARKET OVERVIEW
3.1.Market definition and scope
3.2.Key forces shaping the U.S. augmented and virtual reality market
3.3.Case Studies
3.3.1.Case Study 01
3.3.2.Case Study 02
3.4.Market evolution/ Industry roadmap
3.5.Market dynamics
3.5.1.Drivers
3.5.1.1.Rise in investment in AR market
3.5.1.2.Rise in penetration of smartphones
3.5.1.3.Cost-efficient benefits of augmented and virtual reality-based solutions
3.5.2.Restraints
3.5.2.1.Security and privacy issues associated with AR
3.5.3.Opportunities
3.5.3.1.Increase in usage of VR headsets in amusement and theme parks, commercial applications, and other places
3.6.COVID-19 impact analysis on U.S. augmented and virtual reality market
3.6.1.Impact on market size
3.6.2.Consumer trends, preferences, and budget impact
3.6.3.Economic impact
3.6.4.Strategies to tackle negative impact
3.6.5.Opportunity window
CHAPTER 4:U.S. AUGMENTED AND VIRTUAL REALITY MARKET, BY COMPONENT
4.1.Overview
4.2.Solution
4.2.1.Key market trends, growth factors, and opportunities
4.2.2.Market size and forecast
4.2.3.U.S. augmented and virtual reality market for solution, by device type
4.2.3.1.PC/Console-based
4.2.3.2.Smartphone-based
4.2.3.3.Standalone
4.2.3.4.Market size and forecast, by device type
4.2.4.U.S. augmented and virtual reality market for solution, by technology type
4.2.4.1.Augmented Reality
4.2.4.2.Virtual Reality
4.2.4.3.Market size and forecast, by technology type
4.3.Service
4.3.1.Key market trends, growth factors, and opportunities
4.3.2.Market size and forecast
4.3.3.U.S. augmented and virtual reality market, by service type
4.3.3.1.Consulting service
4.3.3.2.System Integration and Deployment
4.3.3.3.Support & Maintenance service
4.3.3.4.Market size and forecast, by service type
4.4.Connectivity Technology
4.4.1.Key market trends, growth factors, and opportunities
4.4.2.Market size and forecast
4.4.3.U.S. augmented and virtual reality market, by connectivity technology type
4.4.3.1.Wired
4.4.3.2.Cellular Technology
4.4.3.2.1.2G & 3G
4.4.3.2.2.4G
4.4.3.2.3.Market size and forecast, by cellular technology type
4.4.3.3.Wi-Fi
4.4.3.4.Bluetooth
4.4.3.5.Others
4.4.3.6.Market size and forecast, by connectivity technology type
CHAPTER 5:U.S. AUGMENTED AND VIRTUAL REALITY MARKET, BY APPLICATION
5.1.Overview
5.2.Consumer
5.2.1.Key market trends, growth factors, and opportunities
5.2.2.Market size and forecast
5.3.Enterprises
5.3.1.Key market trends, growth factors, and opportunities
5.3.2.Market size and forecast
CHAPTER 6:U.S. AUGMENTED AND VIRTUAL REALITY MARKET, BY ENTERPRISE SIZE
6.1.Overview
6.2.Large Enterprises
6.2.1.Key market trends, growth factors, and opportunities
6.2.2.Market size and forecast
6.3.SMEs
6.3.1.Key market trends, growth factors, and opportunities
6.3.2.Market size and forecast
CHAPTER 7:U.S. AUGMENTED AND VIRTUAL REALITY MARKET, BY INDUSTRY VERTICAL
7.1.Overview
7.2.Gaming
7.2.1.Key market trends, growth factors, and opportunities
7.2.2.Market size and forecast
7.3.Entertainment & Media
7.3.1.Key market trends, growth factors, and opportunities
7.3.2.Market size and forecast
7.4.Aerospace & Defense
7.4.1.Key market trends, growth factors, and opportunities
7.4.2.Market size and forecast
7.5.Healthcare
7.5.1.Key market trends, growth factors, and opportunities
7.5.2.Market size and forecast
7.6.Manufacturing
7.6.1.Key market trends, growth factors, and opportunities
7.6.2.Market size and forecast
7.7.Retail
7.7.1.Key market trends, growth factors, and opportunities
7.7.2.Market size and forecast
7.8.Education
7.8.1.Key market trends, growth factors, and opportunities
7.8.2.Market size and forecast
7.9.Others
7.9.1.Key market trends, growth factors, and opportunities
7.9.2.Market size and forecast
CHAPTER 8:COMPETITIVE LANDSCAPE
8.1.Key players positioning analysis, 2020
8.2.Competitive dashboard
8.3.Top winning strategies
CHAPTER 9:COMPANY PROFILE
9.1.APPLE INC.
9.1.1.Company overview
9.1.2.Key executives
9.1.3.Company snapshot
9.1.4.Product portfolio
9.1.5.R&D expenditure
9.1.6.Business performance
9.2.CYBERGLOVE SYSTEMS INC.
9.2.1.Company overview
9.2.2.Key executives
9.2.3.Company snapshot
9.2.4.Product portfolio
9.3.Facebook Technologies, LLC (Oculus)
9.3.1.Company overview
9.3.2.Key Executives
9.3.3.Company snapshot
9.3.4.Product portfolio
9.3.5.Operating business segments
9.3.6.R&D expenditure
9.3.7.Business performance
9.4.Alphabet (Google Inc.)
9.4.1.Company overview
9.4.2.Key Executives
9.4.3.Company snapshot
9.4.4.Product portfolio
9.4.5.R&D Expenditure
9.4.6.Business performance
9.4.7.Key strategic moves and developments
9.5.INTEL CORPORATION
9.5.1.Company overview
9.5.2.Key executives
9.5.3.Company snapshot
9.5.4.Operating business segments
9.5.5.Product portfolio
9.5.6.R&D expenditure
9.5.7.Business performance
9.6.MAGIC LEAP, INC.
9.6.1.Company overview
9.6.2.Key executive
9.6.3.Company snapshot
9.6.4.Product portfolio
9.6.5.Key strategic moves and developments
9.7.MICROSOFT CORPORATION
9.7.1.Company overview
9.7.2.Key executives
9.7.3.Company snapshot
9.7.4.Operating business segments
9.7.5.Product portfolio
9.7.6.R&D expenditure
9.7.7.Business performance
9.7.8.Key strategic moves and developments
9.8.NIANTIC, INC.
9.8.1.Company overview
9.8.2.Key executives
9.8.3.Company snapshot
9.8.4.Product portfolio
9.9.PTC
9.9.1.Company overview
9.9.2.Key executives
9.9.3.Company snapshot
9.9.4.Operating business segments
9.9.5.Product portfolio
9.9.6.R&D expenditure
9.9.7.Business performance
9.9.8.Key strategic moves and developments
9.10.SIXENSE ENTERPRISES INC.
9.10.1.Company overview
9.10.2.Key executives
9.10.3.Company snapshot
9.10.4.Product portfolio
Tables & Figures
Table 01.U.S. Augmented And Virtual Reality Market Revenue, By Component, 2019–2027 ($Million)
Table 02.U.S. Augmented And Virtual Reality Market Revenue For Solution, 2019–2027 ($Million)
Table 03.U.S. Augmented And Virtual Reality Market Revenue For Solution, By Device Type, 2019–2027 ($Million)
Table 04.U.S. Augmented And Virtual Reality Market Revenue For Solution, By Technology Type, 2019–2027 ($Million)
Table 05.U.S. Augmented And Virtual Reality Market Revenue For Service, 2019–2027 ($Million)
Table 06.U.S. Augmented And Virtual Reality Market Revenue, By Service Type, 2019–2027 ($Million)
Table 07.U.S. Augmented And Virtual Reality Market Revenue For Connectivity Technology, 2019–2027 ($Million)
Table 08.U.S. Augmented And Virtual Reality Market Revenue, By Connectivity Technology Type, 2019–2027 ($Million)
Table 09.U.S. Augmented And Virtual Reality Market Revenue For Cellular Technology, By Type, 2019–2027 ($Million)
Table 10.U.S. Augmented And Virtual Reality Market Revenue, By Application, 2019–2027 ($Million)
Table 11.U.S. Augmented And Virtual Reality Market Revenue For Consumer, 2019–2027 ($Million)
Table 12.U.S. Augmented And Virtual Reality Market Revenue For Enterprise, 2019–2027 ($Million)
Table 13.U.S. Augmented And Virtual Reality Market Revenue For Enterprise, By Enterprise Size, 2019–2027 ($Million)
Table 14.U.S. Augmented And Virtual Reality Market Revenue For Large Enterprises, 2019–2027 ($Million)
Table 15.U.S. Augmented And Virtual Reality Market Revenue For Smes, 2019–2027 ($Million)
Table 16.U.S. Augmented And Virtual Reality Market Revenue, By Enterprise Size, 2019–2027 ($Million)
Table 17.U.S. Augmented And Virtual Reality Market Revenue For Gaming, 2019–2027 ($Million)
Table 18.U.S. Augmented And Virtual Reality Market Revenue For Entertainment & Media, 2019–2027 ($Million)
Table 19.U.S. Augmented And Virtual Reality Market Revenue For Aerospace & Defense, 2019–2027 ($Million)
Table 20.U.S. Augmented And Virtual Reality Market Revenue For Healthcare, 2019–2027 ($Million)
Table 21.U.S. Augmented And Virtual Reality Market Revenue For Manufacturing, 2019–2027 ($Million)
Table 22.U.S. Augmented And Virtual Reality Market Revenue For Retail, 2019–2027 ($Million)
Table 23.U.S. Augmented And Virtual Reality Market Revenue For Education, 2019–2027 ($Million)
Table 24.U.S. Augmented And Virtual Reality Market Revenue For Others, 2019–2027 ($Million)
Table 25.Apple Inc.: Key Executives
Table 26.Apple Inc.: Company Snapshot-
Table 27.Apple Inc.: Product Portfolio
Table 28.Cyberglove Systems Inc.: Key Executive
Table 29.Cyberglove Systems Inc.: Company Snapshot
Table 30.Cyberglove Systems Inc.: Product Portfolio
Table 31.Facebook Technologies, Llc. (Oculus ): Key Executives
Table 32.Facebook Technologies, Llc.( Oculus): Company Snapshot
Table 33.Facebook Technologies, Llc.( Oculus): Product Portfolio
Table 34.Facebook Technologies, Llc.(Oculus): Operating Segments
Table 35.Alphabet (Google Inc.) : Key Executives
Table 36.Alphabet (Google Inc.) : Company Snapshot
Table 37.Alphabet (Google Inc.) : Product Portfolio
Table 38.Intel Corporation: Key Executives
Table 39.Intel Corporation: Company Snapshot
Table 40.Intel Corporation: Operating Segments
Table 41.Intel Corporation: Video Analytics Product Portfolio
Table 42.Magic Leap, Inc.: Key Executive
Table 43.Magic Leap, Inc.: Company Snapshot
Table 44.Magic Leap, Inc.: Product Portfolio
Table 45.Microsoft Corporation: Key Executive
Table 46.Microsoft Corporation: Company Snapshot
Table 47.Microsoft Corporation: Operating Segments
Table 48.Microsoft Corporation: Product Portfolio
Table 49.Niantic, Inc.: Key Executives
Table 50.Niantic, Inc.: Company Snapshot
Table 51.Niantic, Inc.: Product Portfolio
Table 52.Ptc: Key Executive
Table 53.Ptc: Company Snapshot
Table 54.Ptc: Operating Segments
Table 55.Ptc: Product Portfolio
Table 56.Sixense Enterprises Inc..: Key Executives
Table 57.Sixense Enterprises Inc. : Company Snapshot
Table 58.Sixense Enterprises Inc.: Product Portfolio
List Of Figures
Figure 01.Key Market Segments
Figure 02.U.S. Augmented And Virtual Reality Market Snapshot, By Segmentation, 2019–2027
Figure 03.Top Impacting Factors
Figure 04.Moderate -To-High Bargaining Power Of Suppliers
Figure 05.Moderate-To-High Bargaining Power Of Buyer
Figure 06.Moderate-To-High Threat Of Substitutes
Figure 07.Moderate-To-High Threat Of New Entrants
Figure 08.Moderate-To-High Competitive Rivalry
Figure 09.Market Evolution/Industry Roadmap
Figure 10.U.S. Augmented And Virtual Reality Market Revenue, By Component, 2019–2027 ($Million)
Figure 11.U.S. Augmented And Virtual Reality Market Revenue For Solution, By Device Type, 2019–2027 ($Million)
Figure 12.U.S. Augmented And Virtual Reality Market Revenue For Solution, By Technology Type, 2019–2027 ($Million)
Figure 13.U.S. Augmented And Virtual Reality Market Revenue, By Service Type, 2019–2027 ($Million)
Figure 14.U.S. Augmented And Virtual Reality Market Revenue, By Connectivity Technology Type, 2019–2027 ($Million)
Figure 15.U.S. Augmented And Virtual Reality Market Revenue For Cellular Technology, By Type, 2019–2027 ($Million)
Figure 16.U.S. Augmented And Virtual Reality Market Revenue, By Application, 2019–2027 ($Million)
Figure 17.U.S. Augmented And Virtual Reality Market Revenue For Enterprise, By Enterprise Size, 2019–2027 ($Million)
Figure 18.U.S. Augmented And Virtual Reality Market Revenue, By Industry Vertical, 2019–2027 ($Million)
Figure 19.Key Player Positioning Anlysis: U.S. Augmented And Virtual Reality Market
Figure 20.Competitive Dashboard
Figure 21.Competitive Dashboard
Figure 22.Competitive Heatmap Of Key Players
Figure 23.Top Winning Strategies, By Year, 2019-2021
Figure 24.Top Winning Strategies, By Development, 2019-2021
Figure 25.Top Winning Strategies, By Company, 2019-2021
Figure 26.R&D Expenditure, 2018–2020 ($Million)
Figure 27.Apple Inc.: Net Sales, 2018–2020 ($Million),
Figure 28.Apple Inc.: Revenue Share, By Region (2020)
Figure 29.R&D Expenditure, 2018–2020 ($Million)
Figure 30.Facebook Technologies, Llc.(Oculus): Revenue, 2018–2020 ($Million)
Figure 31.Facebook Technologies, Llc.(Oculus): Revenue Share By Segment, 2020 (%)
Figure 32.Facebook Technologies, Llc.(Oculus): Revenue Share By Region, 2020 (%)
Figure 33.R&D Expenditure, 2018-2020 ($Million)
Figure 34.Alphabet (Google Inc.) :Net Sales, 2018–2020 ($Million),
Figure 35.Alphabet (Google Inc.): Revenue Share, By Region (2020)
Figure 36.R&D Expenditure, 2018–2020 ($Million)
Figure 37.Intel Corporation: Revenue, 2018–2020 ($Million)
Figure 38.Intel Corporation: Revenue Share By Segment, 2020 (%)
Figure 39.Intel Corporation: Revenue Share By Region, 2020 (%)
Figure 40.R&D Expenditure, 2018-2020 ($Million)
Figure 41.Microsoft Corporation: Revenue, 2018–2020 ($Million)
Figure 42.Microsoft Corporation: Revenue Share By Segment, 2020 (%)
Figure 43.Microsoft Corporation: Revenue Share By Region, 2020 (%)
Figure 44.R&D Expenditure, 2018-2020 ($Million)
Figure 45.Ptc: Revenue, 2018–2020 ($Million)
Figure 46.Ptc: Revenue Share By Segment, 2020 (%)
Figure 47.Ptc: Revenue Share By Region, 2020 (%)
$3648
$3902
$6442
$2323
HAVE A QUERY?
OUR CUSTOMER

SIMILAR REPORTS