
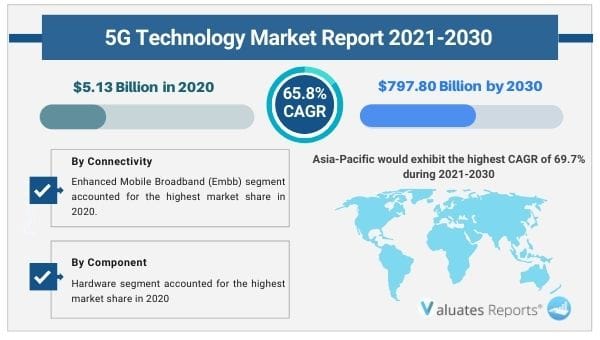
The global 5G technology market Size was valued at US$ 5.13 billion in 2020 and is projected to reach US$ 797.80 billion by 2030 growing at a Compound Annual Growth Rate (CAGR) of 65.8% from 2021 to 2030. Key drivers of the 5G technology market include the widespread adoption of edge computing and the surge in the number of IoT devices being used worldwide.
The regulatory obstacles in the small cell deployment for effective 5G technology will restrict the market. However, booming investments in smart city infrastructure for 5g Networks will accelerate the growth of the 5G technology market in the upcoming years. Moreover, the covid 19 impact has accelerated the pace of 5G adoption as the world has shifted to online work platforms thereby expanding the growth of the market during the forecast period.
The wide-scale adoption of edge computing and the growing number of IoT devices has augmented the need for 5G technology. Edge computing processes huge amounts of data in real-time closer to the source. The IoT devices and edge provide reliability, fast response time, and privacy features. The huge amount of data requires booming data speeds. 5G reduces latency through the edge thereby improving the bulky data processing capability. Thus the wide-scale adoption of edge computing and the growing number of IoT devices will create lucrative opportunities for the growth of the 5G technology market during the forecast period.
Small cell deployment is crucial for the effective implementation of 5g technology. However, there are certain challenges in the form of regulatory, financial, and other administrative processes which eat up time delaying the full benefit utilization of 5G communication networks. Moreover, small cells face issues in the form of site selection, transmission loss, and lack of proper grid infrastructure. This will hamper the market growth during the forecast period. However huge investments in the 5G network for smart city infrastructure by telcos and other key players will drive the market growth in the coming years. The demand for more data bandwidth, agility, flexibility, cost-effective networks, etc is gaining traction across the globe. Thus difficulties in small cell deployment will restrict the market. On the other hand, huge investments in infrastructure will expand the 5G technology market during the forecast period.
The covid 19 pandemic has forced companies to shift to remote working models. The reliance on online work platforms has accelerated the need for robust network infrastructure for carrying out efficient operational activities. The interest in 5G technology has grown among organizations amidst the rapid digital transformation wave. This is expected to create lucrative opportunities for the growth of the 5G technology market in the future.
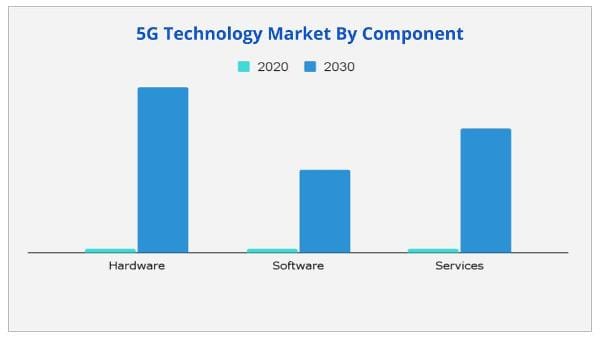
Based on components, the hardware segment is expected to provide lucrative opportunities for growth in the 5G technology market share during the forecast period.
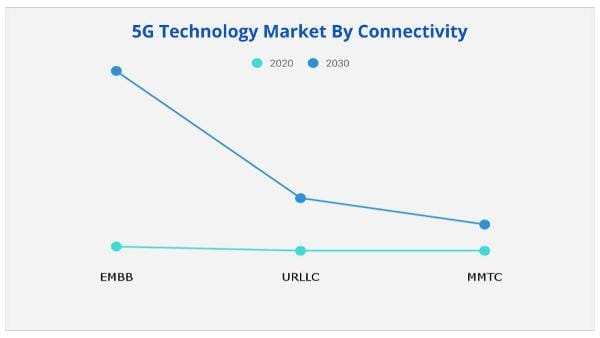
Based on connectivity, the enhanced mobile broadband segment(eMBB) is expected to provide ample opportunities for growth in the 5G technology market share as the eMBB provides high data bandwidth and huge improvements in latency rates.
Based on end-use, the manufacturing segment dominated the market and will provide immense opportunities for growth in the 5G technology market share.
Based on application, the connected vehicle segment will create huge scope for growth in the 5G technology market share as 5G is deployed for an effective vehicle to vehicle communication and smooth operation.
Based on region, Asia-Pacific would exhibit the highest CAGR of 69.7% during 2021-2030, due to rapid investments in the region.
|
Report Metric |
Details |
|
Base Year: |
2020 |
|
Market Size in 2020: |
USD 5.13 Billion |
|
Forecast Period: |
2021 to 2030 |
|
Forecast Period 2021 to 2030 CAGR: |
65.8% |
|
2030 Value Projection: |
USD 797.80 Billion |
|
No. of Pages: |
340 |
|
Tables & Figures |
156 |
|
Charts |
70 |
|
Segments covered: |
By Component, Connectivity, Application, End-Use, Region |
Ans. The market value of the global 5G Technology Market is $5.13 billion in 2020.
Ans. The global 5G technology market is expected to grow at a compound annual growth rate of 65.8% from 2021 to 2030 to reach USD 797.80 billion by 2030.
Ans. The report analyses the profiles of key players operating in the 5G technology market such as Deutsche Telekom AG, Ericsson, Huawei Technology, Nokia, Orange S.A., Qualcomm Inc., Telecom Italia, Telstra, T-Mobile, and Intel Corporation.
Ans. The forecast period considered for the global 5G Technology market is 2021 to 2030, wherein, 2020 is the base year, 2021 is the estimated year, and 2030 is the forecast year.
Ans. Widescale adoption of edge computing and the growing number of IoT devices will create lucrative opportunities for the growth of the 5G technology market during the forecast period.
Ans. By Connectivity, Enhanced Mobile Broadband (Embb) segment accounted for the highest market share in 2020.
Ans. 5G Technology Market is Segmented on the basis of Component, Connectivity, Application, End-Use, and Region.
Ans. Asia-Pacific 5G Technology Market would exhibit the highest CAGR of 69.7% during 2021-2030
CHAPTER 1: INTRODUCTION
1.1.Report Description
1.2.Key Market Segments
1.3.Key Benefits
1.4.Research Methodology
1.4.1.Primary Research
1.4.2.Secondary Research
1.4.3.Analyst Tools and Models
CHAPTER 2: EXECUTIVE SUMMARY
2.1.CXO Perspective
CHAPTER 3: MARKET LANDSCAPE
3.1.Market Definition and Scope
3.2.Key Findings
3.2.1.Top Investment Pockets
3.2.2.Top Winning Strategies
3.3.Porter's Five Forces Analysis
3.3.1.Bargaining Power of Suppliers
3.3.2.Threat of New Entrants
3.3.3.Threat of Substitutes
3.3.4.Competitive Rivalry
3.3.5.Bargaining Power among Buyers
3.4.Market Share Analysis/Top Player Positioning
3.4.1.Market Share Analysis/Top Player Positioning 20203.5.Market Dynamics
3.5.1.Drivers
3.5.2.Restraints
3.5.3.Opportunities
3.6.COVID-19 Impact Analysis
3.7.Competitive Heatmap
CHAPTER 4: 5G TECHNOLOGY MARKET, BY COMPONENT
4.1.Market Overview
4.1.1Market Size and Forecast, By Component
4.2.Hardware
4.2.1.Key Market Trends, Growth Factors and Opportunities
4.2.2.Market Size and Forecast, By Region
4.2.3.Market Share Analysis, By Country
4.3.Software
4.3.1.Key Market Trends, Growth Factors and Opportunities
4.3.2.Market Size and Forecast, By Region
4.3.3.Market Share Analysis, By Country
4.4.Services
4.4.1.Key Market Trends, Growth Factors and Opportunities
4.4.2.Market Size and Forecast, By Region
4.4.3.Market Share Analysis, By Country
CHAPTER 5: 5G TECHNOLOGY MARKET, BY CONNECTIVITY
5.1.Market Overview
5.1.1Market Size and Forecast, By Connectivity
5.2.Enhanced Mobile Broadband (EMBB)
5.2.1.Key Market Trends, Growth Factors and Opportunities
5.2.2.Market Size and Forecast, By Region
5.2.3.Market Share Analysis, By Country
5.3.Ultra-Reliable Low Latency Communication (URLLC)
5.3.1.Key Market Trends, Growth Factors and Opportunities
5.3.2.Market Size and Forecast, By Region
5.3.3.Market Share Analysis, By Country
5.4.Massive Machine Type Communication (MMTC))
5.4.1.Key Market Trends, Growth Factors and Opportunities
5.4.2.Market Size and Forecast, By Region
5.4.3.Market Share Analysis, By Country
CHAPTER 6: 5G TECHNOLOGY MARKET, BY APPLICATION
6.1.Market Overview
6.1.1Market Size and Forecast, By Application
6.2.Automation
6.2.1.Key Market Trends, Growth Factors and Opportunities
6.2.2.Market Size and Forecast, By Region
6.2.3.Market Share Analysis, By Country
6.3.Monitoring & Tracking
6.3.1.Key Market Trends, Growth Factors and Opportunities
6.3.2.Market Size and Forecast, By Region
6.3.3.Market Share Analysis, By Country
6.4.Connected Vehicle
6.4.1.Key Market Trends, Growth Factors and Opportunities
6.4.2.Market Size and Forecast, By Region
6.4.3.Market Share Analysis, By Country
6.5.Smart Surveillance
6.5.1.Key Market Trends, Growth Factors and Opportunities
6.5.2.Market Size and Forecast, By Region
6.5.3.Market Share Analysis, By Country
6.6.VR & AR
6.6.1.Key Market Trends, Growth Factors and Opportunities
6.6.2.Market Size and Forecast, By Region
6.6.3.Market Share Analysis, By Country
6.7.Enhanced Video Services
6.7.1.Key Market Trends, Growth Factors and Opportunities
6.7.2.Market Size and Forecast, By Region
6.7.3.Market Share Analysis, By Country
6.8.Others
6.8.1.Key Market Trends, Growth Factors and Opportunities
6.8.2.Market Size and Forecast, By Region
6.8.3.Market Share Analysis, By Country
CHAPTER 7: 5G TECHNOLOGY MARKET, BY END USER
7.1.Market Overview
7.1.1Market Size and Forecast, By End User
7.2.Manufacturing
7.2.1.Key Market Trends, Growth Factors and Opportunities
7.2.2.Market Size and Forecast, By Region
7.2.3.Market Share Analysis, By Country
7.3.Automotive
7.3.1.Key Market Trends, Growth Factors and Opportunities
7.3.2.Market Size and Forecast, By Region
7.3.3.Market Share Analysis, By Country
7.4.Energy & Utilities
7.4.1.Key Market Trends, Growth Factors and Opportunities
7.4.2.Market Size and Forecast, By Region
7.4.3.Market Share Analysis, By Country
7.5.Transportation & Logistics
7.5.1.Key Market Trends, Growth Factors and Opportunities
7.5.2.Market Size and Forecast, By Region
7.5.3.Market Share Analysis, By Country
7.6.Healthcare
7.6.1.Key Market Trends, Growth Factors and Opportunities
7.6.2.Market Size and Forecast, By Region
7.6.3.Market Share Analysis, By Country
7.7.Government
7.7.1.Key Market Trends, Growth Factors and Opportunities
7.7.2.Market Size and Forecast, By Region
7.7.3.Market Share Analysis, By Country
7.8.Media & Entertainment
7.8.1.Key Market Trends, Growth Factors and Opportunities
7.8.2.Market Size and Forecast, By Region
7.8.3.Market Share Analysis, By Country
7.9.Others
7.9.1.Key Market Trends, Growth Factors and Opportunities
7.9.2.Market Size and Forecast, By Region
7.9.3.Market Share Analysis, By Country
CHAPTER 8: 5G TECHNOLOGY MARKET, BY REGION
8.1.Market Overview
8.1.1Market Size and Forecast, By Region
8.2.North America
8.2.1.Key Market Trends and Opportunities
8.2.2.Market Size and Forecast, By Component
8.2.3.Market Size and Forecast, By Connectivity
8.2.4.Market Size and Forecast, By Application
8.2.5.Market Size and Forecast, By End User
8.2.6.Market Size and Forecast, By Country
8.2.7.United States 5g Technology Market
8.2.7.1.Market Size and Forecast, By Component
8.2.7.2.Market Size and Forecast, By Connectivity
8.2.7.3.Market Size and Forecast, By Application
8.2.7.4.Market Size and Forecast, By End User
8.2.8.Canada 5g Technology Market
8.2.8.1.Market Size and Forecast, By Component
8.2.8.2.Market Size and Forecast, By Connectivity
8.2.8.3.Market Size and Forecast, By Application
8.2.8.4.Market Size and Forecast, By End User
8.3.Europe
8.3.1.Key Market Trends and Opportunities
8.3.2.Market Size and Forecast, By Component
8.3.3.Market Size and Forecast, By Connectivity
8.3.4.Market Size and Forecast, By Application
8.3.5.Market Size and Forecast, By End User
8.3.6.Market Size and Forecast, By Country
8.3.7.Germany 5g Technology Market
8.3.7.1.Market Size and Forecast, By Component
8.3.7.2.Market Size and Forecast, By Connectivity
8.3.7.3.Market Size and Forecast, By Application
8.3.7.4.Market Size and Forecast, By End User
8.3.8.U.K 5g Technology Market
8.3.8.1.Market Size and Forecast, By Component
8.3.8.2.Market Size and Forecast, By Connectivity
8.3.8.3.Market Size and Forecast, By Application
8.3.8.4.Market Size and Forecast, By End User
8.3.9.France 5g Technology Market
8.3.9.1.Market Size and Forecast, By Component
8.3.9.2.Market Size and Forecast, By Connectivity
8.3.9.3.Market Size and Forecast, By Application
8.3.9.4.Market Size and Forecast, By End User
8.3.10.Italy 5g Technology Market
8.3.10.1.Market Size and Forecast, By Component
8.3.10.2.Market Size and Forecast, By Connectivity
8.3.10.3.Market Size and Forecast, By Application
8.3.10.4.Market Size and Forecast, By End User
8.3.11.Spain 5g Technology Market
8.3.11.1.Market Size and Forecast, By Component
8.3.11.2.Market Size and Forecast, By Connectivity
8.3.11.3.Market Size and Forecast, By Application
8.3.11.4.Market Size and Forecast, By End User
8.3.12.Rest of Europe 5g Technology Market
8.3.12.1.Market Size and Forecast, By Component
8.3.12.2.Market Size and Forecast, By Connectivity
8.3.12.3.Market Size and Forecast, By Application
8.3.12.4.Market Size and Forecast, By End User
8.4.Asia-Pacific
8.4.1.Key Market Trends and Opportunities
8.4.2.Market Size and Forecast, By Component
8.4.3.Market Size and Forecast, By Connectivity
8.4.4.Market Size and Forecast, By Application
8.4.5.Market Size and Forecast, By End User
8.4.6.Market Size and Forecast, By Country
8.4.7.China 5g Technology Market
8.4.7.1.Market Size and Forecast, By Component
8.4.7.2.Market Size and Forecast, By Connectivity
8.4.7.3.Market Size and Forecast, By Application
8.4.7.4.Market Size and Forecast, By End User
8.4.8.Japan 5g Technology Market
8.4.8.1.Market Size and Forecast, By Component
8.4.8.2.Market Size and Forecast, By Connectivity
8.4.8.3.Market Size and Forecast, By Application
8.4.8.4.Market Size and Forecast, By End User
8.4.9.South Korea 5g Technology Market
8.4.9.1.Market Size and Forecast, By Component
8.4.9.2.Market Size and Forecast, By Connectivity
8.4.9.3.Market Size and Forecast, By Application
8.4.9.4.Market Size and Forecast, By End User
8.4.10.Australia 5g Technology Market
8.4.10.1.Market Size and Forecast, By Component
8.4.10.2.Market Size and Forecast, By Connectivity
8.4.10.3.Market Size and Forecast, By Application
8.4.10.4.Market Size and Forecast, By End User
8.4.11.Rest Of Asia-pacific 5g Technology Market
8.4.11.1.Market Size and Forecast, By Component
8.4.11.2.Market Size and Forecast, By Connectivity
8.4.11.3.Market Size and Forecast, By Application
8.4.11.4.Market Size and Forecast, By End User
8.5.LAMEA
8.5.1.Key Market Trends and Opportunities
8.5.2.Market Size and Forecast, By Component
8.5.3.Market Size and Forecast, By Connectivity
8.5.4.Market Size and Forecast, By Application
8.5.5.Market Size and Forecast, By End User
8.5.6.Market Size and Forecast, By Country
8.5.7.Latin America 5g Technology Market
8.5.7.1.Market Size and Forecast, By Component
8.5.7.2.Market Size and Forecast, By Connectivity
8.5.7.3.Market Size and Forecast, By Application
8.5.7.4.Market Size and Forecast, By End User
8.5.8.Middle East 5g Technology Market
8.5.8.1.Market Size and Forecast, By Component
8.5.8.2.Market Size and Forecast, By Connectivity
8.5.8.3.Market Size and Forecast, By Application
8.5.8.4.Market Size and Forecast, By End User
8.5.9.Africa 5g Technology Market
8.5.9.1.Market Size and Forecast, By Component
8.5.9.2.Market Size and Forecast, By Connectivity
8.5.9.3.Market Size and Forecast, By Application
8.5.9.4.Market Size and Forecast, By End User
CHAPTER 9: COMPANY PROFILES
9.1.Deutsche Telekom AG
9.1.1.Company Overview
9.1.2.Key Executives
9.1.3.Company snapshot
9.1.4.Operating business segments
9.1.5.Product portfolio
9.1.6.Business Performance
9.1.7.Key Strategic Moves and Developments
9.2.Ericsson
9.2.1.Company Overview
9.2.2.Key Executives
9.2.3.Company snapshot
9.2.4.Operating business segments
9.2.5.Product portfolio
9.2.6.Business Performance
9.2.7.Key Strategic Moves and Developments
9.3.Huawei Technology
9.3.1.Company Overview
9.3.2.Key Executives
9.3.3.Company snapshot
9.3.4.Operating business segments
9.3.5.Product portfolio
9.3.6.Business Performance
9.3.7.Key Strategic Moves and Developments
9.4.Nokia
9.4.1.Company Overview
9.4.2.Key Executives
9.4.3.Company snapshot
9.4.4.Operating business segments
9.4.5.Product portfolio
9.4.6.Business Performance
9.4.7.Key Strategic Moves and Developments
9.5.Orange S.A.
9.5.1.Company Overview
9.5.2.Key Executives
9.5.3.Company snapshot
9.5.4.Operating business segments
9.5.5.Product portfolio
9.5.6.Business Performance
9.5.7.Key Strategic Moves and Developments
9.6.Qualcomm Inc.
9.6.1.Company Overview
9.6.2.Key Executives
9.6.3.Company snapshot
9.6.4.Operating business segments
9.6.5.Product portfolio
9.6.6.Business Performance
9.6.7.Key Strategic Moves and Developments
9.7.Telecom Italia
9.7.1.Company Overview
9.7.2.Key Executives
9.7.3.Company snapshot
9.7.4.Operating business segments
9.7.5.Product portfolio
9.7.6.Business Performance
9.7.7.Key Strategic Moves and Developments
9.8.Telstra
9.8.1.Company Overview
9.8.2.Key Executives
9.8.3.Company snapshot
9.8.4.Operating business segments
9.8.5.Product portfolio
9.8.6.Business Performance
9.8.7.Key Strategic Moves and Developments
9.9.T-Mobile
9.9.1.Company Overview
9.9.2.Key Executives
9.9.3.Company snapshot
9.9.4.Operating business segments
9.9.5.Product portfolio
9.9.6.Business Performance
9.9.7.Key Strategic Moves and Developments
9.10.Intel Corporation
9.10.1.Company Overview
9.10.2.Key Executives
9.10.3.Company snapshot
9.10.4.Operating business segments
9.10.5.Product portfolio
9.10.6.Business Performance
9.10.7.Key Strategic Moves and Developments
Table 1.Global 5g Technology Market, By Component, 2020-2030 ($Million)
Table 2.Global 5g Technology Market For Hardware, By Region, 2020-2030 ($Million)
Table 3.Global 5g Technology Market For Software, By Region, 2020-2030 ($Million)
Table 4.Global 5g Technology Market For Services, By Region, 2020-2030 ($Million)
Table 5.Global 5g Technology Market, By Connectivity, 2020-2030 ($Million)
Table 6.Global 5g Technology Market For Enhanced Mobile Broadband (Embb), By Region, 2020-2030 ($Million)
Table 7.Global 5g Technology Market For Ultra-Reliable Low Latency Communication (Urllc), By Region, 2020-2030 ($Million)
Table 8.Global 5g Technology Market For Massive Machine Type Communication (Mmtc)), By Region, 2020-2030 ($Million)
Table 9.Global 5g Technology Market, By Application, 2020-2030 ($Million)
Table 10.Global 5g Technology Market For Automation, By Region, 2020-2030 ($Million)
Table 11.Global 5g Technology Market For Monitoring And Tracking, By Region, 2020-2030 ($Million)
Table 12.Global 5g Technology Market For Connected Vehicle, By Region, 2020-2030 ($Million)
Table 13.Global 5g Technology Market For Smart Surveillance, By Region, 2020-2030 ($Million)
Table 14.Global 5g Technology Market For Vr And Ar, By Region, 2020-2030 ($Million)
Table 15.Global 5g Technology Market For Enhanced Video Services, By Region, 2020-2030 ($Million)
Table 16.Global 5g Technology Market For Others, By Region, 2020-2030 ($Million)
Table 17.Global 5g Technology Market, By End User, 2020-2030 ($Million)
Table 18.Global 5g Technology Market For Manufacturing, By Region, 2020-2030 ($Million)
Table 19.Global 5g Technology Market For Automotive, By Region, 2020-2030 ($Million)
Table 20.Global 5g Technology Market For Energy And Utilities, By Region, 2020-2030 ($Million)
Table 21.Global 5g Technology Market For Transportation And Logistics, By Region, 2020-2030 ($Million)
Table 22.Global 5g Technology Market For Healthcare, By Region, 2020-2030 ($Million)
Table 23.Global 5g Technology Market For Government, By Region, 2020-2030 ($Million)
Table 24.Global 5g Technology Market For Media And Entertainment, By Region, 2020-2030 ($Million)
Table 25.Global 5g Technology Market For Others, By Region, 2020-2030 ($Million)
Table 26.Global 5g Technology Market, By Region, 2020-2030 ($Million)
Table 27.North America 5g Technology, By Component, 2020-2030 ($Million)
Table 28.North America 5g Technology, By Connectivity, 2020-2030 ($Million)
Table 29.North America 5g Technology, By Application, 2020-2030 ($Million)
Table 30.North America 5g Technology, By End User, 2020-2030 ($Million)
Table 31.United States 5g Technology, By Component, 2020-2030 ($Million)
Table 32.United States 5g Technology, By Connectivity, 2020-2030 ($Million)
Table 33.United States 5g Technology, By Application, 2020-2030 ($Million)
Table 34.United States 5g Technology, By End User, 2020-2030 ($Million)
Table 35.Canada 5g Technology, By Component, 2020-2030 ($Million)
Table 36.Canada 5g Technology, By Connectivity, 2020-2030 ($Million)
Table 37.Canada 5g Technology, By Application, 2020-2030 ($Million)
Table 38.Canada 5g Technology, By End User, 2020-2030 ($Million)
Table 39.Europe 5g Technology, By Component, 2020-2030 ($Million)
Table 40.Europe 5g Technology, By Connectivity, 2020-2030 ($Million)
Table 41.Europe 5g Technology, By Application, 2020-2030 ($Million)
Table 42.Europe 5g Technology, By End User, 2020-2030 ($Million)
Table 43.Germany 5g Technology, By Component, 2020-2030 ($Million)
Table 44.Germany 5g Technology, By Connectivity, 2020-2030 ($Million)
Table 45.Germany 5g Technology, By Application, 2020-2030 ($Million)
Table 46.Germany 5g Technology, By End User, 2020-2030 ($Million)
Table 47.United Kingdom 5g Technology, By Component, 2020-2030 ($Million)
Table 48.United Kingdom 5g Technology, By Connectivity, 2020-2030 ($Million)
Table 49.United Kingdom 5g Technology, By Application, 2020-2030 ($Million)
Table 50.United Kingdom 5g Technology, By End User, 2020-2030 ($Million)
Table 51.France 5g Technology, By Component, 2020-2030 ($Million)
Table 52.France 5g Technology, By Connectivity, 2020-2030 ($Million)
Table 53.France 5g Technology, By Application, 2020-2030 ($Million)
Table 54.France 5g Technology, By End User, 2020-2030 ($Million)
Table 55.Italy 5g Technology, By Component, 2020-2030 ($Million)
Table 56.Italy 5g Technology, By Connectivity, 2020-2030 ($Million)
Table 57.Italy 5g Technology, By Application, 2020-2030 ($Million)
Table 58.Italy 5g Technology, By End User, 2020-2030 ($Million)
Table 59.Spain 5g Technology, By Component, 2020-2030 ($Million)
Table 60.Spain 5g Technology, By Connectivity, 2020-2030 ($Million)
Table 61.Spain 5g Technology, By Application, 2020-2030 ($Million)
Table 62.Spain 5g Technology, By End User, 2020-2030 ($Million)
Table 63.Rest Of Europe 5g Technology, By Component, 2020-2030 ($Million)
Table 64.Rest Of Europe 5g Technology, By Connectivity, 2020-2030 ($Million)
Table 65.Rest Of Europe 5g Technology, By Application, 2020-2030 ($Million)
Table 66.Rest Of Europe 5g Technology, By End User, 2020-2030 ($Million)
Table 67.Asia-Pacific 5g Technology, By Component, 2020-2030 ($Million)
Table 68.Asia-Pacific 5g Technology, By Connectivity, 2020-2030 ($Million)
Table 69.Asia-Pacific 5g Technology, By Application, 2020-2030 ($Million)
Table 70.Asia-Pacific 5g Technology, By End User, 2020-2030 ($Million)
Table 71.China 5g Technology, By Component, 2020-2030 ($Million)
Table 72.China 5g Technology, By Connectivity, 2020-2030 ($Million)
Table 73.China 5g Technology, By Application, 2020-2030 ($Million)
Table 74.China 5g Technology, By End User, 2020-2030 ($Million)
Table 75.Japan 5g Technology, By Component, 2020-2030 ($Million)
Table 76.Japan 5g Technology, By Connectivity, 2020-2030 ($Million)
Table 77.Japan 5g Technology, By Application, 2020-2030 ($Million)
Table 78.Japan 5g Technology, By End User, 2020-2030 ($Million)
Table 79.South Korea 5g Technology, By Component, 2020-2030 ($Million)
Table 80.South Korea 5g Technology, By Connectivity, 2020-2030 ($Million)
Table 81.South Korea 5g Technology, By Application, 2020-2030 ($Million)
Table 82.South Korea 5g Technology, By End User, 2020-2030 ($Million)
Table 83.Australia 5g Technology, By Component, 2020-2030 ($Million)
Table 84.Australia 5g Technology, By Connectivity, 2020-2030 ($Million)
Table 85.Australia 5g Technology, By Application, 2020-2030 ($Million)
Table 86.Australia 5g Technology, By End User, 2020-2030 ($Million)
Table 87.Rest Of Asia-Pacific 5g Technology, By Component, 2020-2030 ($Million)
Table 88.Rest Of Asia-Pacific 5g Technology, By Connectivity, 2020-2030 ($Million)
Table 89.Rest Of Asia-Pacific 5g Technology, By Application, 2020-2030 ($Million)
Table 90.Rest Of Asia-Pacific 5g Technology, By End User, 2020-2030 ($Million)
Table 91.Lamea 5g Technology, By Component, 2020-2030 ($Million)
Table 92.Lamea 5g Technology, By Connectivity, 2020-2030 ($Million)
Table 93.Lamea 5g Technology, By Application, 2020-2030 ($Million)
Table 94.Lamea 5g Technology, By End User, 2020-2030 ($Million)
Table 95.Latin America 5g Technology, By Component, 2020-2030 ($Million)
Table 96.Latin America 5g Technology, By Connectivity, 2020-2030 ($Million)
Table 97.Latin America 5g Technology, By Application, 2020-2030 ($Million)
Table 98.Latin America 5g Technology, By End User, 2020-2030 ($Million)
Table 99.Middle East 5g Technology, By Component, 2020-2030 ($Million)
Table 100.Middle East 5g Technology, By Connectivity, 2020-2030 ($Million)
Table 101.Middle East 5g Technology, By Application, 2020-2030 ($Million)
Table 102.Middle East 5g Technology, By End User, 2020-2030 ($Million)
Table 103.Africa 5g Technology, By Component, 2020-2030 ($Million)
Table 104.Africa 5g Technology, By Connectivity, 2020-2030 ($Million)
Table 105.Africa 5g Technology, By Application, 2020-2030 ($Million)
Table 106.Africa 5g Technology, By End User, 2020-2030 ($Million)
Table 107.Deutsche Telekom Ag: Key Executives
Table 108.Deutsche Telekom Ag: Company Snapshot
Table 109.Deutsche Telekom Ag: Operating Segments
Table 110.Deutsche Telekom Ag: Product Portfolio
Table 111.Deutsche Telekom Ag: Key Strategic Moves And Developments
Table 112.Ericsson: Key Executives
Table 113.Ericsson: Company Snapshot
Table 114.Ericsson: Operating Segments
Table 115.Ericsson: Product Portfolio
Table 116.Ericsson: Key Strategic Moves And Developments
Table 117.Huawei Technology: Key Executives
Table 118.Huawei Technology: Company Snapshot
Table 119.Huawei Technology: Operating Segments
Table 120.Huawei Technology: Product Portfolio
Table 121.Huawei Technology: Key Strategic Moves And Developments
Table 122.Nokia: Key Executives
Table 123.Nokia: Company Snapshot
Table 124.Nokia: Operating Segments
Table 125.Nokia: Product Portfolio
Table 126.Nokia: Key Strategic Moves And Developments
Table 127.Orange S.A.: Key Executives
Table 128.Orange S.A.: Company Snapshot
Table 129.Orange S.A.: Operating Segments
Table 130.Orange S.A.: Product Portfolio
Table 131.Orange S.A.: Key Strategic Moves And Developments
Table 132.Qualcomm Inc.: Key Executives
Table 133.Qualcomm Inc.: Company Snapshot
Table 134.Qualcomm Inc.: Operating Segments
Table 135.Qualcomm Inc.: Product Portfolio
Table 136.Qualcomm Inc.: Key Strategic Moves And Developments
Table 137.Telecom Italia: Key Executives
Table 138.Telecom Italia: Company Snapshot
Table 139.Telecom Italia: Operating Segments
Table 140.Telecom Italia: Product Portfolio
Table 141.Telecom Italia: Key Strategic Moves And Developments
Table 142.Telstra: Key Executives
Table 143.Telstra: Company Snapshot
Table 144.Telstra: Operating Segments
Table 145.Telstra: Product Portfolio
Table 146.Telstra: Key Strategic Moves And Developments
Table 147.T-Mobile: Key Executives
Table 148.T-Mobile: Company Snapshot
Table 149.T-Mobile: Operating Segments
Table 150.T-Mobile: Product Portfolio
Table 151.T-Mobile: Key Strategic Moves And Developments
Table 152.Intel Corporation: Key Executives
Table 153.Intel Corporation: Company Snapshot
Table 154.Intel Corporation: Operating Segments
Table 155.Intel Corporation: Product Portfolio
Table 156.Intel Corporation: Key Strategic Moves And Developments
List Of Figures
Figure 1.Global 5g Technology Market Segmentation
Figure 2.Global 5g Technology Market
Figure 3.Segmentation 5g Technology Market
Figure 4.Top Investment Pocket In 5g Technology Market
Figure 5.Top Winning Strategies, 2019-2021*
Figure 6.Top Winning Strategies, By Development, 2019-2021(%)
Figure 7.Top Winning Strategies, By Company, 2019-2021*
Figure 8.Moderate Bargaining Power Of Buyers
Figure 9.Moderate Bargaining Power Of Suppliers
Figure 10.Moderate Threat Of New Entrants
Figure 11.Low Threat Of Substitution
Figure 12.High Competitive Rivalry
Figure 13.Top Player Positioning, 2020
Figure 14.Market Share Analysis, 2020
Figure 15.Restraints And Drivers: 5g Technology Market
Figure 16.5g Technology Market Segmentation, By Component
Figure 17.5g Technology Market For Hardware, By Country, 2020-2030 ($Million)
Figure 18.5g Technology Market For Software, By Country, 2020-2030 ($Million)
Figure 19.5g Technology Market For Services, By Country, 2020-2030 ($Million)
Figure 20.5g Technology Market Segmentation, By Connectivity
Figure 21.5g Technology Market For Enhanced Mobile Broadband (Embb), By Country, 2020-2030 ($Million)
Figure 22.5g Technology Market For Ultra-Reliable Low Latency Communication (Urllc), By Country, 2020-2030 ($Million)
Figure 23.5g Technology Market For Massive Machine Type Communication (Mmtc)), By Country, 2020-2030 ($Million)
Figure 24.5g Technology Market Segmentation, By Application
Figure 25.5g Technology Market For Automation, By Country, 2020-2030 ($Million)
Figure 26.5g Technology Market For Monitoring And Tracking, By Country, 2020-2030 ($Million)
Figure 27.5g Technology Market For Connected Vehicle, By Country, 2020-2030 ($Million)
Figure 28.5g Technology Market For Smart Surveillance, By Country, 2020-2030 ($Million)
Figure 29.5g Technology Market For Vr And Ar, By Country, 2020-2030 ($Million)
Figure 30.5g Technology Market For Enhanced Video Services, By Country, 2020-2030 ($Million)
Figure 31.5g Technology Market For Others, By Country, 2020-2030 ($Million)
Figure 32.5g Technology Market Segmentation, By End User
Figure 33.5g Technology Market For Manufacturing, By Country, 2020-2030 ($Million)
Figure 34.5g Technology Market For Automotive, By Country, 2020-2030 ($Million)
Figure 35.5g Technology Market For Energy And Utilities, By Country, 2020-2030 ($Million)
Figure 36.5g Technology Market For Transportation And Logistics, By Country, 2020-2030 ($Million)
Figure 37.5g Technology Market For Healthcare, By Country, 2020-2030 ($Million)
Figure 38.5g Technology Market For Government, By Country, 2020-2030 ($Million)
Figure 39.5g Technology Market For Media And Entertainment, By Country, 2020-2030 ($Million)
Figure 40.5g Technology Market For Others, By Country, 2020-2030 ($Million)
Figure 41.Deutsche Telekom Ag: Net Sales, 2018-2020 ($Million)
Figure 42.Deutsche Telekom Ag: Revenue Share, By Segment, 2020 (%)
Figure 43.Deutsche Telekom Ag: Revenue Share, By Region, 2020 (%)
Figure 44.Ericsson: Net Sales, 2018-2020 ($Million)
Figure 45.Ericsson: Revenue Share, By Segment, 2020 (%)
Figure 46.Ericsson: Revenue Share, By Region, 2020 (%)
Figure 47.Huawei Technology: Net Sales, 2018-2020 ($Million)
Figure 48.Huawei Technology: Revenue Share, By Segment, 2020 (%)
Figure 49.Huawei Technology: Revenue Share, By Region, 2020 (%)
Figure 50.Nokia: Net Sales, 2018-2020 ($Million)
Figure 51.Nokia: Revenue Share, By Segment, 2020 (%)
Figure 52.Nokia: Revenue Share, By Region, 2020 (%)
Figure 53.Orange S.A.: Net Sales, 2018-2020 ($Million)
Figure 54.Orange S.A.: Revenue Share, By Segment, 2020 (%)
Figure 55.Orange S.A.: Revenue Share, By Region, 2020 (%)
Figure 56.Qualcomm Inc.: Net Sales, 2018-2020 ($Million)
Figure 57.Qualcomm Inc.: Revenue Share, By Segment, 2020 (%)
Figure 58.Qualcomm Inc.: Revenue Share, By Region, 2020 (%)
Figure 59.Telecom Italia: Net Sales, 2018-2020 ($Million)
Figure 60.Telecom Italia: Revenue Share, By Segment, 2020 (%)
Figure 61.Telecom Italia: Revenue Share, By Region, 2020 (%)
Figure 62.Telstra: Net Sales, 2018-2020 ($Million)
Figure 63.Telstra: Revenue Share, By Segment, 2020 (%)
Figure 64.Telstra: Revenue Share, By Region, 2020 (%)
Figure 65.T-Mobile: Net Sales, 2018-2020 ($Million)
Figure 66.T-Mobile: Revenue Share, By Segment, 2020 (%)
Figure 67.T-Mobile: Revenue Share, By Region, 2020 (%)
Figure 68.Intel Corporation: Net Sales, 2018-2020 ($Million)
Figure 69.Intel Corporation: Revenue Share, By Segment, 2020 (%)
Figure 70.Intel Corporation: Revenue Share, By Region, 2020 (%)
$6169
$10665
HAVE A QUERY?
OUR CUSTOMER
