
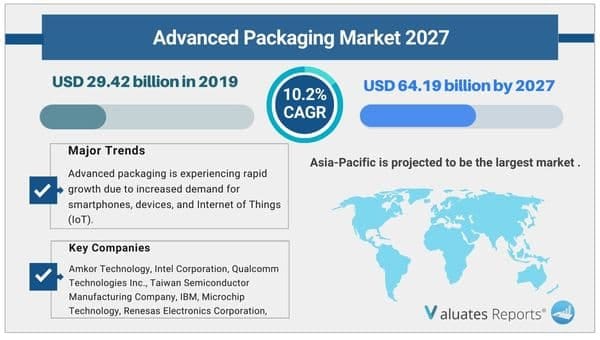
The global advanced packaging market size was valued at $29.42 billion in 2019 and is projected to reach $64.19 billion by 2027, growing at a CAGR of 10.2% from 2020 to 2027.
Advanced packaging is a supporting case that prevents physical damage and corrosion to silicon wafers, logic units, and memory, during the final stage of semiconductor manufacturing process. Advanced packaging allows the chip to be connected to a circuit board. In addition, it involves grouping of a variety of distinct techniques, which include 2.5D, 3D-IC, fan-out-wafer-level packaging, and system-in-package.
With rapid growth in the advanced packaging market, specifically fan out wafer level packaging, along with increase in demand for smartphone and devices and Internet of Things (IoT), advanced packaging suppliers are developing process and ways to reduce the overall cost of advanced packaging and provide maximum operational efficiency. During the recent times, advanced packaging is mainly used for high-end products and for applications related to niche-market such as wafer and die production due to high cost in its operation. Different integrated circuits (ICs) have different packaging requirements, which provide growth opportunities for advanced packaging over traditional packaging process. In addition, advanced packaging is expected to offer higher abilities than conventional packaging solutions, which is expected to offer lucrative opportunities for advanced packaging market trends in the coming years.
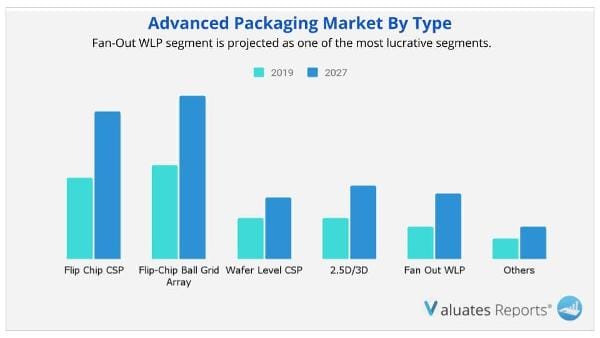
The global advanced packaging market is analyzed by type, end use, and region. By type, the market is classified into flip chip CSP, flip-chip ball grid array, wafer level CSP, 2.5D/3D, fan-out WLP, and others. On the basis of end use, the market is divided into consumer electronics, automotive, industrial, healthcare, aerospace & defense, and others. By region, it is analyzed across North America, Europe, Asia-Pacific, and LAMEA along with their prominent countries.
Top Impacting Factors
The significant factors impacting the advanced packaging market growth of the global advanced packaging sensor market include increase in demand for miniaturization of devices, and improved system performances and optimization of advanced packaging. However, high cost of advanced packaging is hampering its adoption. This hampers the growth of the market. On the contrary, emerging trends of fan-out wafer level packaging are anticipated to provide lucrative opportunities for the advanced packaging market during the forecast period.
Some major factors impacting the advanced packaging market growth are given below:
With increase in advancement in technologies, manufacturers are laying emphasis in providing compact electronic devices in various industry verticals such as consumer electronics, healthcare, automotive, and semiconductor IC manufacturing. These manufacturers are reducing the size of the integrated circuits to ensure fine patterning on the wafers and chips. In addition, medical devices industry is observing an increase in demand for nano-sized robotic surgery equipment with sophistication and advances into wearable and personalized healthcare gadgets. Therefore, the trends toward compact electronic devices has created the need for designers to outgrow the conventional packaging solutions and to adopt advanced packaging.
Semiconductor packaging industry is providing advanced IC packages to develop next-generation chip designs. Traditionally, the integrated circuit industry was using traditional chip scaling and innovative architectures for new devices. In addition, there exist multi-chip packages in every phone, data center, consumer electronics, and network which drive the growth of advanced packaging as it promotes system optimization. Advanced packaging promotes usage of AI, machine learning, and deep learning as it allows a variety of different processing elements and memories to be coupled together using very high-speed interconnects. Therefore, enhanced operation capabilities and precise processing is lucrative for various industry verticals, such as automotive, healthcare, aerospace & defense, and industrial sector, which are now adopting advanced packaging.
Advanced packaging is a very costly process as against conventional packaging solutions used in the semiconductor industry. The cost of designing and manufacturing chips at each new node is costly at certain levels. In addition, the cost of wafer fabrication is much higher due to the complexities of the ICs. Packaging of different chips and ICs with complex patterning increases the overall cost of advanced packaging and hampers its adoption.
Competition Analysis
Key players operating with major advanced packaging market share include Amkor Technology, Intel Corporation, Qualcomm Technologies Inc., Taiwan Semiconductor Manufacturing Company, IBM, Microchip Technology, Renesas Electronics Corporation, Texas Instruments, and Analog Devices, which are profiled in this report. The advanced packaging industry key market players adopt various strategies such as product launch, product development, collaboration, partnership, agreements, among others to influence the market growth.
Key Benefits For Stakeholders
Scope of Advanced Packaging Market Report
|
Report Metric |
Details |
|
Report Name |
Advanced Packaging Market |
|
Market size value in 2019 |
USD 29.42 billion |
|
Revenue forecast in 2027 |
USD 64.19 billion |
|
Growth Rate |
10.2% |
|
Base year considered |
2019 |
|
Forecast Period |
2020-2027 |
|
By Type |
Flip Chip CSP, Flip-Chip Ball Grid Array, Wafer Level CSP, 2.5D/3D, Fan Out WLP |
|
By End Use |
Consumer Electronics, Automotive, Industrial, Healthcare, Aerospace & Defense |
|
Report Coverage |
Revenue & volume forecast, company share, competitive landscape, growth factors, and trends |
|
Segments Covered |
By Type, End Use, and Region |
|
Geographic Regions Covered |
North America, Europe, Asia Pacific, Latin America, Middle East & Africa |
Ans. Due to the COVID-19 pandemic, The global advanced packaging market size was valued at $29.42 billion in 2019 and is projected to reach $64.19 billion by 2027, growing at a CAGR of 10.2% from 2020 to 2027.
Ans. Some of the Major companies are Amkor Technology, Intel Corporation, Qualcomm Technologies Inc., Taiwan Semiconductor Manufacturing Company, IBM, Microchip Technology, Renesas Electronics Corporation, Texas Instruments, and Analog Devices.
Ans. Yes, the report includes a COVID-19 impact analysis. Also, it is further extended into every individual segment of the report.
CHAPTER 1:INTRODUCTION
1.1.Report description
1.2.Key benefits for stakeholders
1.3.Key market segments
1.4.Research methodology
1.4.1.Primary research
1.4.2.Secondary research
1.4.3.Analyst tools and models
CHAPTER 2:EXECUTIVE SUMMARY
2.1.Key findings
2.1.1.Top impacting factors
2.1.2.Top investment pockets
2.1.3.Top winning strategies
2.2.CXO perspective
CHAPTER 3:MARKET OVERVIEW
3.1.Market definition and scope
3.2.Key Forces Shaping Advanced Packaging Market
3.3.Market share analysis, 2019
3.4.Market dynamics
3.4.1.Drivers
3.4.1.1.Increase in demand for miniaturization of devices
3.4.1.2.Improved system performances and optimization of advanced packaging
3.4.2.Restraint
3.4.2.1.High cost of advanced packaging is hampering its adoption
3.4.3.Opportunity
3.4.3.1.Emerging trends of fan-out wafer level packaging
CHAPTER 4:ADVANCED PACKAGING MARKET, BY TYPE
4.1.Overview
4.2.Flip Chip CSP
4.2.1.Key market trends, growth factors, and opportunities
4.2.2.Market size and forecast, by region
4.2.3.Market analysis, by country
4.3.Flip-Chip Ball Grid Array
4.3.1.Key market trends, growth factors, and opportunities
4.3.2.Market size and forecast, by region
4.3.3.Market analysis, by country
4.4.Wafer Level CSP
4.4.1.Key market trends, growth factors, and opportunities
4.4.2.Market size and forecast, by region
4.4.3.Market analysis, by country
4.5.2.5D/3D
4.5.1.Key market trends, growth factors, and opportunities
4.5.2.Market size and forecast, by region
4.5.3.Market analysis, by country
4.6.Fan-Out WLP
4.6.1.Key market trends, growth factors, and opportunities
4.6.2.Market size and forecast, by region
4.6.3.Market analysis, by country
4.7.Others
4.7.1.Key market trends, growth factors, and opportunities
4.7.2.Market size and forecast, by region
4.7.3.Market analysis, by country
CHAPTER 5:ADVANCED PACKAGING MARKET, BY END USE
5.1.Overview
5.2.Consumer Electronics
5.2.1.Key market trends, growth factors, and opportunities
5.2.2.Market size and forecast, by region
5.2.3.Market analysis, by country
5.3.Automotive
5.3.1.Key market trends, growth factors, and Opportunities
5.3.2.Market size and forecast, by region
5.3.3.Market analysis, by country
5.4.Industrial
5.4.1.Key market trends, growth factors, and Opportunities
5.4.2.Market size and forecast, by region
5.4.3.Market analysis, by country
5.5.Healthcare
5.5.1.Key market trends, growth factors, and Opportunities
5.5.2.Market size and forecast, by region
5.5.3.Market analysis, by country
5.6.Aerospace & Defense
5.6.1.Key market trends, growth factors, and Opportunities
5.6.2.Market size and forecast, by region
5.6.3.Market analysis, by country
5.7.Others
5.7.1.Key market trends, growth factors, and Opportunities
5.7.2.Market size and forecast, by region
5.7.3.Market analysis, by country
CHAPTER 6:ADVANCED PACKAGING MARKET, BY REGION
6.1.Overview
6.2.North America
6.2.1.Key market trends, growth factors, and opportunities
6.2.2.Market size and forecast, by type
6.2.3.Market size and forecast, by end use
6.2.4.Market analysis, by country
6.2.4.1.U.S.
6.2.4.1.1.Market size and forecast, by type
6.2.4.1.2.Market size and forecast, by end use
6.2.4.2.Canada
6.2.4.2.1.Market size and forecast, by type
6.2.4.2.2.Market size and forecast, by end use
6.2.4.3.Mexico
6.2.4.3.1.Market size and forecast, by type
6.2.4.3.2.Market size and forecast, by end use
6.3.Europe
6.3.1.Key market trends, growth factors, and opportunities’
6.3.2.Market size and forecast, by type
6.3.3.Market size and forecast, by end use
6.3.4.Market analysis, by country
6.3.4.1.UK
6.3.4.1.1.Market size and forecast, by type
6.3.4.1.2.Market size and forecast, by end use
6.3.4.2.Germany
6.3.4.2.1.Market size and forecast, by type
6.3.4.2.2.Market size and forecast, by end use
6.3.4.3.France
6.3.4.3.1.Market size and forecast, by type
6.3.4.3.2.Market size and forecast, by end use
6.3.4.4.Rest of Europe
6.3.4.4.1.Market size and forecast, by type
6.3.4.4.2.Market size and forecast, by end use
6.4.Asia-Pacific
6.4.1.Key market trends, growth factors, and opportunities
6.4.2.Market size and forecast, by type
6.4.3.Market size and forecast, by end use
6.4.4.Market analysis, by country
6.4.4.1.China
6.4.4.1.1.Market size and forecast, by type
6.4.4.1.2.Market size and forecast, by end use
6.4.4.2.Taiwan
6.4.4.2.1.Market size and forecast, by type
6.4.4.2.2.Market size and forecast, by end use
6.4.4.3.Japan
6.4.4.3.1.Market size and forecast, by type
6.4.4.3.2.Market size and forecast, by end use
6.4.4.4.South Korea
6.4.4.4.1.Market size and forecast, by type
6.4.4.4.2.Market size and forecast, by end use
6.4.4.5.Rest of Asia-Pacific
6.4.4.5.1.Market size and forecast, by type
6.4.4.5.2.Market size and forecast, by end use
6.5.LAMEA
6.5.1.Key market trends, growth factors, and opportunities
6.5.2.Market size and forecast, by type
6.5.3.Market size and forecast, by end use
6.5.4.Market analysis, by country
6.5.4.1.Latin America
6.5.4.1.1.Market size and forecast, by type
6.5.4.1.2.Market size and forecast, by end use
6.5.4.2.Middle East
6.5.4.2.1.Market size and forecast, by type
6.5.4.2.2.Market size and forecast, by end use
6.5.4.3.Africa
6.5.4.3.1.Market size and forecast, by type
6.5.4.3.2.Market size and forecast, by end use
CHAPTER 7:COMPANY PROFILES
7.1.RENESAS ELECTRONICS
7.1.1.Company overview
7.1.2.Company snapshot
7.1.3.Operating business segments
7.1.4.Product portfolio
7.1.5.R&D Expenditure
7.1.6.Business performance
7.2.TEXAS INSTRUMENTS
7.2.1.Company overview
7.2.2.Company snapshot
7.2.3.Operating business segments
7.2.4.Product portfolio
7.2.5.R&D Expenditure
7.2.6.Business performance
7.3.TOSHIBA CORPORATION
7.3.1.Company overview
7.3.2.Company snapshot
7.3.3.Operating business segments
7.3.4.Product portfolio
7.3.5.R&D Expenditure
7.3.6.Business performance
7.4.INTEL CORPORATION
7.4.1.Company overview
7.4.2.Company snapshot
7.4.3.Operating business segments
7.4.4.Product portfolio
7.4.5.R&D Expenditure
7.4.6.Business performance
7.4.7.Key strategic moves and developments
7.5.QUALCOMM TECHNOLOGIES, INC.
7.5.1.Company overview
7.5.2.Company snapshot
7.5.3.Operating business segments
7.5.4.Product portfolio
7.5.5.R&D Expenditure
7.5.6.Business performance
7.6.INTERNATIONAL BUSINESS MACHINES CORPORATION (IBM)
7.6.1.Company overview
7.6.2.Company snapshot
7.6.3.Operating business segments
7.6.4.Product portfolio
7.6.5.R&D Expenditure
7.6.6.Business performance
7.6.7.Key strategic moves and developments
7.7.ANALOG DEVICES, INC.
7.7.1.Company overview
7.7.2.Company snapshot
7.7.3.Operating business segments
7.7.4.Product portfolio
7.7.5.R&D Expenditure
7.7.6.Business performance
7.8.MICROCHIP TECHNOLOGY INC.
7.8.1.Company overview
7.8.2.Company snapshot
7.8.3.Operating business segments
7.8.4.Product portfolio
7.8.5.R&D Expenditure
7.8.6.Business performance
7.9.TAIWAN SEMICONDUCTOR MANUFACTURING COMPANY LIMITED
7.9.1.Company overview
7.9.2.Company snapshot
7.9.3.Operating business segments
7.9.4.Product portfolio
7.9.5.R&D Expenditure
7.9.6.Business performance
7.9.7.Key strategic moves and developments
7.10.AMKOR TECHNOLOGY
7.10.1.Company overview
7.10.2.Company snapshot
7.10.3.Operating business segments
7.10.4.Product portfolio
7.10.5.R&D Expenditure
7.10.6.Business performance
7.10.7.Key strategic moves and developments
LIST OF TABLES
TABLE 01.GLOBAL ADVANCED PACKAGING MARKET, BY TYPE, 2018-2026 ($MILLION)
TABLE 02.ADVANCED PACKAGING MARKET REVENUE FOR FLIP CHIP CSP, BY REGION 2018–2026 ($MILLION)
TABLE 03.ADVANCED PACKAGING MARKET REVENUE FOR FLIP-CHIP BALL GRID ARRAY, BY REGION 2018–2026($MILLION)
TABLE 04.ADVANCED PACKAGING MARKET REVENUE FOR WAFER LEVEL CSP, BY REGION 2018–2026($MILLION)
TABLE 05.ADVANCED PACKAGING MARKET REVENUE FOR 2.5D/3D, BY REGION 2018–2026($MILLION)
TABLE 06.ADVANCED PACKAGING MARKET REVENUE FOR FAN-OUT WLP, BY REGION 2018–2026($MILLION)
TABLE 07.ADVANCED PACKAGING MARKET REVENUE FOR OTHERS, BY REGION 2018–2026($MILLION)
TABLE 08.GLOBAL ADVANCED PACKAGING MARKET REVENUE, BY END USE, 2018-2026 ($MILLION)
TABLE 09.ADVANCED PACKAGING MARKET REVENUE FOR COUNSUMER ELECTRONICS, BY REGION 2018–2026($MILLION)
TABLE 10.ADVANCED PACKAGING MARKET REVENUE FOR AUTOMOTIVE, BY REGION 2018–2026($MILLION)
TABLE 11.ADVANCED PACKAGING MARKET REVENUE FOR INDUSTRIAL, BY REGION 2018–2026($MILLION)
TABLE 12.ADVANCED PACKAGING MARKET REVENUE FOR HEALTHCARE, BY REGION 2018–2026($MILLION)
TABLE 13.ADVANCED PACKAGING MARKET REVENUE FOR AEROSPACE & DEFENSE, BY REGION 2018–2026($MILLION)
TABLE 14.ADVANCED PACKAGING MARKET REVENUE FOR OTHERS, BY REGION 2018–2026($MILLION)
TABLE 15.NORTH AMERICA ADVANCED PACKAGING MARKET REVENUE, BY TYPE 2018–2026($MILLION)
TABLE 16.NORTH AMERICA ADVANCED PACKAGING MARKET REVENUE, BY END USE 2018–2026($MILLION)
TABLE 17.U.S. ADVANCED PACKAGING MARKET REVENUE, BY TYPE 2018–2026($MILLION)
TABLE 18.U.S. ADVANCED PACKAGING MARKET REVENUE, BY END USE 2018–2026($MILLION)
TABLE 19.CANADA ADVANCED PACKAGING MARKET REVENUE, BY TYPE 2018–2026($MILLION)
TABLE 20.CANADA ADVANCED PACKAGING MARKET REVENUE, BY END USE 2018–2026($MILLION)
TABLE 21.MEXICO ADVANCED PACKAGING MARKET REVENUE, BY TYPE 2018–2026($MILLION)
TABLE 22.MEXICO ADVANCED PACKAGING MARKET REVENUE, BY END USE 2018–2026($MILLION)
TABLE 23.EUROPE ADVANCED PACKAGING MARKET REVENUE, BY TYPE 2018–2026($MILLION)
TABLE 24.EUROPE ADVANCED PACKAGING MARKET REVENUE, BY END USE 2018–2026($MILLION)
TABLE 25.UK ADVANCED PACKAGING MARKET REVENUE, BY TYPE 2018–2026($MILLION)
TABLE 26.UK ADVANCED PACKAGING MARKET REVENUE, BY END USE 2018–2026($MILLION)
TABLE 27.GERMANY ADVANCED PACKAGING MARKET REVENUE, BY TYPE 2018–2026($MILLION)
TABLE 28.GERMANY ADVANCED PACKAGING MARKET REVENUE, BY END USE 2018–2026($MILLION)
TABLE 29.FRANCE ADVANCED PACKAGING MARKET REVENUE, BY TYPE 2018–2026($MILLION)
TABLE 30.FRANCE ADVANCED PACKAGING MARKET REVENUE, BY END USE 2018–2026($MILLION)
TABLE 31.REST OF EUROPE ADVANCED PACKAGING MARKET REVENUE, BY TYPE 2018–2026($MILLION)
TABLE 32.REST OF EUROPE ADVANCED PACKAGING MARKET REVENUE, BY END USE 2018–2026($MILLION)
TABLE 33.ASIA-PACIFIC ADVANCED PACKAGING MARKET REVENUE, BY TYPE 2018–2026($MILLION)
TABLE 34.ASIA-PACIFIC ADVANCED PACKAGING MARKET REVENUE, BY END USE 2018–2026($MILLION)
TABLE 35.CHINA ADVANCED PACKAGING MARKET REVENUE, BY TYPE 2018–2026($MILLION)
TABLE 36.CHINA ADVANCED PACKAGING MARKET REVENUE, BY END USE 2018–2026($MILLION)
TABLE 37.TAIWAN ADVANCED PACKAGING MARKET REVENUE, BY TYPE 2018–2026($MILLION)
TABLE 38.TAIWAN ADVANCED PACKAGING MARKET REVENUE, BY END USE 2018–2026($MILLION)
TABLE 39.JAPAN ADVANCED PACKAGING MARKET REVENUE, BY TYPE 2018–2026($MILLION)
TABLE 40.JAPAN ADVANCED PACKAGING MARKET REVENUE, BY END USE 2018–2026($MILLION)
TABLE 41.SOUTH KOREA ADVANCED PACKAGING MARKET REVENUE, BY TYPE 2018–2026($MILLION)
TABLE 42.SOUTH KOREA ADVANCED PACKAGING MARKET REVENUE, BY END USE 2018–2026($MILLION)
TABLE 43.REST OF ASIA-PACIFIC ADVANCED PACKAGING MARKET REVENUE, BY TYPE 2018–2026($MILLION)
TABLE 44.REST OF ASIA-PACIFIC ADVANCED PACKAGING MARKET REVENUE, BY END USE 2018–2026($MILLION)
TABLE 45.LAMEA ADVANCED PACKAGING MARKET REVENUE, BY TYPE 2018–2026($MILLION)
TABLE 46.LAMEA ADVANCED PACKAGING MARKET REVENUE, BY END USE 2018–2026($MILLION)
TABLE 47.LATIN AMERICA ADVANCED PACKAGING MARKET REVENUE, BY TYPE 2018–2026($MILLION)
TABLE 48.LATIN AMERICA ADVANCED PACKAGING MARKET REVENUE, BY END USE 2018–2026($MILLION)
TABLE 49.MIDDLE EAST ADVANCED PACKAGING MARKET REVENUE, BY TYPE 2018–2026($MILLION)
TABLE 50.MIDDLE EAST ADVANCED PACKAGING MARKET REVENUE, BY END USE 2018–2026($MILLION)
TABLE 51.AFRICA ADVANCED PACKAGING MARKET REVENUE, BY TYPE 2018–2026($MILLION)
TABLE 52.AFRICA ADVANCED PACKAGING MARKET REVENUE, BY END USE 2018–2026($MILLION)
TABLE 53.COMPANY SNAPSHOT
TABLE 54.RENESAS: OPERATING SEGMENTS
TABLE 55.RENESAS: PRODUCT PORTFOLIO
TABLE 56.RENESAS: R&D EXPENDITURE, 2016–2018 ($MILLION)
TABLE 57.RENESAS: NET SALES, 2016–2018 ($MILLION)
TABLE 58.COMPANY SNAPSHOT
TABLE 59.TI: OPERATING SEGMENTS
TABLE 60.TI: PRODUCT PORTFOLIO
TABLE 61.TI: R&D EXPENDITURE, 2016–2018 ($MILLION)
TABLE 62.TI: NET SALES, 2016–2018 ($MILLION)
TABLE 63.TOSHIBA: COMPANY SNAPSHOT
TABLE 64.TOSHIBA: OPERATING SEGMENTS
TABLE 65.TOSHIBA: PRODUCT PORTFOLIO
TABLE 66.TOSHIBA: R&D EXPENDITURE, 2016–2018 ($MILLION)
TABLE 67.TOSHIBA: NET SALES, 2016–2018 ($MILLION)
TABLE 68.INTEL CORPORATION: COMPANY SNAPSHOT
TABLE 69.INTEL CORPORATION: OPERATING SEGMENTS
TABLE 70.INTEL CORPORATION: PRODUCT PORTFOLIO
TABLE 71.INTEL CORPORATION: R&D EXPENDITURE, 2016–2018 ($MILLION)
TABLE 72.INTEL CORPORATION: NET SALES, 2016–2018 ($MILLION)
TABLE 73.INTEL CORPORATION: KEY STRATEGIC MOVES AND DEVELOPMENTS
TABLE 74.QUALCOMM TECHNOLOGIES, INC.: COMPANY SNAPSHOT
TABLE 75.QUALCOMM TECHNOLOGIES, INC.: PRODUCT CATEGORY
TABLE 76.QUALCOMM TECHNOLOGIES, INC.: PRODUCT PORTFOLIO
TABLE 77.QUALCOMM TECHNOLOGIES: R&D EXPENDITURE, 2016–2018 ($MILLION)
TABLE 78.QUALCOMM TECHNOLOGIES: NET SALES, 2016–2018 ($MILLION)
TABLE 79.INTERNATIONAL BUSINESS MACHINES CORPORATION (IBM): COMPANY SNAPSHOT
TABLE 80.INTERNATIONAL BUSINESS MACHINES CORPORATION (IBM): OPERATING SEGMENTS
TABLE 81.INTERNATIONAL BUSINESS MACHINES CORPORATION (IBM): PRODUCT PORTFOLIO
TABLE 82.INTERNATIONAL BUSINESS MACHINES CORPORATION (IBM): R&D EXPENDITURE, 2016–2018 ($MILLION)
TABLE 83.INTERNATIONAL BUSINESS MACHINES CORPORATION (IBM): NET SALES, 2016–2018 ($MILLION)
TABLE 84.INTERNATIONAL BUSINESS MACHINES CORPORATION (IBM): KEY STRATEGIC MOVES AND DEVELOPMENTS
TABLE 85.ANALOG DEVICES: COMPANY SNAPSHOT
TABLE 86.ANALOG DEVICES: OPERATING SEGMENTS
TABLE 87.ANALOG DEVICES: PRODUCT PORTFOLIO
TABLE 88.ANALOG DEVICES: R&D EXPENDITURE, 2016–2018 ($MILLION)
TABLE 89.ANALOG DEVICES: NET SALES, 2016–2018 ($MILLION)
TABLE 90.MICROCHIP TECHNOLOGY INC.: COMPANY SNAPSHOT
TABLE 91.MICROCHIP TECHNOLOGY INC.: OPERATING SEGMENTS
TABLE 92.MICROCHIP TECHNOLOGY INC.: PRODUCT PORTFOLIO
TABLE 93.MICROCHIP TECHNOLOGY INC: R&D EXPENDITURE, 2016–2018 ($MILLION)
TABLE 94.MICROCHIP TECHNOLOGY INC.: NET SALES, 2016–2018 ($MILLION)
TABLE 95.TSMC: COMPANY SNAPSHOT
TABLE 96.TSMC: OPERATING SEGMENTS
TABLE 97.TSMC: PRODUCT PORTFOLIO
TABLE 98.TSMC: R&D EXPENDITURE, 2016–2018 ($MILLION)
TABLE 99.TSMC: NET SALES, 2016–2018 ($MILLION)
TABLE 100.TSMC: KEY STRATEGIC MOVES AND DEVELOPMENTS
TABLE 101.AMKOR TECHNOLOGY: COMPANY SNAPSHOT
TABLE 102.AMKOR TECHNOLOGY: OPERATING SEGMENTS
TABLE 103.AMKOR TECHNOLOGY: PRODUCT PORTFOLIO
TABLE 104.AMKOR TECHNOLOGY: R&D EXPENDITURE, 2016–2018 ($MILLION)
TABLE 105.AMKOR TECHNOLOGY: REVENUE, 2016–2018 ($MILLION)
TABLE 106.AMKOR TECHNOLOGY: KEY STRATEGIC MOVES AND DEVELOPMENTS
LIST OF FIGURES
FIGURE 01.KEY MARKET SEGMENTS
FIGURE 02.EXECUTIVE SUMMARY, BY SEGMENT
FIGURE 03.EXECUTIVE SUMMARY, REGION
FIGURE 04.TOP IMPACTING FACTORS
FIGURE 05.TOP INVESTMENT POCKETS
FIGURE 06.TOP WINNING STRATEGIES, BY YEAR, 2017–2019*
FIGURE 07.TOP WINNING STRATEGIES, BY YEAR, 2017–2019*
FIGURE 08.TOP WINNING STRATEGIES, BY COMPANY, 2017–2019*
FIGURE 09.HIGH BARGAINING POWER OF SUPPLIERS
FIGURE 10.MODERATE THREAT OF NEW ENTRANTS
FIGURE 11.MODERATE THREAT OF SUBSTITUTES
FIGURE 12.MODERATE-TO-HIGH INTENSITY OF RIVALRY
FIGURE 13.MODERATE BARGAINING POWER OF BUYERS
FIGURE 14.MARKET SHARE ANALYSIS, 2019
FIGURE 15.GLOBAL ADVANCED PACKAGING MARKET, BY TYPE, 2018-2026
FIGURE 16.COMPARATIVE SHARE ANALYSIS OF FLIP CHIP CSP ADVANCED PACKAGING MARKET, BY COUNTRY, 2018 & 2026 (%)
FIGURE 17.COMPARATIVE SHARE ANALYSIS OF FLIP-CHIP BALL GRID ARRAY ADVANCED PACKAGING MARKET, BY COUNTRY, 2018 & 2026 (%)
FIGURE 18.COMPARATIVE SHARE ANALYSIS OF WAFER LEVEL CSP ADVANCED PACKAGING MARKET, BY COUNTRY, 2018 & 2026 (%)
FIGURE 19.COMPARATIVE SHARE ANALYSIS OF 2.5D/3D ADVANCED PACKAGING MARKET, BY COUNTRY, 2018 & 2026 (%)
FIGURE 20.COMPARATIVE SHARE ANALYSIS OF FAN-OUT WLP ADVANCED PACKAGING MARKET, BY COUNTRY, 2018 & 2026 (%)
FIGURE 21.COMPARATIVE SHARE ANALYSIS OF OTHERS ADVANCED PACKAGING MARKET, BY COUNTRY, 2018 & 2026 (%)
FIGURE 22.GLOBAL ADVANCED PACKAGING MARKET, BY END USE, 2018-2026
FIGURE 23.COMPARATIVE SHARE ANALYSIS OF CONSUMER ELECTRONICS ADVANCED PACKAGING MARKET, BY COUNTRY, 2018 & 2026 (%)
FIGURE 24.COMPARATIVE SHARE ANALYSIS OF AUTOMOTIVE ADVANCED PACKAGING MARKET, BY COUNTRY, 2018 & 2026 (%)
FIGURE 25.COMPARATIVE SHARE ANALYSIS OF INDUSTRIAL ADVANCED PACKAGING MARKET, BY COUNTRY, 2018 & 2026 (%)
FIGURE 26.COMPARATIVE SHARE ANALYSIS OF HEALTHCARE ADVANCED PACKAGING MARKET, BY COUNTRY, 2018 & 2026 (%)
FIGURE 27.COMPARATIVE SHARE ANALYSIS OF AEROSPACE & DEFENSE ADVANCED PACKAGING MARKET, BY COUNTRY, 2018 & 2026 (%)
FIGURE 28.COMPARATIVE SHARE ANALYSIS OF OTHERS ADVANCED PACKAGING MARKET, BY COUNTRY, 2018 & 2026 (%)
FIGURE 29.GLOBAL ADVANCED PACKAGING MARKET, BY REGION, 2018-2026
FIGURE 30.NORTH AMERICA ADVANCED PACKAGING MARKET, BY COUNTRY, 2018-2026
FIGURE 31.U.S. ADVANCED PACKAGING MARKET REVENUE, 2018-2026($MILLION)
FIGURE 32.CANADA ADVANCED PACKAGING MARKET REVENUE, 2018-2026($MILLION)
FIGURE 33.MEXICO ADVANCED PACKAGING MARKET REVENUE, 2018-2026($MILLION)
FIGURE 34.EUROPE ADVANCED PACKAGING MARKET, BY COUNTRY, 2018-2026
FIGURE 35.UK ADVANCED PACKAGING MARKET REVENUE, 2018-2026($MILLION)
FIGURE 36.GERMANY ADVANCED PACKAGING MARKET REVENUE, 2018-2026($MILLION)
FIGURE 37.FRANCE ADVANCED PACKAGING MARKET REVENUE, 2018-2026($MILLION)
FIGURE 38.REST OF EUROPE ADVANCED PACKAGING MARKET REVENUE, 2018-2026($MILLION)
FIGURE 39.ASIA-PACIFIC ADVANCED PACKAGING MARKET, BY COUNTRY, 2018-2026
FIGURE 40.CHINA ADVANCED PACKAGING MARKET REVENUE, 2018-2026($MILLION)
FIGURE 41.TAIWAN ADVANCED PACKAGING MARKET REVENUE, 2018-2026($MILLION)
FIGURE 42.JAPAN ADVANCED PACKAGING MARKET REVENUE, 2018-2026($MILLION)
FIGURE 43.SOUTH KOREA ADVANCED PACKAGING MARKET REVENUE, 2018-2026($MILLION)
FIGURE 44.REST OF ASIA-PACIFIC ADVANCED PACKAGING MARKET REVENUE, 2018-2026($MILLION)
FIGURE 45.LAMEA ADVANCED PACKAGING MARKET, BY COUNTRY, 2018-2026
FIGURE 46.LATIN AMERICA ADVANCED PACKAGING MARKET REVENUE, 2018-2026($MILLION)
FIGURE 47.MIDDLE EAST ADVANCED PACKAGING MARKET REVENUE, 2018-2026($MILLION)
FIGURE 48.AFRICA ADVANCED PACKAGING MARKET REVENUE, 2018-2026($MILLION)
FIGURE 49.RENESAS: R&D EXPENDITURE, 2016–2018 ($MILLION)
FIGURE 50.RENESAS: NET SALES, 2016–2018 ($MILLION)
FIGURE 51.RENESAS: REVENUE SHARE BY SEGMENT, 2018 (%)
FIGURE 52.RENESAS: REVENUE SHARE, BY REGION, 2018 (%)
FIGURE 53.TI: R&D EXPENDITURE, 2016–2018 ($MILLION)
FIGURE 54.TI: NET SALES, 2016–2018 ($MILLION)
FIGURE 55.TI: REVENUE SHARE BY SEGMENT, 2018 (%)
FIGURE 56.TI: REVENUE SHARE BY REGION, 2018 (%)
FIGURE 57.TOSHIBA: R&D EXPENDITURE, 2016–2018 ($MILLION)
FIGURE 58.TOSHIBA: NET SALES, 2016–2018 ($MILLION)
FIGURE 59.TOSHIBA: REVENUE SHARE BY SEGMENT, 2018 (%)
FIGURE 60.TOSHIBA: REVENUE SHARE BY REGION, 2018 (%)
FIGURE 61.R&D EXPENDITURE, 2016–2018 ($MILLION)
FIGURE 62.INTEL CORPORATION: NET SALES, 2018–2018 ($MILLION)
FIGURE 63.INTEL CORPORATION: REVENUE SHARE BY SEGMENT, 2018 (%)
FIGURE 64.INTEL CORPORATION: REVENUE SHARE BY REGION, 2018 (%)
FIGURE 65.R&D EXPENDITURE, 2016–2018 ($MILLION)
FIGURE 66.QUALCOMM TECHNOLOGIES, INC.: REVENUE, 2016–2018 ($MILLION)
FIGURE 67.QUALCOMM TECHNOLOGIES, INC.: REVENUE SHARE BY SEGMENT, 2018 (%)
FIGURE 68.QUALCOMM TECHNOLOGIES, INC.: REVENUE SHARE BY REGION, 2018 (%)
FIGURE 69.R&D EXPENDITURE, 2016–2018 ($MILLION)
FIGURE 70.INTERNATIONAL BUSINESS MACHINES CORPORATION (IBM): REVENUE, 2016–2018 ($MILLION)
FIGURE 71.INTERNATIONAL BUSINESS MACHINES CORPORATION (IBM): REVENUE SHARE BY SEGMENT, 2018 (%)
FIGURE 72.INTERNATIONAL BUSINESS MACHINES CORPORATION (IBM): REVENUE SHARE BY REGION, 2018 (%)
FIGURE 73.ANALOG DEVICES: R&D EXPENDITURE, 2017–2019 ($MILLION)
FIGURE 74.ANALOG DEVICES: NET SALES, 2017–2019 ($MILLION)
FIGURE 75.ANALOG DEVICES: REVENUE SHARE BY SEGMENT, 2019 (%)
FIGURE 76.ANALOG DEVICES: REVENUE SHARE BY REGION, 2019 (%)
FIGURE 77.MICROCHIP TECHNOLOGY INC.: R&D EXPENDITURE, 2016–2018 ($MILLION)
FIGURE 78.MICROCHIP TECHNOLOGY INC.: NET SALES, 2016–2018 ($MILLION)
FIGURE 79.MICROCHIP TECHNOLOGY INC.: REVENUE SHARE BY SEGMENT, 2018 (%)
FIGURE 80.MICROCHIP TECHNOLOGY INC.: REVENUE SHARE BY REGION, 2018 (%)
FIGURE 81.TSMC: R&D EXPENDITURE, 2016–2018 ($MILLION)
FIGURE 82.TSMC: NET SALES, 2016–2018 ($MILLION)
FIGURE 83.TSMC: REVENUE SHARE BY REGION, 2018 (%)
FIGURE 84.AMKOR TECHNOLOGY: R&D EXPENDITURE, 2016–2018 ($MILLION)
FIGURE 85.AMKOR TECHNOLOGY: REVENUE, 2016–2018 ($MILLION)
FIGURE 86.AMKOR TECHNOLOGY: REVENUE SHARE BY PRODUCT GROUP, 2018 (%)
FIGURE 87.AMKOR TECHNOLOGY: REVENUE SHARE BY REGION, 2018 (%)
$5769
$10995
HAVE A QUERY?
OUR CUSTOMER

SIMILAR REPORTS