
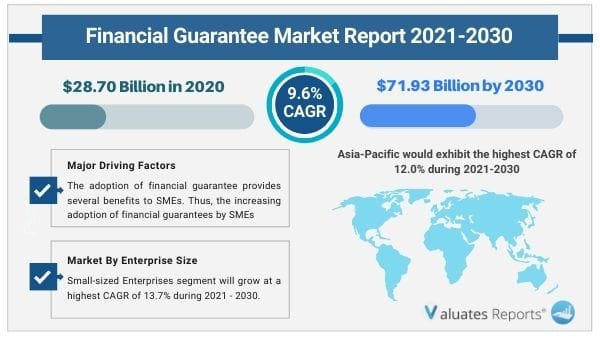
The global financial guarantee market size was valued at $28.70 billion in 2020 and is projected to reach $71.93 billion by 2030, growing at a CAGR of 9.6% from 2021 to 2030. A financial guarantee in the corporate world is a non-cancellable indemnity. This is a bond backed by an insurer or other secure financial institution. It gives investors a guarantee towards the payment of principal and interest amounts within a contract. Many insurance companies specialize in financial guarantees and similar products used by debt issuers as a way of attracting investors. Moreover, the guarantee gives investors comfort that the investment will be repaid if the securities issuer does not fulfill the contractual obligation to make timely payments.
Due to increased uncertainty and protectionism in global trade, shifts in supply chain demands, and business closures across several industry verticals, the COVID-19 pandemic have had a negative impact on the financial guarantee market. Furthermore, in order to stop the virus from spreading, numerous government authorities in various nations had enacted strict trade restrictions, resulting in geopolitical tensions and a rapid shift in trade patterns.
Financial guarantee helps the businesses to recover the loss owing to deferred payments from debtors. In addition, financial guarantee reduces the risk and mistrust between seller and consumer by acting as an assurer. Therefore, increasing financial risk involved in business transactions in driving the growth of the market. The financial guarantees require less documentation and therefore, processing of loan becomes easier and simple for the banks. Therefore, this is a major growth factor for the growth of the market. However, an individual with a poor credit history cannot obtain a financial guarantee for the business or other activities. Thus, strict assessment by the banks before providing financial guarantee is restraining the growth of the market. Contrarily, the automation of document verification and credibility checking procedures have increased the efficiency of the banks. Moreover, the automation of the documentation procedures has decreased loan application delays and made it more convenient for consumers. Thus, digitalization of banking procedures to obtain financial guarantee will provide various growth opportunities with technological advancements in future.
The report focuses on growth prospects, restraints, and trends of the financial guarantee market analysis. The study provides Porter’s five forces analysis to understand the impact of various factors, such as bargaining power of suppliers, competitive intensity of competitors, threat of new entrants, threat of substitutes, and bargaining power of buyers, on the financial guarantee market.
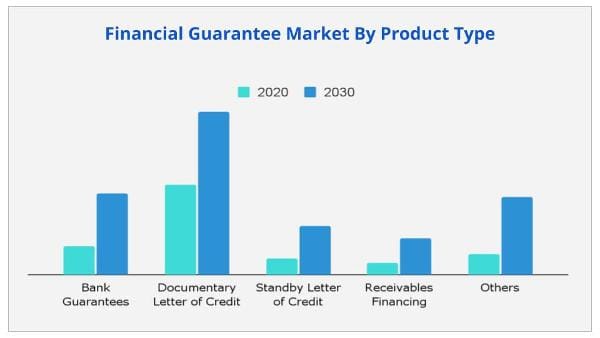
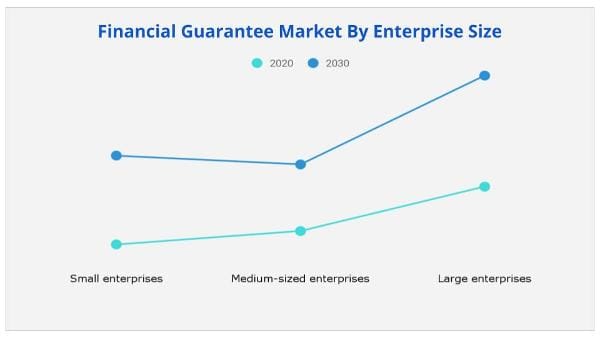
The financial guarantee market is segmented on the basis of product type, enterprise size, end user and region. By type, the market is segregated into bank guarantees, documentary letter of credit, standby letter of credit (SBLC), receivables financing, and others. Depending on enterprise size, it is fragmented into small enterprises, medium-sized enterprises, and large enterprises. On the basis of end user, it is bifurcated into exporters and importers. By region, it is analyzed across North America, Europe, Asia-Pacific, and LAMEA.
The report analyzes the profiles of key players operating in the financial guarantee market such as Asian Development Bank, BNP Paribas, Barclays, Bank of Montreal, Citibank, HSBC, ICBC, National Bank of Canada, SINOSURE and Scotia Bank. These players have adopted various strategies to increase their market penetration and strengthen their position in the financial guarantee market.
Due to increased uncertainty and protectionism in global trade, shifts in supply chain demands, and business closures across several industry verticals, the COVID-19 pandemic has had a negative impact on the financial guarantee market. Additionally, the government's lockdown has impacted a number of SMEs that rely on financial guarantees to develop their businesses. However, due to certain policy measures introduced by government, some businesses had managed to remain afloat in the market. In addition, certain relaxation in interest rates by the authorities have helped many businesses to obtain financial guarantees to expand their businesses. Thus, the COVID-19 had a negative impact on financial guarantee industry.
Consumer items, motor vehicles & components, electronic & electrical equipment, industrial machinery, industrial chemicals, and plastic & rubber products are all imported by many countries. Furthermore, numerous nations export crude oil, automobiles, and gold. These items are in high demand, and is expected to continue to this trend in the upcoming years. As a result, surge in import and export activity is expected to give lucrative opportunities for the financial guarantee sector to expand, as more buyers and sellers seek financial guarantees from banks. Thus, rise import and export activities in developing countries is expected to open new avenues for the growth of the market.
Guarantees are often charged at a low rate by banks, which is advantageous to small businesses. As a result, it enables SMEs to utilize available extra funds which further fuels the market growth. In addition, the necessity for fewer documentation for a financial guarantee has made it convenient for SMEs to get loans. Additionally, the fees charged by banks is very nominal due to which it is a cost-effective solution for the SMEs. Furthermore, financial guarantees assist SMEs in maintaining a positive credit score in order to get larger loans in the future. Hence, the adoption of financial guarantee provides several benefits to SMEs. Thus, the increasing adoption of financial guarantees by SMEs is propelling the financial guarantee market growth.
When a customer contacts a bank for a bank guarantee, the bank evaluates the customer's creditworthiness as well as financial health. Before issuing a guarantee, the bank conducts a thorough financial investigation of the applicant. This procedure can become rather difficult at times, resulting in either no guarantee or significant delays in obtaining a guarantee. Moreover, an individual with a poor credit history cannot obtain a financial guarantee for businesses or other activities. Thus, the strict assessment by the banks before providing financial guarantee is restraining the growth of the market.
|
Report Metric |
Details |
|
Report Name |
Financial Guarantee Market |
|
The market size in 2020 |
USD 28.70 Billion |
|
The revenue forecast in 2030 |
USD 71.93 Billion |
|
Growth Rate |
Compound Annual Growth Rate (CAGR) of 9.6% from 2021 to 2030 |
|
Market size available for years |
2021-2030 |
|
Forecast units |
Value (USD) |
|
Segments covered |
Product Type, Enterprise Size, End-User, and Region |
|
Report coverage |
Revenue & volume forecast, company share, competitive landscape, growth factors, and trends |
|
Geographic regions covered |
North America, Europe, Asia Pacific, Latin America, Middle East & Africa |
Ans. The global financial guarantee market size was valued at $28.70 billion in 2020, and is projected to reach $71.93 billion by 2030, growing at a CAGR of 9.6% from 2021 to 2030.
Ans. The adoption of financial guarantee provides several benefits to SMEs. Thus, the increasing adoption of financial guarantees by SMEs is propelling the financial guarantee market growth.
Ans. The key players profiled in the report include Asian Development Bank, BNP Paribas, Barclays, Bank of Montreal, Citibank, HSBC, ICBC, National Bank of Canada, SINOSURE and Scotia Bank, and many more.
Ans. The Financial Guarantee Market is segmented on the basis of product type, enterprise size, end user and region.
Ans. Bank Guarantees Segment holds a dominant position throughout the forecast period.
Ans. Small-sized Enterprises segment will grow at a highest CAGR of 13.7% during 2020 - 2030.
CHAPTER 1:INTRODUCTION
1.1.Report description
1.2.Key benefits for stakeholders
1.3.Key market segments
1.4.Research methodology
1.4.1.Secondary research
1.4.2.Primary research
1.4.3.Analyst tools and models
CHAPTER 2:EXECUTIVE SUMMARY
2.1.Key findings
2.1.1.Top impacting factors
2.1.2.Top investment pockets
2.2.CXO perspective
CHAPTER 3:MARKET OVERVIEW
3.1.Market definition and scope
3.2.Key forces shaping global financial guarantee market
3.3.Market dynamics
3.3.1.Drivers
3.3.1.1.1.Increase in financial risk involved in business transactions
3.3.1.1.2.Increasing adoption of financial guarantees by SMEs
3.3.1.1.3.Quick processing of documents by banks
3.3.2.Restraints
3.3.2.1.1.Collateral demanded by banks
3.3.2.1.2.Strict assessment by the banks before providing financial guarantee
3.3.3.Opportunities
3.3.3.1.Individuals and businesses improving financial credibility
3.3.3.1.1.Rise in import and export activities in developing countries
3.3.3.1.2.Digitalization of banking procedures to obtain financial guarantee
3.4.COVID-19 impact analysis on financial guarantee market
3.4.1.Impact on financial guarantee market size
3.4.2.Change in consumer trends, preferences, and budget impact, owing to COVID-19
3.4.3.Framework for market challenges faced by financial guarantee providers
3.4.4.Economic impact on financial guarantee providers
3.4.5.Key player strategies to tackle negative impact on the industry
3.4.6.Opportunity analysis for financial guarantee providers
CHAPTER 4:FINANCIAL GUARANTEE MARKET, BY PRODUCT TYPE
4.1.Overview
4.2.Bank guarantees
4.2.1.Key market trends, growth factors, and opportunities
4.2.2.Market size and forecast, by region
4.2.3.Market analysis, by country
4.3.Documentary letter of credit
4.3.1.Key market trends, growth factors, and opportunities
4.3.2.Market size and forecast, by region
4.3.3.Market analysis, by country
4.4.Standby letter of credit (SBLC)
4.4.1.Key market trends, growth factors, and opportunities
4.4.2.Market size and forecast, by region
4.4.3.Market analysis, by country
4.5.Receivable financing
4.5.1.Key market trends, growth factors, and opportunities
4.5.2.Market size and forecast, by region
4.5.3.Market analysis, by country
4.6.Others
4.6.1.Key market trends, growth factors, and opportunities
4.6.2.Market size and forecast, by region
4.6.3.Market analysis, by country
CHAPTER 5:FINANCIAL GUARANTEE MARKET, BY ENTERPRISE SIZE
5.1.Overview
5.2.Small enterprises
5.2.1.Key market trends, growth factors, and opportunities
5.2.2.Market size and forecast, by region
5.2.3.Market analysis, by country
5.3.Medium-sized enterprises
5.3.1.Key market trends, growth factors, and opportunities
5.3.2.Market size and forecast, by region
5.3.3.Market analysis, by country
5.4.Large enterprises
5.4.1.Key market trends, growth factors, and opportunities
5.4.2.Market size and forecast, by region
5.4.3.Market analysis, by country
CHAPTER 6:FINANCIAL GUARANTEE MARKET, BY END USER
6.1.Overview
6.2.Exporters
6.2.1.Key market trends, growth factors, and opportunities
6.2.2.Market size and forecast, by region
6.2.3.Market analysis, by country
6.3.Importers
6.3.1.Key market trends, growth factors, and opportunities
6.3.2.Market size and forecast, by region
6.3.3.Market analysis, by country
CHAPTER 7:FINANCIAL GUARANTEE MARKET, BY REGION
7.1.Overview
7.1.1.Market size and forecast
7.3.North America
7.3.1.Key market trends, growth factors, and opportunities
7.3.2.Market size and forecast, by product type
7.3.3.Market size and forecast, by enterprise size
7.3.4.Market size and forecast, by end user
7.3.5.Market analysis, by country
7.3.5.1.U.S.
7.3.5.1.1.Market size and forecast, by product type
7.3.5.1.3.Market size and forecast, by enterprise size
7.3.5.1.4.Market size and forecast, by end user
7.3.5.2.Canada
7.3.5.2.1.Market size and forecast, by product type
7.3.5.2.3.Market size and forecast, by enterprise size
7.3.5.2.4.Market size and forecast, by end user
7.3.5.3.Mexico
7.3.5.3.1.Market size and forecast, by product type
7.3.5.3.3.Market size and forecast, by enterprise size
7.3.5.3.4.Market size and forecast, by end user
7.1.Europe
7.1.1.Key market trends, growth factors, and opportunities
7.1.2.Market size and forecast, by product type
7.1.3.Market size and forecast, by enterprise size
7.1.4.Market size and forecast, by end user
7.1.5.Market analysis, by country
7.1.5.1.Germany
7.1.5.1.1.Market size and forecast, by product type
7.1.5.1.3.Market size and forecast, by enterprise size
7.1.5.1.4.Market size and forecast, by end user
7.1.5.2.France
7.1.5.2.1.Market size and forecast, by product type
7.1.5.2.3.Market size and forecast, by enterprise size
7.1.5.2.4.Market size and forecast, by end user
7.1.5.3.UK
7.1.5.3.1.Market size and forecast, by product type
7.1.5.3.3.Market size and forecast, by enterprise size
7.1.5.3.4.Market size and forecast, by end user
7.1.5.4.Italy
7.1.5.4.1.Market size and forecast, by product type
7.1.5.4.3.Market size and forecast, by enterprise size
7.1.5.4.4.Market size and forecast, by end user
7.1.5.5.Spain
7.1.5.5.1.Market size and forecast, by product type
7.1.5.5.3.Market size and forecast, by enterprise size
7.1.5.5.4.Market size and forecast, by end user
7.1.5.6.Russia
7.1.5.6.1.Market size and forecast, by product type
7.1.5.6.3.Market size and forecast, by enterprise size
7.1.5.6.4.Market size and forecast, by end user
7.1.5.7.Rest of Europe
7.1.5.7.1.Market size and forecast, by product type
7.1.5.7.3.Market size and forecast, by enterprise size
7.1.5.7.4.Market size and forecast, by end user
7.2.Asia-Pacific
7.2.1.Key market trends, growth factors, and opportunities
7.2.2.Market size and forecast, by product type
7.2.3.Market size and forecast, by enterprise size
7.2.4.Market size and forecast, by end user
7.2.5.Market analysis, by country
7.2.5.1.China
7.2.5.1.1.Market size and forecast, by product type
7.2.5.1.3.Market size and forecast, by enterprise size
7.2.5.1.4.Market size and forecast, by end user
7.2.5.2.Japan
7.2.5.2.1.Market size and forecast, by product type
7.2.5.2.3.Market size and forecast, by enterprise size
7.2.5.2.4.Market size and forecast, by end user
7.2.5.3.India
7.2.5.3.1.Market size and forecast, by product type
7.2.5.3.3.Market size and forecast, by enterprise size
7.2.5.3.4.Market size and forecast, by end user
7.2.5.4.Australia
7.2.5.4.1.Market size and forecast, by product type
7.2.5.4.3.Market size and forecast, by enterprise size
7.2.5.4.4.Market size and forecast, by end user
7.2.5.5.South Korea
7.2.5.5.1.Market size and forecast, by product type
7.2.5.5.3.Market size and forecast, by enterprise size
7.2.5.5.4.Market size and forecast, by end user
7.2.5.6.Rest of Asia-Pacific
7.2.5.6.1.Market size and forecast, by product type
7.2.5.6.3.Market size and forecast, by enterprise size
7.2.5.6.4.Market size and forecast, by end user
7.3.LAMEA
7.3.1.Key market trends, growth factors, and opportunities
7.3.2.Market size and forecast, by product type
7.3.3.Market size and forecast, by enterprise size
7.3.4.Market size and forecast, by end user
7.3.5.Market analysis, by country
7.3.5.1.Brazil
7.3.5.1.1.Market size and forecast, by product type
7.3.5.1.3.Market size and forecast, by enterprise size
7.3.5.1.4.Market size and forecast, by end user
7.3.5.2.Turkey
7.3.5.2.1.Market size and forecast, by product type
7.3.5.2.3.Market size and forecast, by enterprise size
7.3.5.2.4.Market size and forecast, by end user
7.3.5.3.Saudi Arabia
7.3.5.3.1.Market size and forecast, by product type
7.3.5.3.3.Market size and forecast, by enterprise size
7.3.5.3.4.Market size and forecast, by end user
7.3.5.4.South Africa
7.3.5.4.1.Market size and forecast, by product type
7.3.5.4.3.Market size and forecast, by enterprise size
7.3.5.4.4.Market size and forecast, by end user
7.3.5.5.Rest of LAMEA
7.3.5.5.1.Market size and forecast, by product type
7.3.5.5.3.Market size and forecast, by enterprise size
7.3.5.5.4.Market size and forecast, by end user
CHAPTER 8:COMPETITIVE LANDSCAPE
8.1.Introduction
8.1.1.Market player positioning, 2020
8.2.Competitive dashboard
8.2.1.Top winning strategies
CHAPTER 9:COMPANY PROFILES
9.1.ASIAN DEVELOPMENT BANK
9.1.1.Company overview
9.1.2.Company snapshot
9.1.3.Product portfolio
9.1.4.Business performance
9.2.BNP Paribas
9.2.1.Company overview
9.2.2.Company snapshot
9.2.4.Product portfolio
9.2.5.Business performance
9.2.6.Key strategic moves and developments
9.3.Barclays PLC
9.3.1.Company overview
9.3.2.Company snapshot
9.3.3.Operating business segments
9.3.4.Product portfolio
9.3.5.Business performance
9.3.6.Key strategic moves and developments
9.4.Banque de Montreal (Bank of Montreal)
9.4.1.Company overview
9.4.2.Company snapshot
9.4.3.Product portfolio
9.4.4.Business performance
9.5.Citigroup Inc.
9.5.1.Company overview
9.5.2.Company snapshot
9.5.4.Product portfolio
9.5.5.Business performance
9.5.6.Key strategic moves and developments
9.6.HSBC Holdings PLC
9.6.1.Company overview
9.6.2.Company snapshot
9.6.3.Product portfolio
9.6.4.Business performance
9.6.5.Key strategic moves and developments
9.7.Industrial and Commercial Bank of China Limited (ICBC)
9.7.1.Company overview
9.7.2.Company snapshot
9.7.3.Product portfolio
9.8.Banque Nationale du Canada (National Bank of Canada)
9.8.1.Company overview
9.8.2.Company snapshot
9.8.3.Operating business segments
9.8.4.Product portfolio
9.8.5.Business performance
9.9.Scotia Bank
9.9.1.Company overview
9.9.2.Company snapshot
9.9.3.Product portfolio
9.9.4.Company snapshot
9.9.5.Product portfolio
9.9.6.Business performance
9.10.SINOSURE
9.10.1.Company overview
9.10.2.Company snapshot
9.10.3.Product portfolio
Table 01.Financial Guarantee Market Revenue, By Product Type, 2020–2030 ($Million)
Table 02.Financial Guarantee Market Revenue For Bank Guarantees, By Region, 2020-2030 ($Million)
Table 03.Financial Guarantee Market Revenue For Documentary Letter Of Credit, By Region, 2020-2030 ($Million)
Table 04.Financial Guarantee Market Revenue For Standby Letter Of Credit (Sblc), By Region, 2020-2030 ($Million)
Table 05.Financial Guarantee Market Revenue For Receivables Financing, By Region, 2020-2030 ($Million)
Table 06.Financial Guarantee Market Revenue For Others, By Region, 2020-2030 ($Million)
Table 07.Financial Guarantee Market Revenue, By Enterprise Size, 2020–2030 ($Million)
Table 08.Financial Guarantee Market Revenue For Small Enterprises, By Region, 2020-2030 ($Million)
Table 09.Financial Guarantee Market Revenue For Medium-Sized Enterprises, By Region, 2020-2030 ($Million)
Table 10.Financial Guarantee Market Revenue For Large Enterprises, By Region, 2020-2030 ($Million)
Table 11.Financial Guarantee Market Revenue, By End User, 2020–2030 ($Million)
Table 12.Financial Guarantee Market Revenue For Exporters, By Region, 2020-2030 ($Million)
Table 13.Financial Guarantee Market Revenue For Importers, By Region, 2020-2030 ($Million)
Table 14.Financial Guarantee Market, By Region, 2020-2030 ($Million)
Table 15.North America Financial Guarantee Market Revenue, By Product Type, 2020–2030 ($Million)
Table 16.North America Financial Guarantee Market Revenue, By Enterprise Size, 2020–2030 ($Million)
Table 17.North America Financial Guarantee Market Revenue, By End User, 2020–2030 ($Million)
Table 18.North America Financial Guarantee Market Revenue, By Country, 2020–2030 ($Million)
Table 19.U.S. Financial Guarantee Market Revenue, By Product Type, 2020–2030 ($Million)
Table 20.U.S. Financial Guarantee Market Revenue, By Enterprise Size, 2020–2030 ($Million)
Table 21.U.S. Financial Guarantee Market Revenue, By End User, 2020–2030 ($Million)
Table 22.Canada Financial Guarantee Market Revenue, By Product Type, 2020–2030 ($Million)
Table 23.Canada Financial Guarantee Market Revenue, By Enterprise Size, 2020–2030 ($Million)
Table 24.Canada Financial Guarantee Market Revenue, By End User, 2020–2030 ($Million)
Table 25.Mexico Financial Guarantee Market Revenue, By Product Type, 2020–2030 ($Million)
Table 26.Mexico Financial Guarantee Market Revenue, By Enterprise Size, 2020–2030 ($Million)
Table 27.Mexico Financial Guarantee Market Revenue, By End User, 2020–2030 ($Million)
Table 28.Europe Financial Guarantee Market Revenue, By Product Type, 2020–2030 ($Million)
Table 29.Europe Financial Guarantee Market Revenue, By Enterprise Size, 2020–2030 ($Million)
Table 30.Europe Financial Guarantee Market Revenue, By End User, 2020–2030 ($Million)
Table 31.Europe Financial Guarantee Market Revenue, By Country, 2020–2030 ($Million)
Table 32.Germany Financial Guarantee Market Revenue, By Product Type, 2020–2030 ($Million)
Table 33.Germany Financial Guarantee Market Revenue, By Enterprise Size, 2020–2030 ($Million)
Table 34.Germany Financial Guarantee Market Revenue, By End User, 2020–2030 ($Million)
Table 35.France Financial Guarantee Market Revenue, By Product Type, 2020–2030 ($Million)
Table 36.France Financial Guarantee Market Revenue, By Enterprise Size, 2020–2030 ($Million)
Table 37.France Financial Guarantee Market Revenue, By End User, 2020–2030 ($Million)
Table 38.Uk Financial Guarantee Market Revenue, By Product Type, 2020–2030 ($Million)
Table 39.Uk Financial Guarantee Market Revenue, By Enterprise Size, 2020–2030 ($Million)
Table 40.Uk Financial Guarantee Market Revenue, By End User, 2020–2030 ($Million)
Table 41.Italy Financial Guarantee Market Revenue, By Product Type, 2020–2030 ($Million)
Table 42.Italy Financial Guarantee Market Revenue, By Enterprise Size, 2020–2030 ($Million)
Table 43.Italy Financial Guarantee Market Revenue, By End User, 2020–2030 ($Million)
Table 44.Spain Financial Guarantee Market Revenue, By Product Type, 2020–2030 ($Million)
Table 45.Spain Financial Guarantee Market Revenue, By Enterprise Size, 2020–2030 ($Million)
Table 46.Spain Financial Guarantee Market Revenue, By End User, 2020–2030 ($Million)
Table 47.Russia Financial Guarantee Market Revenue, By Product Type, 2020–2030 ($Million)
Table 48.Russia Financial Guarantee Market Revenue, By Enterprise Size, 2020–2030 ($Million)
Table 49.Russia Financial Guarantee Market Revenue, By End User, 2020–2030 ($Million)
Table 50.Rest Of Europe Financial Guarantee Market Revenue, By Product Type, 2020–2030 ($Million)
Table 51.Rest Of Europe Financial Guarantee Market Revenue, By Enterprise Size, 2020–2030 ($Million)
Table 52.Rest Of Europe Financial Guarantee Market Revenue, By End User, 2020–2030 ($Million)
Table 53.Asia-Pacific Financial Guarantee Market Revenue, By Product Type, 2020–2030 ($Million)
Table 54.Asia-Pacific Financial Guarantee Market Revenue, By Enterprise Size, 2020–2030 ($Million)
Table 55.Asia-Pacific Financial Guarantee Market Revenue, By End User, 2020–2030 ($Million)
Table 56.Asia-Pacific Financial Guarantee Market Revenue, By Country, 2020–2030 ($Million)
Table 57.China Financial Guarantee Market Revenue, By Product Type, 2020–2030 ($Million)
Table 58.China Financial Guarantee Market Revenue, By Enterprise Size, 2020–2030 ($Million)
Table 59.China Financial Guarantee Market Revenue, By End User, 2020–2030 ($Million)
Table 60.Japan Financial Guarantee Market Revenue, By Product Type, 2020–2030 ($Million)
Table 61.Japan Financial Guarantee Market Revenue, By Enterprise Size, 2020–2030 ($Million)
Table 62.Japan Financial Guarantee Market Revenue, By End User, 2020–2030 ($Million)
Table 63.India Financial Guarantee Market Revenue, By Product Type, 2020–2030 ($Million)
Table 64.India Financial Guarantee Market Revenue, By Enterprise Size, 2020–2030 ($Million)
Table 65.India Financial Guarantee Market Revenue, By End User, 2020–2030 ($Million)
Table 66.Australia Financial Guarantee Market Revenue, By Product Type, 2020–2030 ($Million)
Table 67.Australia Financial Guarantee Market Revenue, By Enterprise Size, 2020–2030 ($Million)
Table 68.Australia Financial Guarantee Market Revenue, By End User, 2020–2030 ($Million)
Table 69.South Korea Financial Guarantee Market Revenue, By Product Type, 2020–2030 ($Million)
Table 70.South Korea Financial Guarantee Market Revenue, By Enterprise Size, 2020–2030 ($Million)
Table 71.South Korea Financial Guarantee Market Revenue, By End User, 2020–2030 ($Million)
Table 72.Rest Of Asia-Pacific Financial Guarantee Market Revenue, By Product Type, 2020–2030 ($Million)
Table 73.Rest Of Asia-Pacific Financial Guarantee Market Revenue, By Enterprise Size, 2020–2030 ($Million)
Table 74.Rest Of Asia-Pacific Financial Guarantee Market Revenue, By End User, 2020–2030 ($Million)
Table 75.Lamea Financial Guarantee Market Revenue, By Product Type, 2020–2030 ($Million)
Table 76.Lamea Financial Guarantee Market Revenue, By Enterprise Size, 2020–2030 ($Million)
Table 77.Lamea Financial Guarantee Market Revenue, By End User, 2020–2030 ($Million)
Table 78.Lamea Financial Guarantee Market Revenue, By Country, 2020–2030 ($Million)
Table 79.Brazil Financial Guarantee Market Revenue, By Product Type, 2020–2030 ($Million)
Table 80.Brazil Financial Guarantee Market Revenue, By Enterprise Size, 2020–2030 ($Million)
Table 81.Brazil Financial Guarantee Market Revenue, By End User, 2020–2030 ($Million)
Table 82.Turkey Financial Guarantee Market Revenue, By Product Type, 2020–2030 ($Million)
Table 83.Turkey Financial Guarantee Market Revenue, By Enterprise Size, 2020–2030 ($Million)
Table 84.Turkey Financial Guarantee Market Revenue, By End User, 2020–2030 ($Million)
Table 85.Saudi Arabia Financial Guarantee Market Revenue, By Product Type, 2020–2030 ($Million)
Table 86.Saudi Arabia Financial Guarantee Market Revenue, By Enterprise Size, 2020–2030 ($Million)
Table 87.Saudi Arabia Financial Guarantee Market Revenue, By End User, 2020–2030 ($Million)
Table 88.South Africa Financial Guarantee Market Revenue, By Product Type, 2020–2030 ($Million)
Table 89.South Africa Financial Guarantee Market Revenue, By Enterprise Size, 2020–2030 ($Million)
Table 90.South Africa Financial Guarantee Market Revenue, By End User, 2020–2030 ($Million)
Table 91.Rest Of Lamea Financial Guarantee Market Revenue, By Product Type, 2020–2030 ($Million)
Table 92.Rest Of Lamea Financial Guarantee Market Revenue, By Enterprise Size, 2020–2030 ($Million)
Table 93.Rest Of Lamea Financial Guarantee Market Revenue, By End User, 2020–2030 ($Million)
Table 94.Asian Development Bank: Company Snapshot
Table 95.Asian Development Bank: Product Portfolio
Table 96.Bnp Paribas: Company Snapshot
Table 97.Bnp Paribas: Product Portfolio
Table 98.Barclays Plc: Company Snapshot
Table 99.Barclays Plc: Operating Segments
Table 100.Barclays Plc: Product Portfolio
Table 101.Banque De Montreal (Bank Of Montreal): Company Snapshot
Table 102.Banque De Montreal (Bank Of Montreal): Product Portfolio
Table 103.Citigroup Inc.: Company Snapshot
Table 104.Citigroup Inc.: Product Portfolio
Table 105.Hsbc Holdings Plc: Company Snapshot
Table 106.Hsbc Holdings Plc: Product Portfolio
Table 107.Industrial And Commercial Bank Of China Limited (Icbc): Company Snapshot
Table 108.Industrial And Commercial Bank Of China Limited (Icbc): Product Portfolio
Table 109.Banque Nationale Du Canada (National Bank Of Canada): Company Snapshot
Table 110.Banque Nationale Du Canada (National Bank Of Canada)Fis: Operating Segments
Table 111.Banque Nationale Du Canada (National Bank Of Canada): Product Portfolio
Table 112.Scotiabank: Company Snapshot
Table 113.Scotiabank: Product Portfolio
Table 114.Scotiabank: Company Snapshot
Table 115.Scotiabank: Product Portfolio
Table 116.Sinosure: Company Snapshot
Table 117.Sinosure: Product Portfolio
List Of Figures
Figure 01.Key Market Segments
Figure 02.Financial Guarantee Market Snapshot, By Segmentation, 2021–2030
Figure 03.Financial Guarantee Market Snapshot, By Region, 2021–2030
Figure 04.Financial Guarantee Market: Top Impacting Factor
Figure 05.Top Investment Pockets
Figure 06.Moderate Bargaining Power Of Suppliers
Figure 07.Moderate-To-High Bargaining Power Of Buyers
Figure 08.Moderate Threat Of Substitutes
Figure 09.Moderate Threat Of New Entrants
Figure 10.High Competitive Rivalrys
Figure 11.Market Dynamics: Wealth Management Market
Figure 12.Financial Guarantee Market Revenue, By Product Type, 2020–2030 ($Million)
Figure 13.Comparative Country Analysis Of Financial Guarantee Market For Bank Guarantees, 2020 & 2030 (%)
Figure 14.Comparative Country Analysis Of Financial Guarantee Market For Documentary Letter Of Credit, 2020 & 2030 (%)
Figure 15.Comparative Country Analysis Of Financial Guarantee Market For Standby Letter Of Credit (Sblc), 2020 & 2030 (%)
Figure 16.Comparative Country Analysis Of Financial Guarantee Market For Receivables Financing, 2020 & 2030 (%)
Figure 17.Comparative Country Analysis Of Financial Guarantee Market For Others, 2020 & 2030 (%)
Figure 18.Financial Guarantee Market Revenue, By Enterprise Size, 2020–2030 ($Million)
Figure 19.Comparative Country Analysis Of Financial Guarantee Market For Small Enterprises, 2020 & 2030 (%)
Figure 20.Comparative Country Analysis Of Financial Guarantee Market For Medium-Sized Enterprises, 2020 & 2030 (%)
Figure 21.Comparative Country Analysis Of Financial Guarantee Market For Large Enterprises, 2020 & 2030 (%)
Figure 22.Financial Guarantee Market Revenue, By End User, 2020–2030 ($Million)
Figure 23.Comparative Country Analysis Of Financial Guarantee Market For Exporters, 2020 & 2030 (%)
Figure 24.Comparative Country Analysis Of Financial Guarantee Market For Importers, 2020 & 2030 (%)
Figure 25.U.S. Financial Guarantee Market Revenue, 2020-2030 ($Million)
Figure 26.Canada Financial Guarantee Market Revenue, 2020-2030 ($Million)
Figure 27.Mexico Financial Guarantee Market Revenue, 2020-2030 ($Million)
Figure 28.Germany Financial Guarantee Market Revenue, 2020-2030 ($Million)
Figure 29.France Financial Guarantee Market Revenue, 2020-2030 ($Million)
Figure 30.Uk Financial Guarantee Market Revenue, 2020-2030 ($Million)
Figure 31.Italy Financial Guarantee Market Revenue, 2020-2030 ($Million)
Figure 32.Spain Financial Guarantee Market Revenue, 2020-2030 ($Million)
Figure 33.Russia Financial Guarantee Market Revenue, 2020-2030 ($Million)
Figure 34.Rest Of Europe Financial Guarantee Market Revenue, 2020-2030 ($Million)
Figure 35.China Financial Guarantee Market Revenue, 2020-2030 ($Million)
Figure 36.Japan Financial Guarantee Market Revenue, 2020-2030 ($Million)
Figure 37.India Financial Guarantee Market Revenue, 2020-2030 ($Million)
Figure 38.Australia Financial Guarantee Market Revenue, 2020-2030 ($Million)
Figure 39.South Korea Financial Guarantee Market Revenue, 2020-2030 ($Million)
Figure 40.Rest Of Asia-Pacific Financial Guarantee Market Revenue, 2020-2030 ($Million)
Figure 41.Brazil Financial Guarantee Market Revenue, 2020-2030 ($Million)
Figure 42.Turkey Financial Guarantee Market Revenue, 2020-2030 ($Million)
Figure 43.Saudi Arabia Financial Guarantee Market Revenue, 2020-2030 ($Million)
Figure 44.South Africa Financial Guarantee Market Revenue, 2020-2030 ($Million)
Figure 45.Rest Of Lamea Financial Guarantee Market Revenue, 2020-2030 ($Million)
Figure 46.Market Player Positioning, 2020
Figure 47.Competitive Dashboard
Figure 48.Competitive Dashboard
Figure 49.Competitive Heatmap Of Key Players
Figure 50.Top Winning Strategies, By Year, 2019–2021
Figure 51.Top Winning Strategies, By Development, 2019–2021
Figure 52.Top Winning Strategies, By Company, 2019–2021
Figure 53.Asian Development Bank: Net Revenue, 2018–2020 ($Million)
Figure 54.Bnp Paribas: Revenue, 2018–2020 ($Million)
Figure 55.Barclays Plc: Net Revenue, 2018–2020 ($Million)
Figure 56.Barclays Plc: Revenue Share, By Segment, 2020 (%)
Figure 57.Barclays Plc: Revenue Share, By Region, 2020 (%)
Figure 58.Banque De Montreal (Bank Of Montreal): Net Sales, 2018–2020 ($Million)
Figure 59.Banque De Montreal (Bank Of Montreal): Revenue Share, By Segment, 2020 (%)
Figure 60.Banque De Montreal (Bank Of Montreal): Revenue Share, By Region, 2020 (%)
Figure 61.Citigroup Inc.: Net Sales, 2018–2020 ($Million)
Figure 62.Hsbc Holdings Plc: Revenue, 2018–2020 ($Million)
Figure 63.Hsbc Holdings Plc: Revenue Share, By Segment, 2020 (%)
Figure 64.Hsbc Holdings Plc: Revenue Share, By Region, 2020 (%)
Figure 65.Banque Nationale Du Canada (National Bank Of Canada): Net Sales, 2018–2020 ($Million)
Figure 66.Banque Nationale Du Canada (National Bank Of Canada): Revenue Share, By Segment, 2020 (%)
Figure 67.Banque Nationale Du Canada (National Bank Of Canada): Revenue Share, By Region, 2020 (%)
Figure 68.Scotiabank: Net Revenue, 2018–2020 ($Million)
Figure 69.Scotiabank: Revenue Share, By Segment, 2020 (%)
Figure 70.Scotiabank: Revenue Share, By Region, 2020 (%)
$6169
$10665
HAVE A QUERY?
OUR CUSTOMER

SIMILAR REPORTS
Add to Cart
Add to Cart
Add to Cart
Add to Cart