
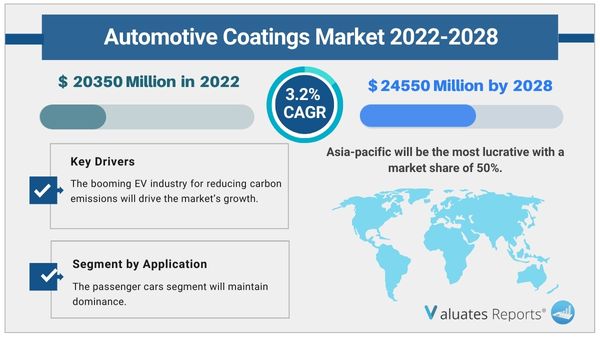
The global Automotive Coatings market size is estimated to be worth USD 20350 million in 2022. It is forecast to be a readjusted size of USD 24550 million by 2028 with a CAGR of 3.2% during the forecast period 2022-2028. The Automotive Coatings market will expand as a result of the rising demand for plastic coating products that are high-performing, low-maintenance, cost-effective, strict environmental laws, and preference for powder coatings. The market will develop during the forecast period due to the booming EV industry's desire to reduce carbon emissions.
Automotive coatings offer more durable and cost-effective solutions. They enhance the metallic colors of vehicles while also boosting sheen and visual appeal. The coatings create long-lasting surfaces, maximize effectiveness, and adhere to environmental standards. The market for automobile coatings will develop as a result in the upcoming years. They create a barrier that guards against UV rays, foreign objects, abrupt temperature fluctuations, and acid rain.
Strict regulations on the use of hazardous substances and labeling are being implemented by governments all over the world. In order to create fuel-efficient vehicles, manufacturers are proposing tailored body coating options. This will accelerate the expansion of the global market for automotive coatings. Losing weight is essential for reducing environmental risks and improving fuel economy. Composite materials like Carbon Fiber Reinforced Plastic (CFRP) are being used more frequently with aluminum or magnesium alloy. Coatings and structural adhesives work together to create a body that is both light and strong.
Volatile organic molecules are not released by powder coatings since they are solvent-free. To create automobiles that are fuel-efficient, engineers lighten cars and improve the rolling resistance of tires. In the upcoming years, this will accelerate the demand for automobile coatings. The procedure is done out so that less water, less energy, and less waste are used.
Automobile manufacturers are moving toward electric automobiles. For the technology in these cars to be protected, specific coatings are needed, as well as slick interiors with better-looking paintwork. The worldwide automotive coatings industry will expand as a result of the enormous preference for functional coatings. In order to be durable and effective, battery packs must be shielded from electromagnetic interference and kept at a constant internal temperature. The effective dielectric qualities of coatings eliminate the possibility of fire damage and avoid strain between metal components. It withstands corrosion and guards against ongoing deterioration of the sensors.
Based on type, with a 45% market share, the body coatings segment will have the fastest growth.
Based on application, throughout the anticipated period, the passenger car segment will continue to hold a dominant position in the automotive coatings market.
Based on region, with a market share of 50%, Asia-Pacific will be the most profitable region. This is a result of rising vehicle production and sales in nations like China, India, Japan, and Thailand. The availability of a huge workforce and inexpensive labor both contribute to the growth.
|
Report Metric |
Details |
|
Report Name |
Automotive Coating Market |
|
The market size in 2022 |
USD 20350 Million |
|
The revenue forecast in 2028 |
USD 24550 Million |
|
Growth Rate |
Compound Annual Growth Rate (CAGR) of 3.2% from 2022 to 2028 |
|
Market size available for years |
2022-2028 |
|
Forecast units |
Value (USD) |
|
Segments covered |
By Type, Application, and Region |
|
Report coverage |
Revenue & volume forecast, company share, competitive landscape, growth factors, and trends |
|
Geographic regions covered |
North America, Europe, Asia Pacific, Latin America, Middle East & Africa |
Ans. The global Automotive Coatings market size is estimated to be worth US$ 20350 million in 2022 and is forecast to a readjusted size of US$ 24550 million by 2028.
Ans. The global Automotive Coatings market is expected to grow at a compound annual growth rate of 3.2% from 2022 to 2028.
Ans. Some of the major companies are PPG Industries, BASF, Axalta and so on. Top five manufacturers have a share over 70% of the market.
Table of content:
1 Study Coverage
1.1 Automotive Coatings Product Introduction
1.2 Market by Type
1.2.1 Global Automotive Coatings Market Size by Type, 2017 VS 2021 VS 2028
1.2.2 Body Coatings
1.2.3 Interior Parts Coatings
1.2.4 Exterior Parts Coatings
1.2.5 Refinish Coatings
1.3 Market by Application
1.3.1 Global Automotive Coatings Market Size by Application, 2017 VS 2021 VS 2028
1.3.2 Passenger Car
1.3.3 Commercial Vehicle
1.4 Study Objectives
1.5 Years Considered
2 Global Automotive Coatings Production
2.1 Global Automotive Coatings Production Capacity (2017-2028)
2.2 Global Automotive Coatings Production by Region: 2017 VS 2021 VS 2028
2.3 Global Automotive Coatings Production by Region
2.3.1 Global Automotive Coatings Historic Production by Region (2017-2022)
2.3.2 Global Automotive Coatings Forecasted Production by Region (2023-2028)
2.4 North America
2.5 Europe
2.6 China
2.7 Japan
3 Global Automotive Coatings Sales in Volume & Value Estimates and Forecasts
3.1 Global Automotive Coatings Sales Estimates and Forecasts 2017-2028
3.2 Global Automotive Coatings Revenue Estimates and Forecasts 2017-2028
3.3 Global Automotive Coatings Revenue by Region: 2017 VS 2021 VS 2028
3.4 Global Automotive Coatings Sales by Region
3.4.1 Global Automotive Coatings Sales by Region (2017-2022)
3.4.2 Global Sales Automotive Coatings by Region (2023-2028)
3.5 Global Automotive Coatings Revenue by Region
3.5.1 Global Automotive Coatings Revenue by Region (2017-2022)
3.5.2 Global Automotive Coatings Revenue by Region (2023-2028)
3.6 North America
3.7 Europe
3.8 Asia-Pacific
3.9 Latin America
3.10 Middle East & Africa
4 Competition by Manufactures
4.1 Global Automotive Coatings Production Capacity by Manufacturers
4.2 Global Automotive Coatings Sales by Manufacturers
4.2.1 Global Automotive Coatings Sales by Manufacturers (2017-2022)
4.2.2 Global Automotive Coatings Sales Market Share by Manufacturers (2017-2022)
4.2.3 Global Top 10 and Top 5 Largest Manufacturers of Automotive Coatings in 2021
4.3 Global Automotive Coatings Revenue by Manufacturers
4.3.1 Global Automotive Coatings Revenue by Manufacturers (2017-2022)
4.3.2 Global Automotive Coatings Revenue Market Share by Manufacturers (2017-2022)
4.3.3 Global Top 10 and Top 5 Companies by Automotive Coatings Revenue in 2021
4.4 Global Automotive Coatings Sales Price by Manufacturers
4.5 Analysis of Competitive Landscape
4.5.1 Manufacturers Market Concentration Ratio (CR5 and HHI)
4.5.2 Global Automotive Coatings Market Share by Company Type (Tier 1, Tier 2, and Tier 3)
4.5.3 Global Automotive Coatings Manufacturers Geographical Distribution
4.6 Mergers & Acquisitions, Expansion Plans
5 Market Size by Type
5.1 Global Automotive Coatings Sales by Type
5.1.1 Global Automotive Coatings Historical Sales by Type (2017-2022)
5.1.2 Global Automotive Coatings Forecasted Sales by Type (2023-2028)
5.1.3 Global Automotive Coatings Sales Market Share by Type (2017-2028)
5.2 Global Automotive Coatings Revenue by Type
5.2.1 Global Automotive Coatings Historical Revenue by Type (2017-2022)
5.2.2 Global Automotive Coatings Forecasted Revenue by Type (2023-2028)
5.2.3 Global Automotive Coatings Revenue Market Share by Type (2017-2028)
5.3 Global Automotive Coatings Price by Type
5.3.1 Global Automotive Coatings Price by Type (2017-2022)
5.3.2 Global Automotive Coatings Price Forecast by Type (2023-2028)
6 Market Size by Application
6.1 Global Automotive Coatings Sales by Application
6.1.1 Global Automotive Coatings Historical Sales by Application (2017-2022)
6.1.2 Global Automotive Coatings Forecasted Sales by Application (2023-2028)
6.1.3 Global Automotive Coatings Sales Market Share by Application (2017-2028)
6.2 Global Automotive Coatings Revenue by Application
6.2.1 Global Automotive Coatings Historical Revenue by Application (2017-2022)
6.2.2 Global Automotive Coatings Forecasted Revenue by Application (2023-2028)
6.2.3 Global Automotive Coatings Revenue Market Share by Application (2017-2028)
6.3 Global Automotive Coatings Price by Application
6.3.1 Global Automotive Coatings Price by Application (2017-2022)
6.3.2 Global Automotive Coatings Price Forecast by Application (2023-2028)
7 North America
7.1 North America Automotive Coatings Market Size by Type
7.1.1 North America Automotive Coatings Sales by Type (2017-2028)
7.1.2 North America Automotive Coatings Revenue by Type (2017-2028)
7.2 North America Automotive Coatings Market Size by Application
7.2.1 North America Automotive Coatings Sales by Application (2017-2028)
7.2.2 North America Automotive Coatings Revenue by Application (2017-2028)
7.3 North America Automotive Coatings Sales by Country
7.3.1 North America Automotive Coatings Sales by Country (2017-2028)
7.3.2 North America Automotive Coatings Revenue by Country (2017-2028)
7.3.3 United States
7.3.4 Canada
8 Europe
8.1 Europe Automotive Coatings Market Size by Type
8.1.1 Europe Automotive Coatings Sales by Type (2017-2028)
8.1.2 Europe Automotive Coatings Revenue by Type (2017-2028)
8.2 Europe Automotive Coatings Market Size by Application
8.2.1 Europe Automotive Coatings Sales by Application (2017-2028)
8.2.2 Europe Automotive Coatings Revenue by Application (2017-2028)
8.3 Europe Automotive Coatings Sales by Country
8.3.1 Europe Automotive Coatings Sales by Country (2017-2028)
8.3.2 Europe Automotive Coatings Revenue by Country (2017-2028)
8.3.3 Germany
8.3.4 France
8.3.5 U.K.
8.3.6 Italy
8.3.7 Russia
9 Asia Pacific
9.1 Asia Pacific Automotive Coatings Market Size by Type
9.1.1 Asia Pacific Automotive Coatings Sales by Type (2017-2028)
9.1.2 Asia Pacific Automotive Coatings Revenue by Type (2017-2028)
9.2 Asia Pacific Automotive Coatings Market Size by Application
9.2.1 Asia Pacific Automotive Coatings Sales by Application (2017-2028)
9.2.2 Asia Pacific Automotive Coatings Revenue by Application (2017-2028)
9.3 Asia Pacific Automotive Coatings Sales by Region
9.3.1 Asia Pacific Automotive Coatings Sales by Region (2017-2028)
9.3.2 Asia Pacific Automotive Coatings Revenue by Region (2017-2028)
9.3.3 China
9.3.4 Japan
9.3.5 South Korea
9.3.6 India
9.3.7 Australia
9.3.8 China Taiwan
9.3.9 Indonesia
9.3.10 Thailand
9.3.11 Malaysia
10 Latin America
10.1 Latin America Automotive Coatings Market Size by Type
10.1.1 Latin America Automotive Coatings Sales by Type (2017-2028)
10.1.2 Latin America Automotive Coatings Revenue by Type (2017-2028)
10.2 Latin America Automotive Coatings Market Size by Application
10.2.1 Latin America Automotive Coatings Sales by Application (2017-2028)
10.2.2 Latin America Automotive Coatings Revenue by Application (2017-2028)
10.3 Latin America Automotive Coatings Sales by Country
10.3.1 Latin America Automotive Coatings Sales by Country (2017-2028)
10.3.2 Latin America Automotive Coatings Revenue by Country (2017-2028)
10.3.3 Mexico
10.3.4 Brazil
10.3.5 Argentina
11 Middle East and Africa
11.1 Middle East and Africa Automotive Coatings Market Size by Type
11.1.1 Middle East and Africa Automotive Coatings Sales by Type (2017-2028)
11.1.2 Middle East and Africa Automotive Coatings Revenue by Type (2017-2028)
11.2 Middle East and Africa Automotive Coatings Market Size by Application
11.2.1 Middle East and Africa Automotive Coatings Sales by Application (2017-2028)
11.2.2 Middle East and Africa Automotive Coatings Revenue by Application (2017-2028)
11.3 Middle East and Africa Automotive Coatings Sales by Country
11.3.1 Middle East and Africa Automotive Coatings Sales by Country (2017-2028)
11.3.2 Middle East and Africa Automotive Coatings Revenue by Country (2017-2028)
11.3.3 Turkey
11.3.4 Saudi Arabia
11.3.5 UAE
12 Corporate Profiles
12.1 PPG Industries
12.1.1 PPG Industries Corporation Information
12.1.2 PPG Industries Overview
12.1.3 PPG Industries Automotive Coatings Sales, Price, Revenue and Gross Margin (2017-2022)
12.1.4 PPG Industries Automotive Coatings Product Model Numbers, Pictures, Descriptions and Specifications
12.1.5 PPG Industries Recent Developments
12.2 BASF
12.2.1 BASF Corporation Information
12.2.2 BASF Overview
12.2.3 BASF Automotive Coatings Sales, Price, Revenue and Gross Margin (2017-2022)
12.2.4 BASF Automotive Coatings Product Model Numbers, Pictures, Descriptions and Specifications
12.2.5 BASF Recent Developments
12.3 Axalta
12.3.1 Axalta Corporation Information
12.3.2 Axalta Overview
12.3.3 Axalta Automotive Coatings Sales, Price, Revenue and Gross Margin (2017-2022)
12.3.4 Axalta Automotive Coatings Product Model Numbers, Pictures, Descriptions and Specifications
12.3.5 Axalta Recent Developments
12.4 Nippon Paint
12.4.1 Nippon Paint Corporation Information
12.4.2 Nippon Paint Overview
12.4.3 Nippon Paint Automotive Coatings Sales, Price, Revenue and Gross Margin (2017-2022)
12.4.4 Nippon Paint Automotive Coatings Product Model Numbers, Pictures, Descriptions and Specifications
12.4.5 Nippon Paint Recent Developments
12.5 AkzoNobel
12.5.1 AkzoNobel Corporation Information
12.5.2 AkzoNobel Overview
12.5.3 AkzoNobel Automotive Coatings Sales, Price, Revenue and Gross Margin (2017-2022)
12.5.4 AkzoNobel Automotive Coatings Product Model Numbers, Pictures, Descriptions and Specifications
12.5.5 AkzoNobel Recent Developments
12.6 Sherwin Williams
12.6.1 Sherwin Williams Corporation Information
12.6.2 Sherwin Williams Overview
12.6.3 Sherwin Williams Automotive Coatings Sales, Price, Revenue and Gross Margin (2017-2022)
12.6.4 Sherwin Williams Automotive Coatings Product Model Numbers, Pictures, Descriptions and Specifications
12.6.5 Sherwin Williams Recent Developments
12.7 Kansai Paint
12.7.1 Kansai Paint Corporation Information
12.7.2 Kansai Paint Overview
12.7.3 Kansai Paint Automotive Coatings Sales, Price, Revenue and Gross Margin (2017-2022)
12.7.4 Kansai Paint Automotive Coatings Product Model Numbers, Pictures, Descriptions and Specifications
12.7.5 Kansai Paint Recent Developments
12.8 KCC Corporation
12.8.1 KCC Corporation Corporation Information
12.8.2 KCC Corporation Overview
12.8.3 KCC Corporation Automotive Coatings Sales, Price, Revenue and Gross Margin (2017-2022)
12.8.4 KCC Corporation Automotive Coatings Product Model Numbers, Pictures, Descriptions and Specifications
12.8.5 KCC Corporation Recent Developments
12.9 Xiangjiang Kansai Paint
12.9.1 Xiangjiang Kansai Paint Corporation Information
12.9.2 Xiangjiang Kansai Paint Overview
12.9.3 Xiangjiang Kansai Paint Automotive Coatings Sales, Price, Revenue and Gross Margin (2017-2022)
12.9.4 Xiangjiang Kansai Paint Automotive Coatings Product Model Numbers, Pictures, Descriptions and Specifications
12.9.5 Xiangjiang Kansai Paint Recent Developments
12.10 YATU
12.10.1 YATU Corporation Information
12.10.2 YATU Overview
12.10.3 YATU Automotive Coatings Sales, Price, Revenue and Gross Margin (2017-2022)
12.10.4 YATU Automotive Coatings Product Model Numbers, Pictures, Descriptions and Specifications
12.10.5 YATU Recent Developments
12.11 Kinlita
12.11.1 Kinlita Corporation Information
12.11.2 Kinlita Overview
12.11.3 Kinlita Automotive Coatings Sales, Price, Revenue and Gross Margin (2017-2022)
12.11.4 Kinlita Automotive Coatings Product Model Numbers, Pictures, Descriptions and Specifications
12.11.5 Kinlita Recent Developments
12.12 Peter Lacke
12.12.1 Peter Lacke Corporation Information
12.12.2 Peter Lacke Overview
12.12.3 Peter Lacke Automotive Coatings Sales, Price, Revenue and Gross Margin (2017-2022)
12.12.4 Peter Lacke Automotive Coatings Product Model Numbers, Pictures, Descriptions and Specifications
12.12.5 Peter Lacke Recent Developments
12.13 Donglai
12.13.1 Donglai Corporation Information
12.13.2 Donglai Overview
12.13.3 Donglai Automotive Coatings Sales, Price, Revenue and Gross Margin (2017-2022)
12.13.4 Donglai Automotive Coatings Product Model Numbers, Pictures, Descriptions and Specifications
12.13.5 Donglai Recent Developments
13 Industry Chain and Sales Channels Analysis
13.1 Automotive Coatings Industry Chain Analysis
13.2 Automotive Coatings Key Raw Materials
13.2.1 Key Raw Materials
13.2.2 Raw Materials Key Suppliers
13.3 Automotive Coatings Production Mode & Process
13.4 Automotive Coatings Sales and Marketing
13.4.1 Automotive Coatings Sales Channels
13.4.2 Automotive Coatings Distributors
13.5 Automotive Coatings Customers
14 Market Drivers, Opportunities, Challenges and Risks Factors Analysis
14.1 Automotive Coatings Industry Trends
14.2 Automotive Coatings Market Drivers
14.3 Automotive Coatings Market Challenges
14.4 Automotive Coatings Market Restraints
15 Key Finding in The Global Automotive Coatings Study
16 Appendix
16.1 Research Methodology
16.1.1 Methodology/Research Approach
16.1.2 Data Source
16.2 Author Details
16.3 Disclaimer
Table of Figures:
List of Tables
Table 1. Global Automotive Coatings Market Size Growth Rate by Type, 2017 VS 2021 VS 2028 (US$ Million)
Table 2. Major Manufacturers of Body Coatings
Table 3. Major Manufacturers of Interior Parts Coatings
Table 4. Major Manufacturers of Exterior Parts Coatings
Table 5. Major Manufacturers of Refinish Coatings
Table 6. Global Automotive Coatings Market Size Growth Rate by Application, 2017 VS 2021 2028 (US$ Million)
Table 7. Global Automotive Coatings Production by Region: 2017 VS 2021 VS 2028 (K MT)
Table 8. Global Automotive Coatings Production by Region (2017-2022) & (K MT)
Table 9. Global Automotive Coatings Production Market Share by Region (2017-2022)
Table 10. Global Automotive Coatings Production by Region (2023-2028) & (K MT)
Table 11. Global Automotive Coatings Production Market Share by Region (2023-2028)
Table 12. Global Automotive Coatings Revenue by Region: 2017 VS 2021 VS 2028 (US$ Million)
Table 13. Global Automotive Coatings Sales by Region (2017-2022) & (K MT)
Table 14. Global Automotive Coatings Sales Market Share by Region (2017-2022)
Table 15. Global Automotive Coatings Sales by Region (2023-2028) & (K MT)
Table 16. Global Automotive Coatings Sales Market Share by Region (2023-2028)
Table 17. Global Automotive Coatings Revenue by Region (2017-2022) & (US$ Million)
Table 18. Global Automotive Coatings Revenue Market Share by Region (2017-2022)
Table 19. Global Automotive Coatings Revenue by Region (2023-2028) & (US$ Million)
Table 20. Global Automotive Coatings Revenue Market Share by Region (2023-2028)
Table 21. Global Automotive Coatings Production Capacity by Manufacturers (2017-2022) & (K MT)
Table 22. Global Automotive Coatings Capacity Market Share by Manufacturers (2017-2022)
Table 23. Global Automotive Coatings Sales by Manufacturers (2017-2022) & (K MT)
Table 24. Global Automotive Coatings Sales Market Share by Manufacturers (2017-2022)
Table 25. Global Automotive Coatings Revenue by Manufacturers (2017-2022) & (US$ Million)
Table 26. Global Automotive Coatings Revenue Share by Manufacturers (2017-2022)
Table 27. Automotive Coatings Price by Manufacturers 2017-2022 (USD/MT)
Table 28. Global Automotive Coatings Manufacturers Market Concentration Ratio (CR5 and HHI)
Table 29. Global Automotive Coatings by Company Type (Tier 1, Tier 2, and Tier 3) & (based on the Revenue in Automotive Coatings as of 2021)
Table 30. Automotive Coatings Manufacturing Base Distribution and Headquarters
Table 31. Manufacturers Automotive Coatings Product Offered
Table 32. Date of Manufacturers Enter into Automotive Coatings Market
Table 33. Mergers & Acquisitions, Expansion Plans
Table 34. Global Automotive Coatings Sales by Type (2017-2022) & (K MT)
Table 35. Global Automotive Coatings Sales by Type (2023-2028) & (K MT)
Table 36. Global Automotive Coatings Sales Share by Type (2017-2022)
Table 37. Global Automotive Coatings Sales Share by Type (2023-2028)
Table 38. Global Automotive Coatings Revenue by Type (2017-2022) & (US$ Million)
Table 39. Global Automotive Coatings Revenue by Type (2023-2028) & (US$ Million)
Table 40. Global Automotive Coatings Revenue Share by Type (2017-2022)
Table 41. Global Automotive Coatings Revenue Share by Type (2023-2028)
Table 42. Automotive Coatings Price by Type (2017-2022) & (USD/MT)
Table 43. Global Automotive Coatings Price Forecast by Type (2023-2028) & (USD/MT)
Table 44. Global Automotive Coatings Sales by Application (2017-2022) & (K MT)
Table 45. Global Automotive Coatings Sales by Application (2023-2028) & (K MT)
Table 46. Global Automotive Coatings Sales Share by Application (2017-2022)
Table 47. Global Automotive Coatings Sales Share by Application (2023-2028)
Table 48. Global Automotive Coatings Revenue by Application (2017-2022) & (US$ Million)
Table 49. Global Automotive Coatings Revenue by Application (2023-2028) & (US$ Million)
Table 50. Global Automotive Coatings Revenue Share by Application (2017-2022)
Table 51. Global Automotive Coatings Revenue Share by Application (2023-2028)
Table 52. Automotive Coatings Price by Application (2017-2022) & (USD/MT)
Table 53. Global Automotive Coatings Price Forecast by Application (2023-2028) & (USD/MT)
Table 54. North America Automotive Coatings Sales by Type (2017-2022) & (K MT)
Table 55. North America Automotive Coatings Sales by Type (2023-2028) & (K MT)
Table 56. North America Automotive Coatings Revenue by Type (2017-2022) & (US$ Million)
Table 57. North America Automotive Coatings Revenue by Type (2023-2028) & (US$ Million)
Table 58. North America Automotive Coatings Sales by Application (2017-2022) & (K MT)
Table 59. North America Automotive Coatings Sales by Application (2023-2028) & (K MT)
Table 60. North America Automotive Coatings Revenue by Application (2017-2022) & (US$ Million)
Table 61. North America Automotive Coatings Revenue by Application (2023-2028) & (US$ Million)
Table 62. North America Automotive Coatings Sales by Country (2017-2022) & (K MT)
Table 63. North America Automotive Coatings Sales by Country (2023-2028) & (K MT)
Table 64. North America Automotive Coatings Revenue by Country (2017-2022) & (US$ Million)
Table 65. North America Automotive Coatings Revenue by Country (2023-2028) & (US$ Million)
Table 66. Europe Automotive Coatings Sales by Type (2017-2022) & (K MT)
Table 67. Europe Automotive Coatings Sales by Type (2023-2028) & (K MT)
Table 68. Europe Automotive Coatings Revenue by Type (2017-2022) & (US$ Million)
Table 69. Europe Automotive Coatings Revenue by Type (2023-2028) & (US$ Million)
Table 70. Europe Automotive Coatings Sales by Application (2017-2022) & (K MT)
Table 71. Europe Automotive Coatings Sales by Application (2023-2028) & (K MT)
Table 72. Europe Automotive Coatings Revenue by Application (2017-2022) & (US$ Million)
Table 73. Europe Automotive Coatings Revenue by Application (2023-2028) & (US$ Million)
Table 74. Europe Automotive Coatings Sales by Country (2017-2022) & (K MT)
Table 75. Europe Automotive Coatings Sales by Country (2023-2028) & (K MT)
Table 76. Europe Automotive Coatings Revenue by Country (2017-2022) & (US$ Million)
Table 77. Europe Automotive Coatings Revenue by Country (2023-2028) & (US$ Million)
Table 78. Asia Pacific Automotive Coatings Sales by Type (2017-2022) & (K MT)
Table 79. Asia Pacific Automotive Coatings Sales by Type (2023-2028) & (K MT)
Table 80. Asia Pacific Automotive Coatings Revenue by Type (2017-2022) & (US$ Million)
Table 81. Asia Pacific Automotive Coatings Revenue by Type (2023-2028) & (US$ Million)
Table 82. Asia Pacific Automotive Coatings Sales by Application (2017-2022) & (K MT)
Table 83. Asia Pacific Automotive Coatings Sales by Application (2023-2028) & (K MT)
Table 84. Asia Pacific Automotive Coatings Revenue by Application (2017-2022) & (US$ Million)
Table 85. Asia Pacific Automotive Coatings Revenue by Application (2023-2028) & (US$ Million)
Table 86. Asia Pacific Automotive Coatings Sales by Region (2017-2022) & (K MT)
Table 87. Asia Pacific Automotive Coatings Sales by Region (2023-2028) & (K MT)
Table 88. Asia Pacific Automotive Coatings Revenue by Region (2017-2022) & (US$ Million)
Table 89. Asia Pacific Automotive Coatings Revenue by Region (2023-2028) & (US$ Million)
Table 90. Latin America Automotive Coatings Sales by Type (2017-2022) & (K MT)
Table 91. Latin America Automotive Coatings Sales by Type (2023-2028) & (K MT)
Table 92. Latin America Automotive Coatings Revenue by Type (2017-2022) & (US$ Million)
Table 93. Latin America Automotive Coatings Revenue by Type (2023-2028) & (US$ Million)
Table 94. Latin America Automotive Coatings Sales by Application (2017-2022) & (K MT)
Table 95. Latin America Automotive Coatings Sales by Application (2023-2028) & (K MT)
Table 96. Latin America Automotive Coatings Revenue by Application (2017-2022) & (US$ Million)
Table 97. Latin America Automotive Coatings Revenue by Application (2023-2028) & (US$ Million)
Table 98. Latin America Automotive Coatings Sales by Country (2017-2022) & (K MT)
Table 99. Latin America Automotive Coatings Sales by Country (2023-2028) & (K MT)
Table 100. Latin America Automotive Coatings Revenue by Country (2017-2022) & (US$ Million)
Table 101. Latin America Automotive Coatings Revenue by Country (2023-2028) & (US$ Million)
Table 102. Middle East and Africa Automotive Coatings Sales by Type (2017-2022) & (K MT)
Table 103. Middle East and Africa Automotive Coatings Sales by Type (2023-2028) & (K MT)
Table 104. Middle East and Africa Automotive Coatings Revenue by Type (2017-2022) & (US$ Million)
Table 105. Middle East and Africa Automotive Coatings Revenue by Type (2023-2028) & (US$ Million)
Table 106. Middle East and Africa Automotive Coatings Sales by Application (2017-2022) & (K MT)
Table 107. Middle East and Africa Automotive Coatings Sales by Application (2023-2028) & (K MT)
Table 108. Middle East and Africa Automotive Coatings Revenue by Application (2017-2022) & (US$ Million)
Table 109. Middle East and Africa Automotive Coatings Revenue by Application (2023-2028) & (US$ Million)
Table 110. Middle East and Africa Automotive Coatings Sales by Country (2017-2022) & (K MT)
Table 111. Middle East and Africa Automotive Coatings Sales by Country (2023-2028) & (K MT)
Table 112. Middle East and Africa Automotive Coatings Revenue by Country (2017-2022) & (US$ Million)
Table 113. Middle East and Africa Automotive Coatings Revenue by Country (2023-2028) & (US$ Million)
Table 114. PPG Industries Corporation Information
Table 115. PPG Industries Description and Major Businesses
Table 116. PPG Industries Automotive Coatings Sales (K MT), Revenue (US$ Million), Price (USD/MT) and Gross Margin (2017-2022)
Table 117. PPG Industries Automotive Coatings Product Model Numbers, Pictures, Descriptions and Specifications
Table 118. PPG Industries Recent Development
Table 119. BASF Corporation Information
Table 120. BASF Description and Major Businesses
Table 121. BASF Automotive Coatings Sales (K MT), Revenue (US$ Million), Price (USD/MT) and Gross Margin (2017-2022)
Table 122. BASF Automotive Coatings Product Model Numbers, Pictures, Descriptions and Specifications
Table 123. BASF Recent Development
Table 124. Axalta Corporation Information
Table 125. Axalta Description and Major Businesses
Table 126. Axalta Automotive Coatings Sales (K MT), Revenue (US$ Million), Price (USD/MT) and Gross Margin (2017-2022)
Table 127. Axalta Automotive Coatings Product Model Numbers, Pictures, Descriptions and Specifications
Table 128. Axalta Recent Development
Table 129. Nippon Paint Corporation Information
Table 130. Nippon Paint Description and Major Businesses
Table 131. Nippon Paint Automotive Coatings Sales (K MT), Revenue (US$ Million), Price (USD/MT) and Gross Margin (2017-2022)
Table 132. Nippon Paint Automotive Coatings Product Model Numbers, Pictures, Descriptions and Specifications
Table 133. Nippon Paint Recent Development
Table 134. AkzoNobel Corporation Information
Table 135. AkzoNobel Description and Major Businesses
Table 136. AkzoNobel Automotive Coatings Sales (K MT), Revenue (US$ Million), Price (USD/MT) and Gross Margin (2017-2022)
Table 137. AkzoNobel Automotive Coatings Product Model Numbers, Pictures, Descriptions and Specifications
Table 138. AkzoNobel Recent Development
Table 139. Sherwin Williams Corporation Information
Table 140. Sherwin Williams Description and Major Businesses
Table 141. Sherwin Williams Automotive Coatings Sales (K MT), Revenue (US$ Million), Price (USD/MT) and Gross Margin (2017-2022)
Table 142. Sherwin Williams Automotive Coatings Product Model Numbers, Pictures, Descriptions and Specifications
Table 143. Sherwin Williams Recent Development
Table 144. Kansai Paint Corporation Information
Table 145. Kansai Paint Description and Major Businesses
Table 146. Kansai Paint Automotive Coatings Sales (K MT), Revenue (US$ Million), Price (USD/MT) and Gross Margin (2017-2022)
Table 147. Kansai Paint Automotive Coatings Product Model Numbers, Pictures, Descriptions and Specifications
Table 148. Kansai Paint Recent Development
Table 149. KCC Corporation Corporation Information
Table 150. KCC Corporation Description and Major Businesses
Table 151. KCC Corporation Automotive Coatings Sales (K MT), Revenue (US$ Million), Price (USD/MT) and Gross Margin (2017-2022)
Table 152. KCC Corporation Automotive Coatings Product Model Numbers, Pictures, Descriptions and Specifications
Table 153. KCC Corporation Recent Development
Table 154. Xiangjiang Kansai Paint Corporation Information
Table 155. Xiangjiang Kansai Paint Description and Major Businesses
Table 156. Xiangjiang Kansai Paint Automotive Coatings Sales (K MT), Revenue (US$ Million), Price (USD/MT) and Gross Margin (2017-2022)
Table 157. Xiangjiang Kansai Paint Automotive Coatings Product Model Numbers, Pictures, Descriptions and Specifications
Table 158. Xiangjiang Kansai Paint Recent Development
Table 159. YATU Corporation Information
Table 160. YATU Description and Major Businesses
Table 161. YATU Automotive Coatings Sales (K MT), Revenue (US$ Million), Price (USD/MT) and Gross Margin (2017-2022)
Table 162. YATU Automotive Coatings Product Model Numbers, Pictures, Descriptions and Specifications
Table 163. YATU Recent Development
Table 164. Kinlita Corporation Information
Table 165. Kinlita Description and Major Businesses
Table 166. Kinlita Automotive Coatings Sales (K MT), Revenue (US$ Million), Price (USD/MT) and Gross Margin (2017-2022)
Table 167. Kinlita Automotive Coatings Product Model Numbers, Pictures, Descriptions and Specifications
Table 168. Kinlita Recent Development
Table 169. Peter Lacke Corporation Information
Table 170. Peter Lacke Description and Major Businesses
Table 171. Peter Lacke Automotive Coatings Sales (K MT), Revenue (US$ Million), Price (USD/MT) and Gross Margin (2017-2022)
Table 172. Peter Lacke Automotive Coatings Product Model Numbers, Pictures, Descriptions and Specifications
Table 173. Peter Lacke Recent Development
Table 174. Donglai Corporation Information
Table 175. Donglai Description and Major Businesses
Table 176. Donglai Automotive Coatings Sales (K MT), Revenue (US$ Million), Price (USD/MT) and Gross Margin (2017-2022)
Table 177. Donglai Automotive Coatings Product Model Numbers, Pictures, Descriptions and Specifications
Table 178. Donglai Recent Development
Table 179. Key Raw Materials Lists
Table 180. Raw Materials Key Suppliers Lists
Table 181. Automotive Coatings Distributors List
Table 182. Automotive Coatings Customers List
Table 183. Automotive Coatings Market Trends
Table 184. Automotive Coatings Market Drivers
Table 185. Automotive Coatings Market Challenges
Table 186. Automotive Coatings Market Restraints
Table 187. Research Programs/Design for This Report
Table 188. Key Data Information from Secondary Sources
Table 189. Key Data Information from Primary Sources
List of Figures
Figure 1. Automotive Coatings Product Picture
Figure 2. Global Automotive Coatings Market Share by Type in 2021 & 2028
Figure 3. Body Coatings Product Picture
Figure 4. Interior Parts Coatings Product Picture
Figure 5. Exterior Parts Coatings Product Picture
Figure 6. Refinish Coatings Product Picture
Figure 7. Global Automotive Coatings Market Share by Application in 2021 & 2028
Figure 8. Passenger Car
Figure 9. Commercial Vehicle
Figure 10. Automotive Coatings Report Years Considered
Figure 11. Global Automotive Coatings Capacity, Production and Utilization (2017-2028) & (K MT)
Figure 12. Global Automotive Coatings Production Market Share by Region in Percentage: 2021 Versus 2028
Figure 13. Global Automotive Coatings Production Market Share by Region (2017-2022)
Figure 14. Global Automotive Coatings Production Market Share by Region (2023-2028)
Figure 15. Automotive Coatings Production Growth Rate in North America (2017-2028) & (K MT)
Figure 16. Automotive Coatings Production Growth Rate in Europe (2017-2028) & (K MT)
Figure 17. Automotive Coatings Production Growth Rate in China (2017-2028) & (K MT)
Figure 18. Automotive Coatings Production Growth Rate in Japan (2017-2028) & (K MT)
Figure 19. Global Automotive Coatings Sales 2017-2028 (K MT)
Figure 20. Global Automotive Coatings Revenue, (US$ Million), 2017 VS 2021 VS 2028
Figure 21. Global Automotive Coatings Revenue 2017-2028 (US$ Million)
Figure 22. Global Automotive Coatings Revenue Market Share by Region in Percentage: 2021 Versus 2028
Figure 23. Global Automotive Coatings Sales Market Share by Region (2017-2022)
Figure 24. Global Automotive Coatings Sales Market Share by Region (2023-2028)
Figure 25. North America Automotive Coatings Sales YoY (2017-2028) & (K MT)
Figure 26. North America Automotive Coatings Revenue YoY (2017-2028) & (US$ Million)
Figure 27. Europe Automotive Coatings Sales YoY (2017-2028) & (K MT)
Figure 28. Europe Automotive Coatings Revenue YoY (2017-2028) & (US$ Million)
Figure 29. Asia-Pacific Automotive Coatings Sales YoY (2017-2028) & (K MT)
Figure 30. Asia-Pacific Automotive Coatings Revenue YoY (2017-2028) & (US$ Million)
Figure 31. Latin America Automotive Coatings Sales YoY (2017-2028) & (K MT)
Figure 32. Latin America Automotive Coatings Revenue YoY (2017-2028) & (US$ Million)
Figure 33. Middle East & Africa Automotive Coatings Sales YoY (2017-2028) & (K MT)
Figure 34. Middle East & Africa Automotive Coatings Revenue YoY (2017-2028) & (US$ Million)
Figure 35. The Automotive Coatings Market Share of Top 10 and Top 5 Largest Manufacturers Around the World in 2021
Figure 36. The Top 5 and 10 Largest Manufacturers of Automotive Coatings in the World: Market Share by Automotive Coatings Revenue in 2021
Figure 37. Automotive Coatings Market Share by Company Type (Tier 1, Tier 2, and Tier 3): 2017 VS 2021
Figure 38. Global Automotive Coatings Sales Market Share by Type (2017-2028)
Figure 39. Global Automotive Coatings Revenue Market Share by Type (2017-2028)
Figure 40. Global Automotive Coatings Sales Market Share by Application (2017-2028)
Figure 41. Global Automotive Coatings Revenue Market Share by Application (2017-2028)
Figure 42. North America Automotive Coatings Sales Market Share by Type (2017-2028)
Figure 43. North America Automotive Coatings Revenue Market Share by Type (2017-2028)
Figure 44. North America Automotive Coatings Sales Market Share by Application (2017-2028)
Figure 45. North America Automotive Coatings Revenue Market Share by Application (2017-2028)
Figure 46. North America Automotive Coatings Sales Share by Country (2017-2028)
Figure 47. North America Automotive Coatings Revenue Share by Country (2017-2028)
Figure 48. United States Automotive Coatings Revenue (2017-2028) & (US$ Million)
Figure 49. Canada Automotive Coatings Revenue (2017-2028) & (US$ Million)
Figure 50. Europe Automotive Coatings Sales Market Share by Type (2017-2028)
Figure 51. Europe Automotive Coatings Revenue Market Share by Type (2017-2028)
Figure 52. Europe Automotive Coatings Sales Market Share by Application (2017-2028)
Figure 53. Europe Automotive Coatings Revenue Market Share by Application (2017-2028)
Figure 54. Europe Automotive Coatings Sales Share by Country (2017-2028)
Figure 55. Europe Automotive Coatings Revenue Share by Country (2017-2028)
Figure 56. Germany Automotive Coatings Revenue (2017-2028) & (US$ Million)
Figure 57. France Automotive Coatings Revenue (2017-2028) & (US$ Million)
Figure 58. U.K. Automotive Coatings Revenue (2017-2028) & (US$ Million)
Figure 59. Italy Automotive Coatings Revenue (2017-2028) & (US$ Million)
Figure 60. Russia Automotive Coatings Revenue (2017-2028) & (US$ Million)
Figure 61. Asia Pacific Automotive Coatings Sales Market Share by Type (2017-2028)
Figure 62. Asia Pacific Automotive Coatings Revenue Market Share by Type (2017-2028)
Figure 63. Asia Pacific Automotive Coatings Sales Market Share by Application (2017-2028)
Figure 64. Asia Pacific Automotive Coatings Revenue Market Share by Application (2017-2028)
Figure 65. Asia Pacific Automotive Coatings Sales Share by Region (2017-2028)
Figure 66. Asia Pacific Automotive Coatings Revenue Share by Region (2017-2028)
Figure 67. China Automotive Coatings Revenue (2017-2028) & (US$ Million)
Figure 68. Japan Automotive Coatings Revenue (2017-2028) & (US$ Million)
Figure 69. South Korea Automotive Coatings Revenue (2017-2028) & (US$ Million)
Figure 70. India Automotive Coatings Revenue (2017-2028) & (US$ Million)
Figure 71. Australia Automotive Coatings Revenue (2017-2028) & (US$ Million)
Figure 72. China Taiwan Automotive Coatings Revenue (2017-2028) & (US$ Million)
Figure 73. Indonesia Automotive Coatings Revenue (2017-2028) & (US$ Million)
Figure 74. Thailand Automotive Coatings Revenue (2017-2028) & (US$ Million)
Figure 75. Malaysia Automotive Coatings Revenue (2017-2028) & (US$ Million)
Figure 76. Latin America Automotive Coatings Sales Market Share by Type (2017-2028)
Figure 77. Latin America Automotive Coatings Revenue Market Share by Type (2017-2028)
Figure 78. Latin America Automotive Coatings Sales Market Share by Application (2017-2028)
Figure 79. Latin America Automotive Coatings Revenue Market Share by Application (2017-2028)
Figure 80. Latin America Automotive Coatings Sales Share by Country (2017-2028)
Figure 81. Latin America Automotive Coatings Revenue Share by Country (2017-2028)
Figure 82. Mexico Automotive Coatings Revenue (2017-2028) & (US$ Million)
Figure 83. Brazil Automotive Coatings Revenue (2017-2028) & (US$ Million)
Figure 84. Argentina Automotive Coatings Revenue (2017-2028) & (US$ Million)
Figure 85. Middle East and Africa Automotive Coatings Sales Market Share by Type (2017-2028)
Figure 86. Middle East and Africa Automotive Coatings Revenue Market Share by Type (2017-2028)
Figure 87. Middle East and Africa Automotive Coatings Sales Market Share by Application (2017-2028)
Figure 88. Middle East and Africa Automotive Coatings Revenue Market Share by Application (2017-2028)
Figure 89. Middle East and Africa Automotive Coatings Sales Share by Country (2017-2028)
Figure 90. Middle East and Africa Automotive Coatings Revenue Share by Country (2017-2028)
Figure 91. Turkey Automotive Coatings Revenue (2017-2028) & (US$ Million)
Figure 92. Saudi Arabia Automotive Coatings Revenue (2017-2028) & (US$ Million)
Figure 93. UAE Automotive Coatings Revenue (2017-2028) & (US$ Million)
Figure 94. Automotive Coatings Value Chain
Figure 95. Automotive Coatings Production Process
Figure 96. Channels of Distribution
Figure 97. Distributors Profiles
Figure 98. Bottom-up and Top-down Approaches for This Report
Figure 99. Data Triangulation
Figure 100. Key Executives Interviewed
$4900
$7350
$9800
HAVE A QUERY?
OUR CUSTOMER

SIMILAR REPORTS