
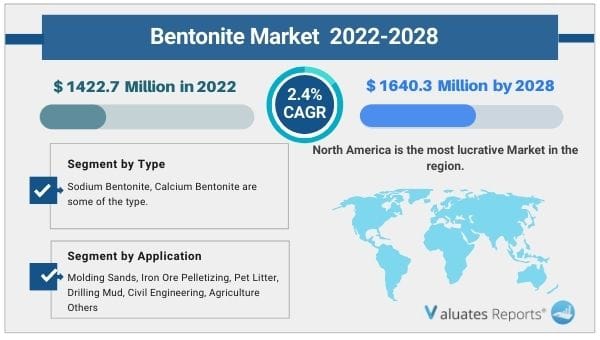
Due to the COVID-19 pandemic, the global Bentonite market size is estimated to be worth US$ 1422.7 million in 2022 and is forecast to be a readjusted size of US$ 1640.3 million by 2028 with a CAGR of 2.4% during the forecast period. Key drivers of the bentonite market include the growing use in construction and as an iron ore pelletizer.
The extensive use as an animal feed product and pet litter will fuel the growth of the bentonite market during the forecast period. The rising use of drilling fluids will propel the growth of the market in the coming years. The agricultural sector will fuel the growth of the market in the forthcoming period.
Bentonite is a commercially viable product due to its plasticity, lubricity, high compressive strength, low permeability, and high shear. The extensive dry bonding strength makes it powerful for use as a waterproofing and sealing agent in civil engineering applications. Although in its nascent stage bentonite is being used gradually in the construction industry. It is an excellent iron ore pelletizer and has a fluidic mass because of its superior rheological characteristics. Bentonite slurries aid in the strong bonding of concrete materials. Its main duty is to act as a retainer and prevent any degradation of the finished pile or wall. The slurry can be used multiple times without any harmful environmental impact. The demand for it is expected to rise due to rampant construction activities and a rise in landfills, or foundational work. These factors will boost the growth of the bentonite market during the forecast period.
Bentonite is an all-natural clay suitable as a livestock feed additive. It has the water-retaining capacity, cation exchangeability, and mycotoxins absorption. Sodium bentonite is added as a mycotoxin binder to bad-quality feed for neutralizing the harmful effects of mycotoxins. It enhances the pellet quality and eliminates caking and flowability. It improves the gain rate, milk production capacity, and finer wool quality growth along with egg production. Moreover, the hazardous effects of radionuclides are prevented and bacterial infections like salmonella do not enter the animal body. Proteins are broken down quickly with reduced cases of acidosis. Dietary toxins are eliminated with no chances of urea poisoning. These factors will drive the growth of the bentonite market in the coming years. Pet litter removal is a troublesome experience. The urine and smell are absorbed efficiently thereby keeping the area dry, clean, and air fresh. It inhibits the growth of bacteria.
Mineral bentonite is found abundantly all over the world. It acts as a dense fluidic substance when mechanically stressed. Bentonite in drilling mud lubricates and cools the cutting tools while protecting against corrosion. Deep penetration of fuel and gas is prevented by high hydrostatic pressure in the borehole. The liquid cuts the edges and when the purge pumps are kept waiting the thixotropy of the material stops the stones from dropping back into the main drilling shaft. It seals the shaft from all corners thereby forming a thick sludge cake around the borewell. The fine particles harden the ground structure and offer additional stability. On the other hand, other applications involve surface coating in varnishes and paints. The mineral is an excellent stabilizer in plastics, binders, absorbents, etc. The cosmetics and pharmaceuticals industry also utilize the mineral.
Bentonite clay especially calcium bentonite is highly stable and has a huge water retention capacity. Due to having more surface area the nutrient holding capacity of soils is enhanced thereby promoting growth rate and crop yields. It is regularly used with other organic components like compost, manure, mulches, etc. Furthermore, the structural framework of the molding sand is strengthened by the binding capacity of bentonite. The foundry sand can be used deliberately multiple times even after the pouring of metal castings. This decreases the expenses of waste disposal. Such factors will boost the growth of the bentonite market during the forecast period.
Based on type, the segmentations include sodium bentonite and calcium bentonite. Sodium bentonite is expected to grow the highest due to it being cheaper and having superior sealant properties along with being easy to install.
Based on application, the construction and iron ore pelletizing segment will grow the highest in the bentonite market share due to rising ore pelletizing processes and increased spending in the construction industry.
Based on region, Asia-Pacific will grow the highest in the bentonite market share due to the rapid expansion of the construction, oil, and gas industries.
The authors of this study have enlightened the readers on the rise and effect of the Covid-19 outbreak on the development. They have investigated the changes brought about in the demand/supply side, consumption, supply chain, and production/manufacturing. The readers will get familiar with the measures that have helped the key players to bring the Bentonite market back to the pre-covid levels.
In this segment of the report, the specialists have delved into the key growth opportunities that are likely to emerge. This will aid the key players to simplify complex issues related to business and framing future strategies to compete in this competitive environment. This section will certainly assist the players in boldly positioning their business.
In this section of the report, the researchers have done a comprehensive analysis of the prominent players operating and the strategies they are focusing on to combat the intense competition. Company profiles and share analysis of the prominent players are also provided in this section. They have also provided reliable sales and revenue data of the manufacturers for the period 2017-2022. With the assistance of this report, key players, stakeholders, and other participants will be able to stay abreast of the recent and upcoming developments in the business, further enabling them to make efficient choices.
| Report Metric | Details |
| Report Name | Bentonite Market |
| The market size in 2022 | USD 1422.7 Million |
| The revenue forecast in 2028 | USD 1640.3 Million |
| Growth Rate | Compound Annual Growth Rate (CAGR) of 2.4% from 2022 to 2028 |
| Market size available for years | 2022-2028 |
| Forecast units | Value (USD) |
| Segments covered | Type, Application and Region |
| Report coverage | Revenue & volume forecast, company share, competitive landscape, growth factors, and trends |
| Geographic regions covered | North America, Europe, Asia Pacific, Latin America, Middle East & Africa |
Ans. The global Bentonite market size is estimated to be worth US$ 1422.7 million in 2022 and is forecast to a readjusted size of US$ 1640.3 million by 2028.
Ans. The global Bentonite market is expected to grow at a compound annual growth rate of 2.4% from 2022 to 2028.
Ans. Some of the major companies are Amcol(US), Bentonite Performance Minerals LLC(US), Wyo-Ben Inc(US), Black Hills Bentonite(US), Tolsa Group (Spain), Imerys (S&B) (France), Clariant (Switzerland), Bentonite Company LLC (Russia), Laviosa Minerals SpA (Italy), LKAB Minerals (Netherlands), Ashapura (India), Star Bentonite Group (India), Kunimine Industries (Japan), Huawei Bentonite (China), Fenghong New Material (China), Chang’an Renheng (China), Liufangzi Bentonite (China), Bentonit Uniao (Brazil), Castiglioni Pes y Cia (Argentina), Canbensan (Turkey), Aydın Bentonit (Turkey), KarBen (Turkey), G & W Mineral Resources (South Africa), Ningcheng Tianyu (China), Elementis (UK).
Table of Contents
1 Study Coverage
1.1 Bentonite Product Introduction
1.2 Market by Type
1.2.1 Global Bentonite Market Size by Type, 2017 VS 2021 VS 2028
1.2.2 Sodium Bentonite
1.2.3 Calcium Bentonite
1.3 Market by Application
1.3.1 Global Bentonite Market Size by Application, 2017 VS 2021 VS 2028
1.3.2 Molding Sands
1.3.3 Iron Ore Pelletizing
1.3.4 Pet Litter
1.3.5 Drilling Mud
1.3.6 Civil Engineering
1.3.7 Agriculture
1.3.8 Others
1.4 Study Objectives
1.5 Years Considered
2 Global Bentonite Production
2.1 Global Bentonite Production Capacity (2017-2028)
2.2 Global Bentonite Production by Region: 2017 VS 2021 VS 2028
2.3 Global Bentonite Production by Region
2.3.1 Global Bentonite Historic Production by Region (2017-2022)
2.3.2 Global Bentonite Forecasted Production by Region (2023-2028)
2.4 North America
2.5 Europe
2.6 Middle East & Africa
2.7 Southeast Asia
2.8 South America
2.9 Japan
2.10 China
2.11 India
2.12 Australia
3 Global Bentonite Sales in Volume & Value Estimates and Forecasts
3.1 Global Bentonite Sales Estimates and Forecasts 2017-2028
3.2 Global Bentonite Revenue Estimates and Forecasts 2017-2028
3.3 Global Bentonite Revenue by Region: 2017 VS 2021 VS 2028
3.4 Global Bentonite Sales by Region
3.4.1 Global Bentonite Sales by Region (2017-2022)
3.4.2 Global Sales Bentonite by Region (2023-2028)
3.5 Global Bentonite Revenue by Region
3.5.1 Global Bentonite Revenue by Region (2017-2022)
3.5.2 Global Bentonite Revenue by Region (2023-2028)
3.6 North America
3.7 Europe
3.8 Asia-Pacific
3.9 Latin America
3.10 Middle East & Africa
4 Competition by Manufactures
4.1 Global Bentonite Production Capacity by Manufacturers
4.2 Global Bentonite Sales by Manufacturers
4.2.1 Global Bentonite Sales by Manufacturers (2017-2022)
4.2.2 Global Bentonite Sales Market Share by Manufacturers (2017-2022)
4.2.3 Global Top 10 and Top 5 Largest Manufacturers of Bentonite in 2021
4.3 Global Bentonite Revenue by Manufacturers
4.3.1 Global Bentonite Revenue by Manufacturers (2017-2022)
4.3.2 Global Bentonite Revenue Market Share by Manufacturers (2017-2022)
4.3.3 Global Top 10 and Top 5 Companies by Bentonite Revenue in 2021
4.4 Global Bentonite Sales Price by Manufacturers
4.5 Analysis of Competitive Landscape
4.5.1 Manufacturers Market Concentration Ratio (CR5 and HHI)
4.5.2 Global Bentonite Market Share by Company Type (Tier 1, Tier 2, and Tier 3)
4.5.3 Global Bentonite Manufacturers Geographical Distribution
4.6 Mergers & Acquisitions, Expansion Plans
5 Market Size by Type
5.1 Global Bentonite Sales by Type
5.1.1 Global Bentonite Historical Sales by Type (2017-2022)
5.1.2 Global Bentonite Forecasted Sales by Type (2023-2028)
5.1.3 Global Bentonite Sales Market Share by Type (2017-2028)
5.2 Global Bentonite Revenue by Type
5.2.1 Global Bentonite Historical Revenue by Type (2017-2022)
5.2.2 Global Bentonite Forecasted Revenue by Type (2023-2028)
5.2.3 Global Bentonite Revenue Market Share by Type (2017-2028)
5.3 Global Bentonite Price by Type
5.3.1 Global Bentonite Price by Type (2017-2022)
5.3.2 Global Bentonite Price Forecast by Type (2023-2028)
6 Market Size by Application
6.1 Global Bentonite Sales by Application
6.1.1 Global Bentonite Historical Sales by Application (2017-2022)
6.1.2 Global Bentonite Forecasted Sales by Application (2023-2028)
6.1.3 Global Bentonite Sales Market Share by Application (2017-2028)
6.2 Global Bentonite Revenue by Application
6.2.1 Global Bentonite Historical Revenue by Application (2017-2022)
6.2.2 Global Bentonite Forecasted Revenue by Application (2023-2028)
6.2.3 Global Bentonite Revenue Market Share by Application (2017-2028)
6.3 Global Bentonite Price by Application
6.3.1 Global Bentonite Price by Application (2017-2022)
6.3.2 Global Bentonite Price Forecast by Application (2023-2028)
7 North America
7.1 North America Bentonite Market Size by Type
7.1.1 North America Bentonite Sales by Type (2017-2028)
7.1.2 North America Bentonite Revenue by Type (2017-2028)
7.2 North America Bentonite Market Size by Application
7.2.1 North America Bentonite Sales by Application (2017-2028)
7.2.2 North America Bentonite Revenue by Application (2017-2028)
7.3 North America Bentonite Sales by Country
7.3.1 North America Bentonite Sales by Country (2017-2028)
7.3.2 North America Bentonite Revenue by Country (2017-2028)
7.3.3 U.S.
7.3.4 Canada
8 Europe
8.1 Europe Bentonite Market Size by Type
8.1.1 Europe Bentonite Sales by Type (2017-2028)
8.1.2 Europe Bentonite Revenue by Type (2017-2028)
8.2 Europe Bentonite Market Size by Application
8.2.1 Europe Bentonite Sales by Application (2017-2028)
8.2.2 Europe Bentonite Revenue by Application (2017-2028)
8.3 Europe Bentonite Sales by Country
8.3.1 Europe Bentonite Sales by Country (2017-2028)
8.3.2 Europe Bentonite Revenue by Country (2017-2028)
8.3.3 Germany
8.3.4 France
8.3.5 U.K.
8.3.6 Italy
8.3.7 Russia
9 Asia Pacific
9.1 Asia Pacific Bentonite Market Size by Type
9.1.1 Asia Pacific Bentonite Sales by Type (2017-2028)
9.1.2 Asia Pacific Bentonite Revenue by Type (2017-2028)
9.2 Asia Pacific Bentonite Market Size by Application
9.2.1 Asia Pacific Bentonite Sales by Application (2017-2028)
9.2.2 Asia Pacific Bentonite Revenue by Application (2017-2028)
9.3 Asia Pacific Bentonite Sales by Region
9.3.1 Asia Pacific Bentonite Sales by Region (2017-2028)
9.3.2 Asia Pacific Bentonite Revenue by Region (2017-2028)
9.3.3 China
9.3.4 Japan
9.3.5 South Korea
9.3.6 India
9.3.7 Australia
9.3.8 Taiwan
9.3.9 Indonesia
9.3.10 Thailand
9.3.11 Malaysia
9.3.12 Philippines
10 Latin America
10.1 Latin America Bentonite Market Size by Type
10.1.1 Latin America Bentonite Sales by Type (2017-2028)
10.1.2 Latin America Bentonite Revenue by Type (2017-2028)
10.2 Latin America Bentonite Market Size by Application
10.2.1 Latin America Bentonite Sales by Application (2017-2028)
10.2.2 Latin America Bentonite Revenue by Application (2017-2028)
10.3 Latin America Bentonite Sales by Country
10.3.1 Latin America Bentonite Sales by Country (2017-2028)
10.3.2 Latin America Bentonite Revenue by Country (2017-2028)
10.3.3 Mexico
10.3.4 Brazil
10.3.5 Argentina
11 Middle East and Africa
11.1 Middle East and Africa Bentonite Market Size by Type
11.1.1 Middle East and Africa Bentonite Sales by Type (2017-2028)
11.1.2 Middle East and Africa Bentonite Revenue by Type (2017-2028)
11.2 Middle East and Africa Bentonite Market Size by Application
11.2.1 Middle East and Africa Bentonite Sales by Application (2017-2028)
11.2.2 Middle East and Africa Bentonite Revenue by Application (2017-2028)
11.3 Middle East and Africa Bentonite Sales by Country
11.3.1 Middle East and Africa Bentonite Sales by Country (2017-2028)
11.3.2 Middle East and Africa Bentonite Revenue by Country (2017-2028)
11.3.3 Turkey
11.3.4 Saudi Arabia
11.3.5 U.A.E
12 Corporate Profiles
12.1 Amcol(US)
12.1.1 Amcol(US) Corporation Information
12.1.2 Amcol(US) Overview
12.1.3 Amcol(US) Bentonite Sales, Price, Revenue and Gross Margin (2017-2022)
12.1.4 Amcol(US) Bentonite Product Model Numbers, Pictures, Descriptions and Specifications
12.1.5 Amcol(US) Recent Developments
12.2 Bentonite Performance Minerals LLC(US)
12.2.1 Bentonite Performance Minerals LLC(US) Corporation Information
12.2.2 Bentonite Performance Minerals LLC(US) Overview
12.2.3 Bentonite Performance Minerals LLC(US) Bentonite Sales, Price, Revenue and Gross Margin (2017-2022)
12.2.4 Bentonite Performance Minerals LLC(US) Bentonite Product Model Numbers, Pictures, Descriptions and Specifications
12.2.5 Bentonite Performance Minerals LLC(US) Recent Developments
12.3 Wyo-Ben Inc(US)
12.3.1 Wyo-Ben Inc(US) Corporation Information
12.3.2 Wyo-Ben Inc(US) Overview
12.3.3 Wyo-Ben Inc(US) Bentonite Sales, Price, Revenue and Gross Margin (2017-2022)
12.3.4 Wyo-Ben Inc(US) Bentonite Product Model Numbers, Pictures, Descriptions and Specifications
12.3.5 Wyo-Ben Inc(US) Recent Developments
12.4 Black Hills Bentonite(US)
12.4.1 Black Hills Bentonite(US) Corporation Information
12.4.2 Black Hills Bentonite(US) Overview
12.4.3 Black Hills Bentonite(US) Bentonite Sales, Price, Revenue and Gross Margin (2017-2022)
12.4.4 Black Hills Bentonite(US) Bentonite Product Model Numbers, Pictures, Descriptions and Specifications
12.4.5 Black Hills Bentonite(US) Recent Developments
12.5 Tolsa Group (Spain)
12.5.1 Tolsa Group (Spain) Corporation Information
12.5.2 Tolsa Group (Spain) Overview
12.5.3 Tolsa Group (Spain) Bentonite Sales, Price, Revenue and Gross Margin (2017-2022)
12.5.4 Tolsa Group (Spain) Bentonite Product Model Numbers, Pictures, Descriptions and Specifications
12.5.5 Tolsa Group (Spain) Recent Developments
12.6 Imerys (S&B) (France)
12.6.1 Imerys (S&B) (France) Corporation Information
12.6.2 Imerys (S&B) (France) Overview
12.6.3 Imerys (S&B) (France) Bentonite Sales, Price, Revenue and Gross Margin (2017-2022)
12.6.4 Imerys (S&B) (France) Bentonite Product Model Numbers, Pictures, Descriptions and Specifications
12.6.5 Imerys (S&B) (France) Recent Developments
12.7 Clariant (Switzerland)
12.7.1 Clariant (Switzerland) Corporation Information
12.7.2 Clariant (Switzerland) Overview
12.7.3 Clariant (Switzerland) Bentonite Sales, Price, Revenue and Gross Margin (2017-2022)
12.7.4 Clariant (Switzerland) Bentonite Product Model Numbers, Pictures, Descriptions and Specifications
12.7.5 Clariant (Switzerland) Recent Developments
12.8 Bentonite Company LLC (Russia)
12.8.1 Bentonite Company LLC (Russia) Corporation Information
12.8.2 Bentonite Company LLC (Russia) Overview
12.8.3 Bentonite Company LLC (Russia) Bentonite Sales, Price, Revenue and Gross Margin (2017-2022)
12.8.4 Bentonite Company LLC (Russia) Bentonite Product Model Numbers, Pictures, Descriptions and Specifications
12.8.5 Bentonite Company LLC (Russia) Recent Developments
12.9 Laviosa Minerals SpA (Italy)
12.9.1 Laviosa Minerals SpA (Italy) Corporation Information
12.9.2 Laviosa Minerals SpA (Italy) Overview
12.9.3 Laviosa Minerals SpA (Italy) Bentonite Sales, Price, Revenue and Gross Margin (2017-2022)
12.9.4 Laviosa Minerals SpA (Italy) Bentonite Product Model Numbers, Pictures, Descriptions and Specifications
12.9.5 Laviosa Minerals SpA (Italy) Recent Developments
12.10 LKAB Minerals (Netherlands)
12.10.1 LKAB Minerals (Netherlands) Corporation Information
12.10.2 LKAB Minerals (Netherlands) Overview
12.10.3 LKAB Minerals (Netherlands) Bentonite Sales, Price, Revenue and Gross Margin (2017-2022)
12.10.4 LKAB Minerals (Netherlands) Bentonite Product Model Numbers, Pictures, Descriptions and Specifications
12.10.5 LKAB Minerals (Netherlands) Recent Developments
12.11 Ashapura (India)
12.11.1 Ashapura (India) Corporation Information
12.11.2 Ashapura (India) Overview
12.11.3 Ashapura (India) Bentonite Sales, Price, Revenue and Gross Margin (2017-2022)
12.11.4 Ashapura (India) Bentonite Product Model Numbers, Pictures, Descriptions and Specifications
12.11.5 Ashapura (India) Recent Developments
12.12 Star Bentonite Group (India)
12.12.1 Star Bentonite Group (India) Corporation Information
12.12.2 Star Bentonite Group (India) Overview
12.12.3 Star Bentonite Group (India) Bentonite Sales, Price, Revenue and Gross Margin (2017-2022)
12.12.4 Star Bentonite Group (India) Bentonite Product Model Numbers, Pictures, Descriptions and Specifications
12.12.5 Star Bentonite Group (India) Recent Developments
12.13 Kunimine Industries (Japan)
12.13.1 Kunimine Industries (Japan) Corporation Information
12.13.2 Kunimine Industries (Japan) Overview
12.13.3 Kunimine Industries (Japan) Bentonite Sales, Price, Revenue and Gross Margin (2017-2022)
12.13.4 Kunimine Industries (Japan) Bentonite Product Model Numbers, Pictures, Descriptions and Specifications
12.13.5 Kunimine Industries (Japan) Recent Developments
12.14 Huawei Bentonite (China)
12.14.1 Huawei Bentonite (China) Corporation Information
12.14.2 Huawei Bentonite (China) Overview
12.14.3 Huawei Bentonite (China) Bentonite Sales, Price, Revenue and Gross Margin (2017-2022)
12.14.4 Huawei Bentonite (China) Bentonite Product Model Numbers, Pictures, Descriptions and Specifications
12.14.5 Huawei Bentonite (China) Recent Developments
12.15 Fenghong New Material (China)
12.15.1 Fenghong New Material (China) Corporation Information
12.15.2 Fenghong New Material (China) Overview
12.15.3 Fenghong New Material (China) Bentonite Sales, Price, Revenue and Gross Margin (2017-2022)
12.15.4 Fenghong New Material (China) Bentonite Product Model Numbers, Pictures, Descriptions and Specifications
12.15.5 Fenghong New Material (China) Recent Developments
12.16 Chang’an Renheng (China)
12.16.1 Chang’an Renheng (China) Corporation Information
12.16.2 Chang’an Renheng (China) Overview
12.16.3 Chang’an Renheng (China) Bentonite Sales, Price, Revenue and Gross Margin (2017-2022)
12.16.4 Chang’an Renheng (China) Bentonite Product Model Numbers, Pictures, Descriptions and Specifications
12.16.5 Chang’an Renheng (China) Recent Developments
12.17 Liufangzi Bentonite (China)
12.17.1 Liufangzi Bentonite (China) Corporation Information
12.17.2 Liufangzi Bentonite (China) Overview
12.17.3 Liufangzi Bentonite (China) Bentonite Sales, Price, Revenue and Gross Margin (2017-2022)
12.17.4 Liufangzi Bentonite (China) Bentonite Product Model Numbers, Pictures, Descriptions and Specifications
12.17.5 Liufangzi Bentonite (China) Recent Developments
12.18 Bentonit Uniao (Brazil)
12.18.1 Bentonit Uniao (Brazil) Corporation Information
12.18.2 Bentonit Uniao (Brazil) Overview
12.18.3 Bentonit Uniao (Brazil) Bentonite Sales, Price, Revenue and Gross Margin (2017-2022)
12.18.4 Bentonit Uniao (Brazil) Bentonite Product Model Numbers, Pictures, Descriptions and Specifications
12.18.5 Bentonit Uniao (Brazil) Recent Developments
12.19 Castiglioni Pes y Cia (Argentina)
12.19.1 Castiglioni Pes y Cia (Argentina) Corporation Information
12.19.2 Castiglioni Pes y Cia (Argentina) Overview
12.19.3 Castiglioni Pes y Cia (Argentina) Bentonite Sales, Price, Revenue and Gross Margin (2017-2022)
12.19.4 Castiglioni Pes y Cia (Argentina) Bentonite Product Model Numbers, Pictures, Descriptions and Specifications
12.19.5 Castiglioni Pes y Cia (Argentina) Recent Developments
12.20 Canbensan (Turkey)
12.20.1 Canbensan (Turkey) Corporation Information
12.20.2 Canbensan (Turkey) Overview
12.20.3 Canbensan (Turkey) Bentonite Sales, Price, Revenue and Gross Margin (2017-2022)
12.20.4 Canbensan (Turkey) Bentonite Product Model Numbers, Pictures, Descriptions and Specifications
12.20.5 Canbensan (Turkey) Recent Developments
12.21 Aydın Bentonit (Turkey)
12.21.1 Aydın Bentonit (Turkey) Corporation Information
12.21.2 Aydın Bentonit (Turkey) Overview
12.21.3 Aydın Bentonit (Turkey) Bentonite Sales, Price, Revenue and Gross Margin (2017-2022)
12.21.4 Aydın Bentonit (Turkey) Bentonite Product Model Numbers, Pictures, Descriptions and Specifications
12.21.5 Aydın Bentonit (Turkey) Recent Developments
12.22 KarBen (Turkey)
12.22.1 KarBen (Turkey) Corporation Information
12.22.2 KarBen (Turkey) Overview
12.22.3 KarBen (Turkey) Bentonite Sales, Price, Revenue and Gross Margin (2017-2022)
12.22.4 KarBen (Turkey) Bentonite Product Model Numbers, Pictures, Descriptions and Specifications
12.22.5 KarBen (Turkey) Recent Developments
12.23 G & W Mineral Resources (South Africa)
12.23.1 G & W Mineral Resources (South Africa) Corporation Information
12.23.2 G & W Mineral Resources (South Africa) Overview
12.23.3 G & W Mineral Resources (South Africa) Bentonite Sales, Price, Revenue and Gross Margin (2017-2022)
12.23.4 G & W Mineral Resources (South Africa) Bentonite Product Model Numbers, Pictures, Descriptions and Specifications
12.23.5 G & W Mineral Resources (South Africa) Recent Developments
12.24 Ningcheng Tianyu (China)
12.24.1 Ningcheng Tianyu (China) Corporation Information
12.24.2 Ningcheng Tianyu (China) Overview
12.24.3 Ningcheng Tianyu (China) Bentonite Sales, Price, Revenue and Gross Margin (2017-2022)
12.24.4 Ningcheng Tianyu (China) Bentonite Product Model Numbers, Pictures, Descriptions and Specifications
12.24.5 Ningcheng Tianyu (China) Recent Developments
12.25 Elementis (UK)
12.25.1 Elementis (UK) Corporation Information
12.25.2 Elementis (UK) Overview
12.25.3 Elementis (UK) Bentonite Sales, Price, Revenue and Gross Margin (2017-2022)
12.25.4 Elementis (UK) Bentonite Product Model Numbers, Pictures, Descriptions and Specifications
12.25.5 Elementis (UK) Recent Developments
13 Industry Chain and Sales Channels Analysis
13.1 Bentonite Industry Chain Analysis
13.2 Bentonite Key Raw Materials
13.2.1 Key Raw Materials
13.2.2 Raw Materials Key Suppliers
13.3 Bentonite Production Mode & Process
13.4 Bentonite Sales and Marketing
13.4.1 Bentonite Sales Channels
13.4.2 Bentonite Distributors
13.5 Bentonite Customers
14 Market Drivers, Opportunities, Challenges, and Risks Factors Analysis
14.1 Bentonite Industry Trends
14.2 Bentonite Market Drivers
14.3 Bentonite Market Challenges
14.4 Bentonite Market Restraints
15 Key Finding in The Global Bentonite Study
16 Appendix
16.1 Research Methodology
16.1.1 Methodology/Research Approach
16.1.2 Data Source
16.2 Author Details
16.3 Disclaimer
Tables & Figures :
List of Tables
Table 1. Global Bentonite Market Size Growth Rate by Type, 2017 VS 2021 VS 2028 (US$ Million)
Table 2. Major Manufacturers of Sodium Bentonite
Table 3. Major Manufacturers of Calcium Bentonite
Table 4. Global Bentonite Market Size Growth Rate by Application, 2017 VS 2021 2028 (US$ Million)
Table 5. Global Bentonite Production by Region: 2017 VS 2021 VS 2028 (K MT)
Table 6. Global Bentonite Production by Region (2017-2022) & (K MT)
Table 7. Global Bentonite Production Market Share by Region (2017-2022)
Table 8. Global Bentonite Production by Region (2023-2028) & (K MT)
Table 9. Global Bentonite Production Market Share by Region (2023-2028)
Table 10. Global Bentonite Revenue by Region: 2017 VS 2021 VS 2028 (US$ Million)
Table 11. Global Bentonite Sales by Region (2017-2022) & (K MT)
Table 12. Global Bentonite Sales Market Share by Region (2017-2022)
Table 13. Global Bentonite Sales by Region (2023-2028) & (K MT)
Table 14. Global Bentonite Sales Market Share by Region (2023-2028)
Table 15. Global Bentonite Revenue by Region (2017-2022) & (US$ Million)
Table 16. Global Bentonite Revenue Market Share by Region (2017-2022)
Table 17. Global Bentonite Revenue by Region (2023-2028) & (US$ Million)
Table 18. Global Bentonite Revenue Market Share by Region (2023-2028)
Table 19. Global Bentonite Production Capacity by Manufacturers (2017-2022) & (K MT)
Table 20. Global Bentonite Capacity Market Share by Manufacturers (2017-2022)
Table 21. Global Bentonite Sales by Manufacturers (2017-2022) & (K MT)
Table 22. Global Bentonite Sales Market Share by Manufacturers (2017-2022)
Table 23. Global Bentonite Revenue by Manufacturers (2017-2022) & (US$ Million)
Table 24. Global Bentonite Revenue Share by Manufacturers (2017-2022)
Table 25. Bentonite Price by Manufacturers 2017-2022 (USD/MT)
Table 26. Global Bentonite Manufacturers Market Concentration Ratio (CR5 and HHI)
Table 27. Global Bentonite by Company Type (Tier 1, Tier 2, and Tier 3) & (based on the Revenue in Bentonite as of 2021)
Table 28. Bentonite Manufacturing Base Distribution and Headquarters
Table 29. Manufacturers Bentonite Product Offered
Table 30. Date of Manufacturers Enter into Bentonite Market
Table 31. Mergers & Acquisitions, Expansion Plans
Table 32. Global Bentonite Sales by Type (2017-2022) & (K MT)
Table 33. Global Bentonite Sales by Type (2023-2028) & (K MT)
Table 34. Global Bentonite Sales Share by Type (2017-2022)
Table 35. Global Bentonite Sales Share by Type (2023-2028)
Table 36. Global Bentonite Revenue by Type (2017-2022) & (US$ Million)
Table 37. Global Bentonite Revenue by Type (2023-2028) & (US$ Million)
Table 38. Global Bentonite Revenue Share by Type (2017-2022)
Table 39. Global Bentonite Revenue Share by Type (2023-2028)
Table 40. Bentonite Price by Type (2017-2022) & (USD/MT)
Table 41. Global Bentonite Price Forecast by Type (2023-2028) & (USD/MT)
Table 42. Global Bentonite Sales by Application (2017-2022) & (K MT)
Table 43. Global Bentonite Sales by Application (2023-2028) & (K MT)
Table 44. Global Bentonite Sales Share by Application (2017-2022)
Table 45. Global Bentonite Sales Share by Application (2023-2028)
Table 46. Global Bentonite Revenue by Application (2017-2022) & (US$ Million)
Table 47. Global Bentonite Revenue by Application (2023-2028) & (US$ Million)
Table 48. Global Bentonite Revenue Share by Application (2017-2022)
Table 49. Global Bentonite Revenue Share by Application (2023-2028)
Table 50. Bentonite Price by Application (2017-2022) & (USD/MT)
Table 51. Global Bentonite Price Forecast by Application (2023-2028) & (USD/MT)
Table 52. North America Bentonite Sales by Type (2017-2022) & (K MT)
Table 53. North America Bentonite Sales by Type (2023-2028) & (K MT)
Table 54. North America Bentonite Revenue by Type (2017-2022) & (US$ Million)
Table 55. North America Bentonite Revenue by Type (2023-2028) & (US$ Million)
Table 56. North America Bentonite Sales by Application (2017-2022) & (K MT)
Table 57. North America Bentonite Sales by Application (2023-2028) & (K MT)
Table 58. North America Bentonite Revenue by Application (2017-2022) & (US$ Million)
Table 59. North America Bentonite Revenue by Application (2023-2028) & (US$ Million)
Table 60. North America Bentonite Sales by Country (2017-2022) & (K MT)
Table 61. North America Bentonite Sales by Country (2023-2028) & (K MT)
Table 62. North America Bentonite Revenue by Country (2017-2022) & (US$ Million)
Table 63. North America Bentonite Revenue by Country (2023-2028) & (US$ Million)
Table 64. Europe Bentonite Sales by Type (2017-2022) & (K MT)
Table 65. Europe Bentonite Sales by Type (2023-2028) & (K MT)
Table 66. Europe Bentonite Revenue by Type (2017-2022) & (US$ Million)
Table 67. Europe Bentonite Revenue by Type (2023-2028) & (US$ Million)
Table 68. Europe Bentonite Sales by Application (2017-2022) & (K MT)
Table 69. Europe Bentonite Sales by Application (2023-2028) & (K MT)
Table 70. Europe Bentonite Revenue by Application (2017-2022) & (US$ Million)
Table 71. Europe Bentonite Revenue by Application (2023-2028) & (US$ Million)
Table 72. Europe Bentonite Sales by Country (2017-2022) & (K MT)
Table 73. Europe Bentonite Sales by Country (2023-2028) & (K MT)
Table 74. Europe Bentonite Revenue by Country (2017-2022) & (US$ Million)
Table 75. Europe Bentonite Revenue by Country (2023-2028) & (US$ Million)
Table 76. Asia Pacific Bentonite Sales by Type (2017-2022) & (K MT)
Table 77. Asia Pacific Bentonite Sales by Type (2023-2028) & (K MT)
Table 78. Asia Pacific Bentonite Revenue by Type (2017-2022) & (US$ Million)
Table 79. Asia Pacific Bentonite Revenue by Type (2023-2028) & (US$ Million)
Table 80. Asia Pacific Bentonite Sales by Application (2017-2022) & (K MT)
Table 81. Asia Pacific Bentonite Sales by Application (2023-2028) & (K MT)
Table 82. Asia Pacific Bentonite Revenue by Application (2017-2022) & (US$ Million)
Table 83. Asia Pacific Bentonite Revenue by Application (2023-2028) & (US$ Million)
Table 84. Asia Pacific Bentonite Sales by Region (2017-2022) & (K MT)
Table 85. Asia Pacific Bentonite Sales by Region (2023-2028) & (K MT)
Table 86. Asia Pacific Bentonite Revenue by Region (2017-2022) & (US$ Million)
Table 87. Asia Pacific Bentonite Revenue by Region (2023-2028) & (US$ Million)
Table 88. Latin America Bentonite Sales by Type (2017-2022) & (K MT)
Table 89. Latin America Bentonite Sales by Type (2023-2028) & (K MT)
Table 90. Latin America Bentonite Revenue by Type (2017-2022) & (US$ Million)
Table 91. Latin America Bentonite Revenue by Type (2023-2028) & (US$ Million)
Table 92. Latin America Bentonite Sales by Application (2017-2022) & (K MT)
Table 93. Latin America Bentonite Sales by Application (2023-2028) & (K MT)
Table 94. Latin America Bentonite Revenue by Application (2017-2022) & (US$ Million)
Table 95. Latin America Bentonite Revenue by Application (2023-2028) & (US$ Million)
Table 96. Latin America Bentonite Sales by Country (2017-2022) & (K MT)
Table 97. Latin America Bentonite Sales by Country (2023-2028) & (K MT)
Table 98. Latin America Bentonite Revenue by Country (2017-2022) & (US$ Million)
Table 99. Latin America Bentonite Revenue by Country (2023-2028) & (US$ Million)
Table 100. Middle East and Africa Bentonite Sales by Type (2017-2022) & (K MT)
Table 101. Middle East and Africa Bentonite Sales by Type (2023-2028) & (K MT)
Table 102. Middle East and Africa Bentonite Revenue by Type (2017-2022) & (US$ Million)
Table 103. Middle East and Africa Bentonite Revenue by Type (2023-2028) & (US$ Million)
Table 104. Middle East and Africa Bentonite Sales by Application (2017-2022) & (K MT)
Table 105. Middle East and Africa Bentonite Sales by Application (2023-2028) & (K MT)
Table 106. Middle East and Africa Bentonite Revenue by Application (2017-2022) & (US$ Million)
Table 107. Middle East and Africa Bentonite Revenue by Application (2023-2028) & (US$ Million)
Table 108. Middle East and Africa Bentonite Sales by Country (2017-2022) & (K MT)
Table 109. Middle East and Africa Bentonite Sales by Country (2023-2028) & (K MT)
Table 110. Middle East and Africa Bentonite Revenue by Country (2017-2022) & (US$ Million)
Table 111. Middle East and Africa Bentonite Revenue by Country (2023-2028) & (US$ Million)
Table 112. Amcol(US) Corporation Information
Table 113. Amcol(US) Description and Major Businesses
Table 114. Amcol(US) Bentonite Sales (K MT), Revenue (US$ Million), Price (USD/MT) and Gross Margin (2017-2022)
Table 115. Amcol(US) Bentonite Product Model Numbers, Pictures, Descriptions and Specifications
Table 116. Amcol(US) Recent Development
Table 117. Bentonite Performance Minerals LLC(US) Corporation Information
Table 118. Bentonite Performance Minerals LLC(US) Description and Major Businesses
Table 119. Bentonite Performance Minerals LLC(US) Bentonite Sales (K MT), Revenue (US$ Million), Price (USD/MT) and Gross Margin (2017-2022)
Table 120. Bentonite Performance Minerals LLC(US) Bentonite Product Model Numbers, Pictures, Descriptions and Specifications
Table 121. Bentonite Performance Minerals LLC(US) Recent Development
Table 122. Wyo-Ben Inc(US) Corporation Information
Table 123. Wyo-Ben Inc(US) Description and Major Businesses
Table 124. Wyo-Ben Inc(US) Bentonite Sales (K MT), Revenue (US$ Million), Price (USD/MT) and Gross Margin (2017-2022)
Table 125. Wyo-Ben Inc(US) Bentonite Product Model Numbers, Pictures, Descriptions and Specifications
Table 126. Wyo-Ben Inc(US) Recent Development
Table 127. Black Hills Bentonite(US) Corporation Information
Table 128. Black Hills Bentonite(US) Description and Major Businesses
Table 129. Black Hills Bentonite(US) Bentonite Sales (K MT), Revenue (US$ Million), Price (USD/MT) and Gross Margin (2017-2022)
Table 130. Black Hills Bentonite(US) Bentonite Product Model Numbers, Pictures, Descriptions and Specifications
Table 131. Black Hills Bentonite(US) Recent Development
Table 132. Tolsa Group (Spain) Corporation Information
Table 133. Tolsa Group (Spain) Description and Major Businesses
Table 134. Tolsa Group (Spain) Bentonite Sales (K MT), Revenue (US$ Million), Price (USD/MT) and Gross Margin (2017-2022)
Table 135. Tolsa Group (Spain) Bentonite Product Model Numbers, Pictures, Descriptions and Specifications
Table 136. Tolsa Group (Spain) Recent Development
Table 137. Imerys (S&B) (France) Corporation Information
Table 138. Imerys (S&B) (France) Description and Major Businesses
Table 139. Imerys (S&B) (France) Bentonite Sales (K MT), Revenue (US$ Million), Price (USD/MT) and Gross Margin (2017-2022)
Table 140. Imerys (S&B) (France) Bentonite Product Model Numbers, Pictures, Descriptions and Specifications
Table 141. Imerys (S&B) (France) Recent Development
Table 142. Clariant (Switzerland) Corporation Information
Table 143. Clariant (Switzerland) Description and Major Businesses
Table 144. Clariant (Switzerland) Bentonite Sales (K MT), Revenue (US$ Million), Price (USD/MT) and Gross Margin (2017-2022)
Table 145. Clariant (Switzerland) Bentonite Product Model Numbers, Pictures, Descriptions and Specifications
Table 146. Clariant (Switzerland) Recent Development
Table 147. Bentonite Company LLC (Russia) Corporation Information
Table 148. Bentonite Company LLC (Russia) Description and Major Businesses
Table 149. Bentonite Company LLC (Russia) Bentonite Sales (K MT), Revenue (US$ Million), Price (USD/MT) and Gross Margin (2017-2022)
Table 150. Bentonite Company LLC (Russia) Bentonite Product Model Numbers, Pictures, Descriptions and Specifications
Table 151. Bentonite Company LLC (Russia) Recent Development
Table 152. Laviosa Minerals SpA (Italy) Corporation Information
Table 153. Laviosa Minerals SpA (Italy) Description and Major Businesses
Table 154. Laviosa Minerals SpA (Italy) Bentonite Sales (K MT), Revenue (US$ Million), Price (USD/MT) and Gross Margin (2017-2022)
Table 155. Laviosa Minerals SpA (Italy) Bentonite Product Model Numbers, Pictures, Descriptions and Specifications
Table 156. Laviosa Minerals SpA (Italy) Recent Development
Table 157. LKAB Minerals (Netherlands) Corporation Information
Table 158. LKAB Minerals (Netherlands) Description and Major Businesses
Table 159. LKAB Minerals (Netherlands) Bentonite Sales (K MT), Revenue (US$ Million), Price (USD/MT) and Gross Margin (2017-2022)
Table 160. LKAB Minerals (Netherlands) Bentonite Product Model Numbers, Pictures, Descriptions and Specifications
Table 161. LKAB Minerals (Netherlands) Recent Development
Table 162. Ashapura (India) Corporation Information
Table 163. Ashapura (India) Description and Major Businesses
Table 164. Ashapura (India) Bentonite Sales (K MT), Revenue (US$ Million), Price (USD/MT) and Gross Margin (2017-2022)
Table 165. Ashapura (India) Bentonite Product Model Numbers, Pictures, Descriptions and Specifications
Table 166. Ashapura (India) Recent Development
Table 167. Star Bentonite Group (India) Corporation Information
Table 168. Star Bentonite Group (India) Description and Major Businesses
Table 169. Star Bentonite Group (India) Bentonite Sales (K MT), Revenue (US$ Million), Price (USD/MT) and Gross Margin (2017-2022)
Table 170. Star Bentonite Group (India) Bentonite Product Model Numbers, Pictures, Descriptions and Specifications
Table 171. Star Bentonite Group (India) Recent Development
Table 172. Kunimine Industries (Japan) Corporation Information
Table 173. Kunimine Industries (Japan) Description and Major Businesses
Table 174. Kunimine Industries (Japan) Bentonite Sales (K MT), Revenue (US$ Million), Price (USD/MT) and Gross Margin (2017-2022)
Table 175. Kunimine Industries (Japan) Bentonite Product Model Numbers, Pictures, Descriptions and Specifications
Table 176. Kunimine Industries (Japan) Recent Development
Table 177. Huawei Bentonite (China) Corporation Information
Table 178. Huawei Bentonite (China) Description and Major Businesses
Table 179. Huawei Bentonite (China) Bentonite Sales (K MT), Revenue (US$ Million), Price (USD/MT) and Gross Margin (2017-2022)
Table 180. Huawei Bentonite (China) Bentonite Product Model Numbers, Pictures, Descriptions and Specifications
Table 181. Huawei Bentonite (China) Recent Development
Table 182. Fenghong New Material (China) Corporation Information
Table 183. Fenghong New Material (China) Description and Major Businesses
Table 184. Fenghong New Material (China) Bentonite Sales (K MT), Revenue (US$ Million), Price (USD/MT) and Gross Margin (2017-2022)
Table 185. Fenghong New Material (China) Bentonite Product Model Numbers, Pictures, Descriptions and Specifications
Table 186. Fenghong New Material (China) Recent Development
Table 187. Chang’an Renheng (China) Corporation Information
Table 188. Chang’an Renheng (China) Description and Major Businesses
Table 189. Chang’an Renheng (China) Bentonite Sales (K MT), Revenue (US$ Million), Price (USD/MT) and Gross Margin (2017-2022)
Table 190. Chang’an Renheng (China) Bentonite Product Model Numbers, Pictures, Descriptions and Specifications
Table 191. Chang’an Renheng (China) Recent Development
Table 192. Liufangzi Bentonite (China) Corporation Information
Table 193. Liufangzi Bentonite (China) Description and Major Businesses
Table 194. Liufangzi Bentonite (China) Bentonite Sales (K MT), Revenue (US$ Million), Price (USD/MT) and Gross Margin (2017-2022)
Table 195. Liufangzi Bentonite (China) Bentonite Product Model Numbers, Pictures, Descriptions and Specifications
Table 196. Liufangzi Bentonite (China) Recent Development
Table 197. Bentonit Uniao (Brazil) Corporation Information
Table 198. Bentonit Uniao (Brazil) Description and Major Businesses
Table 199. Bentonit Uniao (Brazil) Bentonite Sales (K MT), Revenue (US$ Million), Price (USD/MT) and Gross Margin (2017-2022)
Table 200. Bentonit Uniao (Brazil) Bentonite Product Model Numbers, Pictures, Descriptions and Specifications
Table 201. Bentonit Uniao (Brazil) Recent Development
Table 202. Castiglioni Pes y Cia (Argentina) Corporation Information
Table 203. Castiglioni Pes y Cia (Argentina) Description and Major Businesses
Table 204. Castiglioni Pes y Cia (Argentina) Bentonite Sales (K MT), Revenue (US$ Million), Price (USD/MT) and Gross Margin (2017-2022)
Table 205. Castiglioni Pes y Cia (Argentina) Bentonite Product Model Numbers, Pictures, Descriptions and Specifications
Table 206. Castiglioni Pes y Cia (Argentina) Recent Development
Table 207. Canbensan (Turkey) Corporation Information
Table 208. Canbensan (Turkey) Description and Major Businesses
Table 209. Canbensan (Turkey) Bentonite Sales (K MT), Revenue (US$ Million), Price (USD/MT) and Gross Margin (2017-2022)
Table 210. Canbensan (Turkey) Bentonite Product Model Numbers, Pictures, Descriptions and Specifications
Table 211. Canbensan (Turkey) Recent Development
Table 212. Aydın Bentonit (Turkey) Corporation Information
Table 213. Aydın Bentonit (Turkey) Description and Major Businesses
Table 214. Aydın Bentonit (Turkey) Bentonite Sales (K MT), Revenue (US$ Million), Price (USD/MT) and Gross Margin (2017-2022)
Table 215. Aydın Bentonit (Turkey) Bentonite Product Model Numbers, Pictures, Descriptions and Specifications
Table 216. Aydın Bentonit (Turkey) Recent Development
Table 217. KarBen (Turkey) Corporation Information
Table 218. KarBen (Turkey) Description and Major Businesses
Table 219. KarBen (Turkey) Bentonite Sales (K MT), Revenue (US$ Million), Price (USD/MT) and Gross Margin (2017-2022)
Table 220. KarBen (Turkey) Bentonite Product Model Numbers, Pictures, Descriptions and Specifications
Table 221. KarBen (Turkey) Recent Development
Table 222. G & W Mineral Resources (South Africa) Corporation Information
Table 223. G & W Mineral Resources (South Africa) Description and Major Businesses
Table 224. G & W Mineral Resources (South Africa) Bentonite Sales (K MT), Revenue (US$ Million), Price (USD/MT) and Gross Margin (2017-2022)
Table 225. G & W Mineral Resources (South Africa) Bentonite Product Model Numbers, Pictures, Descriptions and Specifications
Table 226. G & W Mineral Resources (South Africa) Recent Development
Table 227. Ningcheng Tianyu (China) Corporation Information
Table 228. Ningcheng Tianyu (China) Description and Major Businesses
Table 229. Ningcheng Tianyu (China) Bentonite Sales (K MT), Revenue (US$ Million), Price (USD/MT) and Gross Margin (2017-2022)
Table 230. Ningcheng Tianyu (China) Bentonite Product Model Numbers, Pictures, Descriptions and Specifications
Table 231. Ningcheng Tianyu (China) Recent Development
Table 232. Elementis (UK) Corporation Information
Table 233. Elementis (UK) Description and Major Businesses
Table 234. Elementis (UK) Bentonite Sales (K MT), Revenue (US$ Million), Price (USD/MT) and Gross Margin (2017-2022)
Table 235. Elementis (UK) Bentonite Product Model Numbers, Pictures, Descriptions and Specifications
Table 236. Elementis (UK) Recent Development
Table 237. Key Raw Materials Lists
Table 238. Raw Materials Key Suppliers Lists
Table 239. Bentonite Distributors List
Table 240. Bentonite Customers List
Table 241. Bentonite Market Trends
Table 242. Bentonite Market Drivers
Table 243. Bentonite Market Challenges
Table 244. Bentonite Market Restraints
Table 245. Research Programs/Design for This Report
Table 246. Key Data Information from Secondary Sources
Table 247. Key Data Information from Primary Sources
List of Figures
Figure 1. Bentonite Product Picture
Figure 2. Global Bentonite Market Share by Type in 2021 & 2028
Figure 3. Sodium Bentonite Product Picture
Figure 4. Calcium Bentonite Product Picture
Figure 5. Global Bentonite Market Share by Application in 2021 & 2028
Figure 6. Molding Sands
Figure 7. Iron Ore Pelletizing
Figure 8. Pet Litter
Figure 9. Drilling Mud
Figure 10. Civil Engineering
Figure 11. Agriculture
Figure 12. Others
Figure 13. Bentonite Report Years Considered
Figure 14. Global Bentonite Capacity, Production and Utilization (2017-2028) & (K MT)
Figure 15. Global Bentonite Production Market Share by Region in Percentage: 2021 Versus 2028
Figure 16. Global Bentonite Production Market Share by Region (2017-2022)
Figure 17. Global Bentonite Production Market Share by Region (2023-2028)
Figure 18. Bentonite Production Growth Rate in North America (2017-2028) & (K MT)
Figure 19. Bentonite Production Growth Rate in Europe (2017-2028) & (K MT)
Figure 20. Bentonite Production Growth Rate in Middle East & Africa (2017-2028) & (K MT)
Figure 21. Bentonite Production Growth Rate in Southeast Asia (2017-2028) & (K MT)
Figure 22. Bentonite Production Growth Rate in South America (2017-2028) & (K MT)
Figure 23. Bentonite Production Growth Rate in Japan (2017-2028) & (K MT)
Figure 24. Bentonite Production Growth Rate in China (2017-2028) & (K MT)
Figure 25. Bentonite Production Growth Rate in India (2017-2028) & (K MT)
Figure 26. Global Bentonite Sales 2017-2028 (K MT)
Figure 27. Global Bentonite Revenue, (US$ Million), 2017 VS 2021 VS 2028
Figure 28. Global Bentonite Revenue 2017-2028 (US$ Million)
Figure 29. Global Bentonite Revenue Market Share by Region in Percentage: 2021 Versus 2028
Figure 30. Global Bentonite Sales Market Share by Region (2017-2022)
Figure 31. Global Bentonite Sales Market Share by Region (2023-2028)
Figure 32. North America Bentonite Sales YoY (2017-2028) & (K MT)
Figure 33. North America Bentonite Revenue YoY (2017-2028) & (US$ Million)
Figure 34. Europe Bentonite Sales YoY (2017-2028) & (K MT)
Figure 35. Europe Bentonite Revenue YoY (2017-2028) & (US$ Million)
Figure 36. Asia-Pacific Bentonite Sales YoY (2017-2028) & (K MT)
Figure 37. Asia-Pacific Bentonite Revenue YoY (2017-2028) & (US$ Million)
Figure 38. Latin America Bentonite Sales YoY (2017-2028) & (K MT)
Figure 39. Latin America Bentonite Revenue YoY (2017-2028) & (US$ Million)
Figure 40. Middle East & Africa Bentonite Sales YoY (2017-2028) & (K MT)
Figure 41. Middle East & Africa Bentonite Revenue YoY (2017-2028) & (US$ Million)
Figure 42. The Bentonite Market Share of Top 10 and Top 5 Largest Manufacturers Around the World in 2021
Figure 43. The Top 5 and 10 Largest Manufacturers of Bentonite in the World: Market Share by Bentonite Revenue in 2021
Figure 44. Bentonite Market Share by Company Type (Tier 1, Tier 2, and Tier 3): 2017 VS 2021
Figure 45. Global Bentonite Sales Market Share by Type (2017-2028)
Figure 46. Global Bentonite Revenue Market Share by Type (2017-2028)
Figure 47. Global Bentonite Sales Market Share by Application (2017-2028)
Figure 48. Global Bentonite Revenue Market Share by Application (2017-2028)
Figure 49. North America Bentonite Sales Market Share by Type (2017-2028)
Figure 50. North America Bentonite Revenue Market Share by Type (2017-2028)
Figure 51. North America Bentonite Sales Market Share by Application (2017-2028)
Figure 52. North America Bentonite Revenue Market Share by Application (2017-2028)
Figure 53. North America Bentonite Sales Share by Country (2017-2028)
Figure 54. North America Bentonite Revenue Share by Country (2017-2028)
Figure 55. U.S. Bentonite Revenue (2017-2028) & (US$ Million)
Figure 56. Canada Bentonite Revenue (2017-2028) & (US$ Million)
Figure 57. Europe Bentonite Sales Market Share by Type (2017-2028)
Figure 58. Europe Bentonite Revenue Market Share by Type (2017-2028)
Figure 59. Europe Bentonite Sales Market Share by Application (2017-2028)
Figure 60. Europe Bentonite Revenue Market Share by Application (2017-2028)
Figure 61. Europe Bentonite Sales Share by Country (2017-2028)
Figure 62. Europe Bentonite Revenue Share by Country (2017-2028)
Figure 63. Germany Bentonite Revenue (2017-2028) & (US$ Million)
Figure 64. France Bentonite Revenue (2017-2028) & (US$ Million)
Figure 65. U.K. Bentonite Revenue (2017-2028) & (US$ Million)
Figure 66. Italy Bentonite Revenue (2017-2028) & (US$ Million)
Figure 67. Russia Bentonite Revenue (2017-2028) & (US$ Million)
Figure 68. Asia Pacific Bentonite Sales Market Share by Type (2017-2028)
Figure 69. Asia Pacific Bentonite Revenue Market Share by Type (2017-2028)
Figure 70. Asia Pacific Bentonite Sales Market Share by Application (2017-2028)
Figure 71. Asia Pacific Bentonite Revenue Market Share by Application (2017-2028)
Figure 72. Asia Pacific Bentonite Sales Share by Region (2017-2028)
Figure 73. Asia Pacific Bentonite Revenue Share by Region (2017-2028)
Figure 74. China Bentonite Revenue (2017-2028) & (US$ Million)
Figure 75. Japan Bentonite Revenue (2017-2028) & (US$ Million)
Figure 76. South Korea Bentonite Revenue (2017-2028) & (US$ Million)
Figure 77. India Bentonite Revenue (2017-2028) & (US$ Million)
Figure 78. Australia Bentonite Revenue (2017-2028) & (US$ Million)
Figure 79. Taiwan Bentonite Revenue (2017-2028) & (US$ Million)
Figure 80. Indonesia Bentonite Revenue (2017-2028) & (US$ Million)
Figure 81. Thailand Bentonite Revenue (2017-2028) & (US$ Million)
Figure 82. Malaysia Bentonite Revenue (2017-2028) & (US$ Million)
Figure 83. Philippines Bentonite Revenue (2017-2028) & (US$ Million)
Figure 84. Latin America Bentonite Sales Market Share by Type (2017-2028)
Figure 85. Latin America Bentonite Revenue Market Share by Type (2017-2028)
Figure 86. Latin America Bentonite Sales Market Share by Application (2017-2028)
Figure 87. Latin America Bentonite Revenue Market Share by Application (2017-2028)
Figure 88. Latin America Bentonite Sales Share by Country (2017-2028)
Figure 89. Latin America Bentonite Revenue Share by Country (2017-2028)
Figure 90. Mexico Bentonite Revenue (2017-2028) & (US$ Million)
Figure 91. Brazil Bentonite Revenue (2017-2028) & (US$ Million)
Figure 92. Argentina Bentonite Revenue (2017-2028) & (US$ Million)
Figure 93. Middle East and Africa Bentonite Sales Market Share by Type (2017-2028)
Figure 94. Middle East and Africa Bentonite Revenue Market Share by Type (2017-2028)
Figure 95. Middle East and Africa Bentonite Sales Market Share by Application (2017-2028)
Figure 96. Middle East and Africa Bentonite Revenue Market Share by Application (2017-2028)
Figure 97. Middle East and Africa Bentonite Sales Share by Country (2017-2028)
Figure 98. Middle East and Africa Bentonite Revenue Share by Country (2017-2028)
Figure 99. Turkey Bentonite Revenue (2017-2028) & (US$ Million)
Figure 100. Saudi Arabia Bentonite Revenue (2017-2028) & (US$ Million)
Figure 101. U.A.E Bentonite Revenue (2017-2028) & (US$ Million)
Figure 102. Bentonite Value Chain
Figure 103. Bentonite Production Process
Figure 104. Channels of Distribution
Figure 105. Distributors Profiles
Figure 106. Bottom-up and Top-down Approaches for This Report
Figure 107. Data Triangulation
Figure 108. Key Executives Interviewed
$4900
$9800
HAVE A QUERY?
OUR CUSTOMER
