
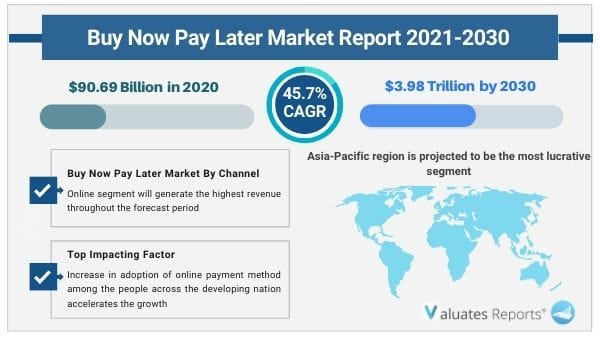
The global buy now pay later market size was valued at US$ 90.69 billion in 2020 and is projected to reach US$ 3.98 trillion by 2030 growing at a Compound Annual Growth Rate (CAGR) of 45.7% from 2021 to 2030. Key drivers of the buy now pay later market include the increasing adoption of online payment methods among the masses and the rise in digital transactions.
Further, the affordability offered and the convenience of buy now pay later platforms will propel the market growth during the forecast period. Moreover, high late and returned payment fees will restrict the market. However, an increase in demand for delayed payments of online purchases and huge spending on luxury products among the adult population will spur the growth of the buy now pay later market.
Online payment methods are gaining popularity, especially in developing countries. Debit cards, credit cards, and mobile payments offer benefits in the form of reduction in transaction costs, faster transaction processing, high payment security, and quick fund transfer are just some of the benefits offered by online payment services leading to wide-scale adoption. In addition to it, growing smartphone usage and increasing internet connectivity options have led to rising digital transactions further aiding in the growth of the market. Thus increasing adoption of online payment methods and the rise in digital transactions will spur the growth of the buy now pay later market during the forecast period.
Buy now pay later platforms provide affordability, convenience, and other numerous benefits to both individuals and retailers. Easy payment through QR code, instant credit transfer, reminding about repayment, monitoring transaction details, and the ability to make secure payments without swiping debit cards are some of the benefits offered to individuals. On the other hand, retailers enjoy revenue in the form of selling lower-priced products at an increased rate and offering installment repayment methods. Thus numerous benefits of buy now pay later platforms is leading to wide-scale adoption thereby propelling the growth of the buy now pay later market during the forecast period.
High late and returned payment fees will restrict the market growth. However, increasing preference for delayed payments and mass consumption of luxury products especially among the youth is expected to bolster the market growth. People are spending heavily on online purchases of luxury items through buy now pay later systems. Thus high payment fees will hinder the growth of the market but growing preference for delayed payments of online purchases will significantly boost the growth of the buy now pay later market during the forecast period.
Based on region, the Asia-pacific segment is expected to provide lucrative opportunities for growth in the buy now pay later market share during the forecast period due to increasing smartphone usage and mass adoption of buy now pay later solutions among the youth.
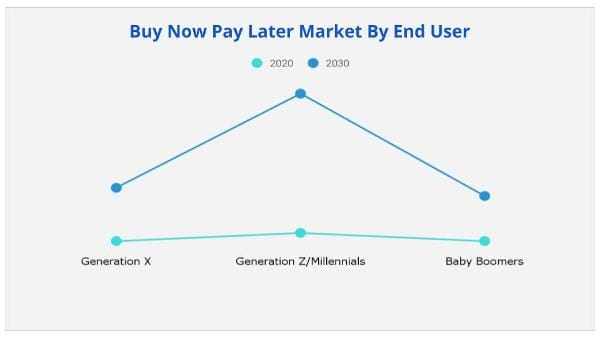
Based on end-user, Generation Z/ Millennials will provide lucrative opportunities for growth in the buy now pay later market share due to mass adoption of online solutions and shopping of expensive clothes and other items. However, Generation X will grow the fastest due to the wide adoption of online payment systems and the variety of offers provided by sellers.
Based on application, the retail goods segment is expected to provide lucrative opportunities for growth in the buy now pay later market share due to increasing spending on daily essential goods and retail stores. However, the healthcare and wellness segment will grow the fastest during the forecast period due to the increasing need to treat various deadly diseases and covid 19 for which people are adopting buy now pay later services across the globe.
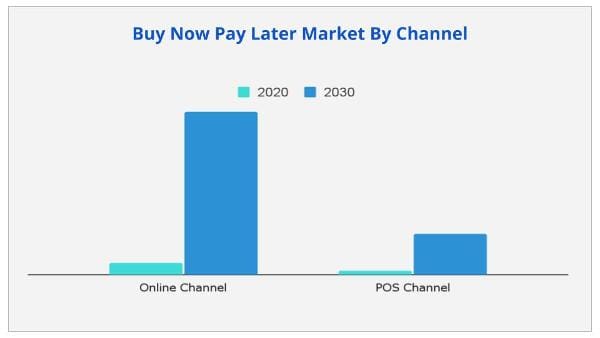
Based on the channel, the online segment will provide lucrative opportunities for growth in the buy now pay later market share.
|
Report Metric |
Details |
|
Base Year: |
2021 |
|
Market Size in 2020: |
USD 90.69 Billion |
|
Forecast Period: |
2021 to 2030 |
|
Forecast Period 2021 to 2030 CAGR: |
45.7% |
|
2030 Value Projection: |
USD 3.98 Trillion |
|
No. of Pages: |
290 |
|
Tables & Figures |
52 |
|
Charts |
32 |
|
Segments covered: |
By Channel, Application, End User, Region |
Ans. The market size of Buy Now Pay Later surpassed USD 90.69 billion in 2020 and will witness a CAGR of over 45.7% from 2021 to 2030
Ans. The Buy Now Pay Later Market is projected to reach $3.98 trillion by 2030.
Ans. The Buy Now Pay Later Market is segmented on the basis of channel, end user, application, and region.
Ans. The key players profiled in the report include Affirm Holdings Inc., Afterpay, Klarna Bank AB, Perpay, Quadpay, and many more.
Ans. Rise in penetration of online payment across the globe and growth in the e-commerce industry in emerging countries etc. boost the Buy Now Pay Later market.
Ans. Asia-Pacific region would grow at a highest CAGR of 47.3% during the forecast period.
Ans. Generation Z/Millennials segment will dominate the market by the end of 2030.
CHAPTER 1: INTRODUCTION
1.1.REPORT DESCRIPTION
1.2.KEY MARKET SEGMENTS
1.3.KEY BENEFITS
1.4.RESEARCH METHODOLOGY
1.4.1.Primary research
1.4.2.Secondary research
1.4.3.Analyst tools and models
CHAPTER 2: EXECUTIVE SUMMARY
2.1.CXO PERSPECTIVE
CHAPTER 3: MARKET LANDSCAPE
3.1.MARKET DEFINITION AND SCOPE
3.2.KEY FINDINGS
3.2.1.Top investment pockets
3.2.2.Top winning strategies
3.3.PORTER'S FIVE FORCES ANALYSIS
3.3.1.Bargaining power of suppliers
3.3.2.Threat of new entrants
3.3.3.Threat of substitutes
3.3.4.Competitive rivalry
3.3.5.Bargaining power among buyers
3.4.MARKET SHARE ANALYSIS/TOP PLAYER POSITIONING 2020
3.5.MARKET DYNAMICS
3.5.1. Drivers
3.5.2. Restraints
3.5.3. Opportunities
3.6.COVID-19 IMPACT ANALYSIS
3.6.1.Impact on buy now pay later market size
3.6.2.Change in end user trends, preferences, and budget impact due to COVID-19
3.6.3.Regulatory framework for solving market challenges faced by buy now pay later providers
3.6.4.Economic impact
3.6.5.Key player strategies to tackle negative impact in the industry
3.6.6.Opportunity analysis
CHAPTER 4: BUY NOW PAY LATER MARKET BY CHANNEL
4.1.OVERVIEW
4.2. ONLINE
4.2.1.Key market trends, growth factors and opportunities
4.2.2.Market size and forecast, by region
4.2.3.Market share analysis, by country
4.3. POS
4.3.1.Key market trends, growth factors and opportunities
4.3.2.Market size and forecast, by region
4.3.3.Market share analysis, by country
CHAPTER 5: BUY NOW PAY LATER MARKET BY APPLICATION
5.1.OVERVIEW
5.2. RETAIL GOODS
5.2.1.Key market trends, growth factors and opportunities
5.2.2.Market size and forecast, by region
5.2.3.Market share analysis, by country
5.3. MEDIA AND ENTERTAINMENT
5.3.1.Key market trends, growth factors and opportunities
5.3.2.Market size and forecast, by region
5.3.3.Market share analysis, by country
5.4. HEALTHCARE AND WELLNESS
5.4.1.Key market trends, growth factors and opportunities
5.4.2.Market size and forecast, by region
5.4.3.Market share analysis, by country
5.5. AUTOMOTIVE
5.5.1.Key market trends, growth factors and opportunities
5.5.2.Market size and forecast, by region
5.5.3.Market share analysis, by country
5.6. HOME IMPROVEMENT
5.6.1.Key market trends, growth factors and opportunities
5.6.2.Market size and forecast, by region
5.6.3.Market share analysis, by country
5.7. OTHERS
5.7.1.Key market trends, growth factors and opportunities
5.7.2.Market size and forecast, by region
5.7.3.Market share analysis, by country
5.8.
5.8.1.Key market trends, growth factors and opportunities
5.8.2.Market size and forecast, by region
5.8.3.Market share analysis, by country
CHAPTER 6: BUY NOW PAY LATER MARKET BY END USER
6.1.OVERVIEW
6.2. GENERATION
6.2.1.Key market trends, growth factors and opportunities
6.2.2.Market size and forecast, by region
6.2.3.Market share analysis, by country
6.3. GENERATION Z MILLENNIALS
6.3.1.Key market trends, growth factors and opportunities
6.3.2.Market size and forecast, by region
6.3.3.Market share analysis, by country
6.4. BABY BOOMERS
6.4.1.Key market trends, growth factors and opportunities
6.4.2.Market size and forecast, by region
6.4.3.Market share analysis, by country
CHAPTER 7: BUY NOW PAY LATER MARKET BY REGION
7.1.OVERVIEW
7.2.NORTH AMERICA
7.2.1.Key market trends and opportunities
7.2.2.Market size and forecast, by channel
7.2.3.Market size and forecast, by application
7.2.4.Market size and forecast, by end user
7.2.5.Market size and forecast, by Country
7.2.6.US
7.2.6.1.Market size and forecast, by channel
7.2.6.2.Market size and forecast, by application
7.2.6.3.Market size and forecast, by end user
7.2.7.Canada
7.2.7.1.Market size and forecast, by channel
7.2.7.2.Market size and forecast, by application
7.2.7.3.Market size and forecast, by end user
7.3.EUROPE
7.3.1.Key market trends and opportunities
7.3.2.Market size and forecast, by channel
7.3.3.Market size and forecast, by application
7.3.4.Market size and forecast, by end user
7.3.5.Market size and forecast, by Country
7.3.6.UK
7.3.6.1.Market size and forecast, by channel
7.3.6.2.Market size and forecast, by application
7.3.6.3.Market size and forecast, by end user
7.3.7.Germany
7.3.7.1.Market size and forecast, by channel
7.3.7.2.Market size and forecast, by application
7.3.7.3.Market size and forecast, by end user
7.3.8.France
7.3.8.1.Market size and forecast, by channel
7.3.8.2.Market size and forecast, by application
7.3.8.3.Market size and forecast, by end user
7.3.9.Italy
7.3.9.1.Market size and forecast, by channel
7.3.9.2.Market size and forecast, by application
7.3.9.3.Market size and forecast, by end user
7.3.10.Rest of Europe
7.3.10.1.Market size and forecast, by channel
7.3.10.2.Market size and forecast, by application
7.3.10.3.Market size and forecast, by end user
7.4.ASIA PACIFIC
7.4.1.Key market trends and opportunities
7.4.2.Market size and forecast, by channel
7.4.3.Market size and forecast, by application
7.4.4.Market size and forecast, by end user
7.4.5.Market size and forecast, by Country
7.4.6.China
7.4.6.1.Market size and forecast, by channel
7.4.6.2.Market size and forecast, by application
7.4.6.3.Market size and forecast, by end user
7.4.7.Japan
7.4.7.1.Market size and forecast, by channel
7.4.7.2.Market size and forecast, by application
7.4.7.3.Market size and forecast, by end user
7.4.8.India
7.4.8.1.Market size and forecast, by channel
7.4.8.2.Market size and forecast, by application
7.4.8.3.Market size and forecast, by end user
7.4.9.Australia
7.4.9.1.Market size and forecast, by channel
7.4.9.2.Market size and forecast, by application
7.4.9.3.Market size and forecast, by end user
7.4.10.South Korea
7.4.10.1.Market size and forecast, by channel
7.4.10.2.Market size and forecast, by application
7.4.10.3.Market size and forecast, by end user
7.4.11.Rest of Asia Pacific
7.4.11.1.Market size and forecast, by channel
7.4.11.2.Market size and forecast, by application
7.4.11.3.Market size and forecast, by end user
7.5.LAMEA
7.5.1.Key market trends and opportunities
7.5.2.Market size and forecast, by channel
7.5.3.Market size and forecast, by application
7.5.4.Market size and forecast, by end user
7.5.5.Market size and forecast, by Country
7.5.6.Latin America
7.5.6.1.Market size and forecast, by channel
7.5.6.2.Market size and forecast, by application
7.5.6.3.Market size and forecast, by end user
7.5.7.Middle East
7.5.7.1.Market size and forecast, by channel
7.5.7.2.Market size and forecast, by application
7.5.7.3.Market size and forecast, by end user
7.5.8.Africa
7.5.8.1.Market size and forecast, by channel
7.5.8.2.Market size and forecast, by application
7.5.8.3.Market size and forecast, by end user
CHAPTER 8: COMPANY PROFILES
8.1. AFFIRM HOLDINGS, INC
8.1.1.Company overview
8.1.2.Key Executives
8.1.3.Company snapshot
8.1.4.Operating business segments
8.1.5.Product portfolio
8.1.6.Business performance
8.1.7.Key strategic moves and developments
8.2. AFTERPAY
8.2.1.Company overview
8.2.2.Key Executives
8.2.3.Company snapshot
8.2.4.Operating business segments
8.2.5.Product portfolio
8.2.6.Business performance
8.2.7.Key strategic moves and developments
8.3. KLARNA BANK AB
8.3.1.Company overview
8.3.2.Key Executives
8.3.3.Company snapshot
8.3.4.Operating business segments
8.3.5.Product portfolio
8.3.6.Business performance
8.3.7.Key strategic moves and developments
8.4. LAYBUY GROUP HOLDINGS LIMITED
8.4.1.Company overview
8.4.2.Key Executives
8.4.3.Company snapshot
8.4.4.Operating business segments
8.4.5.Product portfolio
8.4.6.Business performance
8.4.7.Key strategic moves and developments
8.5. PAYPAL HOLDINGS, INC
8.5.1.Company overview
8.5.2.Key Executives
8.5.3.Company snapshot
8.5.4.Operating business segments
8.5.5.Product portfolio
8.5.6.Business performance
8.5.7.Key strategic moves and developments
8.6. PAYL8R
8.6.1.Company overview
8.6.2.Key Executives
8.6.3.Company snapshot
8.6.4.Operating business segments
8.6.5.Product portfolio
8.6.6.Business performance
8.6.7.Key strategic moves and developments
8.7. PERPAY
8.7.1.Company overview
8.7.2.Key Executives
8.7.3.Company snapshot
8.7.4.Operating business segments
8.7.5.Product portfolio
8.7.6.Business performance
8.7.7.Key strategic moves and developments
8.8. QUADPAY
8.8.1.Company overview
8.8.2.Key Executives
8.8.3.Company snapshot
8.8.4.Operating business segments
8.8.5.Product portfolio
8.8.6.Business performance
8.8.7.Key strategic moves and developments
8.9. SEZZLE
8.9.1.Company overview
8.9.2.Key Executives
8.9.3.Company snapshot
8.9.4.Operating business segments
8.9.5.Product portfolio
8.9.6.Business performance
8.9.7.Key strategic moves and developments
8.10. SPLITIT
8.10.1.Company overview
8.10.2.Key Executives
8.10.3.Company snapshot
8.10.4.Operating business segments
8.10.5.Product portfolio
8.10.6.Business performance
8.10.7.Key strategic moves and developments
Note:
o*Details on financial performance and strategic moves and developments may not be captured for unlisted companies.
o*List of companies profiled in this TOC is tentative and may change after detailed analysis.
o*Market size and forecast will be provided from 2020-2030, and the forecast period would be 2021-2030.
Tables & Figures :
Table 1.Global Buy Now Pay Later Market, By Channel 2020-2030 ($Million)
Table 2.Buy Now Pay Later Market For Online, By Region, 2020-2030 ($Million)
Table 3.Buy Now Pay Later Market For Pos, By Region, 2020-2030 ($Million)
Table 4.Global Buy Now Pay Later Market, By Application 2020-2030 ($Million)
Table 5.Buy Now Pay Later Market For Retail Goods, By Region, 2020-2030 ($Million)
Table 6.Buy Now Pay Later Market For Media And Entertainment, By Region, 2020-2030 ($Million)
Table 7.Buy Now Pay Later Market For Healthcare And Wellness, By Region, 2020-2030 ($Million)
Table 8.Buy Now Pay Later Market For Automotive, By Region, 2020-2030 ($Million)
Table 9.Buy Now Pay Later Market For Home Improvement, By Region, 2020-2030 ($Million)
Table 10.Buy Now Pay Later Market For Others, By Region, 2020-2030 ($Million)
Table 11.Buy Now Pay Later Market For , By Region, 2020-2030 ($Million)
Table 12.Global Buy Now Pay Later Market, By End User 2020-2030 ($Million)
Table 13.Buy Now Pay Later Market For Generation X, By Region, 2020-2030 ($Million)
Table 14.Buy Now Pay Later Market For Generation Z Millennials, By Region, 2020-2030 ($Million)
Table 15.Buy Now Pay Later Market For Baby Boomers, By Region, 2020-2030 ($Million)
Table 16.Buy Now Pay Later Market For , By Region, , 2020-2030 ($Million)
Table 17.North America Buy Now Pay Later , By Channel 2020-2030 ($Million)
Table 18.North America Buy Now Pay Later , By Application 2020-2030 ($Million)
Table 19.North America Buy Now Pay Later , By End User 2020-2030 ($Million)
Table 20.North America Buy Now Pay Later , By Region, 2020-2030 ($Million)
Table 21.Europe Buy Now Pay Later , By Channel 2020-2030 ($Million)
Table 22.Europe Buy Now Pay Later , By Application 2020-2030 ($Million)
Table 23.Europe Buy Now Pay Later , By End User 2020-2030 ($Million)
Table 24.Europe Buy Now Pay Later , By Region, 2020-2030 ($Million)
Table 25.Asia Pacific Buy Now Pay Later , By Channel 2020-2030 ($Million)
Table 26.Asia Pacific Buy Now Pay Later , By Application 2020-2030 ($Million)
Table 27.Asia Pacific Buy Now Pay Later , By End User 2020-2030 ($Million)
Table 28.Asia Pacific Buy Now Pay Later , By Region, 2020-2030 ($Million)
Table 29.Lamea Buy Now Pay Later , By Channel 2020-2030 ($Million)
Table 30.Lamea Buy Now Pay Later , By Application 2020-2030 ($Million)
Table 31.Lamea Buy Now Pay Later , By End User 2020-2030 ($Million)
Table 32.Lamea Buy Now Pay Later , By Region, 2020-2030 ($Million)
Table 33.Affirm Holdings, Inc: Company Snapshot
Table 34.Affirm Holdings, Inc: Operating Segments
Table 35.Afterpay: Company Snapshot
Table 36.Afterpay: Operating Segments
Table 37.Klarna Bank Ab: Company Snapshot
Table 38.Klarna Bank Ab: Operating Segments
Table 39.Laybuy Group Holdings Limited: Company Snapshot
Table 40.Laybuy Group Holdings Limited: Operating Segments
Table 41.Paypal Holdings, Inc: Company Snapshot
Table 42.Paypal Holdings, Inc: Operating Segments
Table 43.Payl8r: Company Snapshot
Table 44.Payl8r: Operating Segments
Table 45.Perpay: Company Snapshot
Table 46.Perpay: Operating Segments
Table 47.Quadpay: Company Snapshot
Table 48.Quadpay: Operating Segments
Table 49.Sezzle : Company Snapshot
Table 50.Sezzle : Operating Segments
Table 51.Splitit: Company Snapshot
Table 52.Splitit: Operating Segments
List Of Figures
Figure 1.Global Buy Now Pay Later Market Segmentation
Figure 2.Top Investment Pocket
Figure 3.Top Winning Strategies (%)
Figure 4.Buy Now Pay Later Market For Online, 2020-2030 ($Million)
Figure 5.Buy Now Pay Later Market For Pos, 2020-2030 ($Million)
Figure 6.Buy Now Pay Later Market For Retail Goods, 2020-2030 ($Million)
Figure 7.Buy Now Pay Later Market For Media And Entertainment, 2020-2030 ($Million)
Figure 8.Buy Now Pay Later Market For Healthcare And Wellness, 2020-2030 ($Million)
Figure 9.Buy Now Pay Later Market For Automotive, 2020-2030 ($Million)
Figure 10.Buy Now Pay Later Market For Home Improvement, 2020-2030 ($Million)
Figure 11.Buy Now Pay Later Market For Others, 2020-2030 ($Million)
Figure 12.Buy Now Pay Later Market For , 2020-2030 ($Million)
Figure 13.Buy Now Pay Later Market For Generation X, 2020-2030 ($Million)
Figure 14.Buy Now Pay Later Market For Generation Z Millennials, 2020-2030 ($Million)
Figure 15.Buy Now Pay Later Market For Baby Boomers, 2020-2030 ($Million)
Figure 16.Global Buy Now Pay Later, By Region, 2020 (%)
Figure 17.Us Buy Now Pay Later Market, 2020-2030 ($Million)
Figure 18.Canada Buy Now Pay Later Market, 2020-2030 ($Million)
Figure 19.Uk Buy Now Pay Later Market, 2020-2030 ($Million)
Figure 20.Germany Buy Now Pay Later Market, 2020-2030 ($Million)
Figure 21.France Buy Now Pay Later Market, 2020-2030 ($Million)
Figure 22.Italy Buy Now Pay Later Market, 2020-2030 ($Million)
Figure 23.Rest Of Europe Buy Now Pay Later Market, 2020-2030 ($Million)
Figure 24.China Buy Now Pay Later Market, 2020-2030 ($Million)
Figure 25.Japan Buy Now Pay Later Market, 2020-2030 ($Million)
Figure 26.India Buy Now Pay Later Market, 2020-2030 ($Million)
Figure 27.Australia Buy Now Pay Later Market, 2020-2030 ($Million)
Figure 28.South Korea Buy Now Pay Later Market, 2020-2030 ($Million)
Figure 29.Rest Of Asia Pacific Buy Now Pay Later Market, 2020-2030 ($Million)
Figure 30.Latin America Buy Now Pay Later Market, 2020-2030 ($Million)
Figure 31.Middle East Buy Now Pay Later Market, 2020-2030 ($Million)
Figure 32.Africa Buy Now Pay Later Market, 2020-2030 ($Million)
$6169
$10665
HAVE A QUERY?
OUR CUSTOMER
