
The global sustainable aviation fuel market was valued at $72.1 million in 2020 and is projected to reach $6,261.9 million by 2030, registering a CAGR of 56.4% from 2021 to 2030. An increase in airline passengers combined with an increase in disposable income, an increase in air travel, and an increase in synthetic lubricant use are all factors that contribute to the long-term expansion of the aviation fuel business. Furthermore, the development of ecologically friendly and safe aircraft lubricants, as well as an increase in demand for low-density lubricants to reduce weight, are expected to present significant chances for the long-term growth of aviation fuel market.
SAF's purpose is to recycle carbon from current sustainable biomass or gases into jet fuel as a replacement for fossil jet fuel refined from petroleum crude oil. SAF's purpose is to recycle carbon from current sustainable biomass or gases into jet fuel as a replacement for fossil jet fuel refined from petroleum crude oil.
The aviation sector as a whole, as well as IATA member airlines, are committed to attaining aggressive emissions reduction targets. SAFs (sustainable aviation fuels) have been identified as a key component in reaching these goals. It will take government support to use sustainable aviation fuels to satisfy the industry's climate goals.
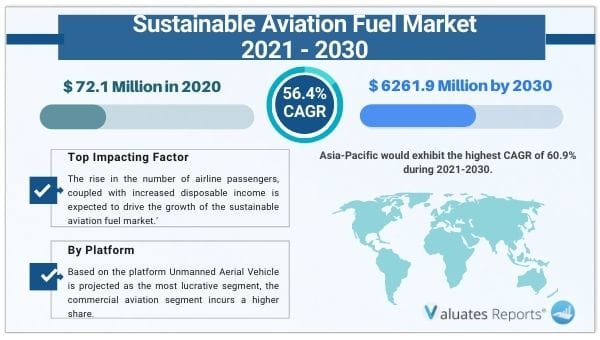
The expansion of the sustainable aviation fuel market is predicted to be fueled by an increase in the number of airline passengers combined with greater disposable income. Most people prefer flying to other modes of transportation since it is the safest, fastest, and most reliable mode of transportation with the fewest flight cancellations. As a result, air travel is more dependable and provides a more enjoyable experience than other kinds of transportation. As a result, the size of the aircraft fleet and the frequency of flights grow, necessitating more efficient fuels and, as a result, boosting the global sustainable aviation fuel market. Customers favor air travel, despite its high cost, because it increases disposable income and reduces travel time.
The expansion of the sustainable aviation fuel market is expected to be aided by an increase in synthetic lubricant use. Thermal stability, greater energy efficiency, improved performance in hard environments, and oxidation resistance are all benefits of synthetic lubricants, all of which contribute to the growth of the sustainable aviation fuel industry. Synthetic lubricants also provide increased resistance to frictional wear of costly aircraft components, as well as a longer lubricant service life, leading the industry toward positive global growth. Furthermore, companies involved in the development of sustainable aircraft fuels have implemented development strategies to deliver improved and highly efficient lubricants, which support the growth of the sustainable aviation fuel market
Biofuels are being used by most airlines, including KLM Royal Dutch Airlines and United Airlines. Used cooking oil is used to create biofuels. Cooking oil that has been discarded is cheap and easy to refine. In California, Aemetis is building carbon-neutral Sustainable Aviation Fuel (SAF) and renewable diesel fuel bio-refineries using renewable oils and orchard and forest waste. Such innovations in the field of aircraft lubricants help to reduce pollution and are expected to open up a slew of new potential prospects for the global sustainable aviation fuel market.
Crude oil price variations, on the other hand, have a direct impact on the production of aviation fuels. As a result, an increase in crude oil prices has a greater impact on airlines, as an average aircraft uses 14 liters of fuel per kilometer, resulting in increased operational expenses. Greater aviation fuel prices, as a result of rising crude oil prices, hinder market expansion for Sustainable Aviation Fuel. kilometer on average, leading to higher operational expenses. As a result of the rise in crude oil prices, higher aviation fuel prices stifle Sustainable Aviation Fuel market expansion.
Power to liquid fuel is projected as the most lucrative segment. The biofuel segment dominated the global sustainable aviation fuel market in 2020, in terms of revenue. Due to substantial advancements in technology approaches to commercializing the use of alternative jet fuel, biofuel production is likely to scale up rapidly in the coming decade.
Based on Aircraft type, others are projected as the most lucrative segments. The fixed wings segment incurs a higher share.
Based on the platform Unmanned Aerial Vehicle is projected as the most lucrative segment, the commercial aviation segment incurs a higher share.
Based on Region Asia-Pacific would exhibit the highest CAGR of 60.9% during 2021-2030. North America is the highest revenue contributor followed by Europe. Due to increased air traffic, countries in North America, such as the United States and Canada, are focusing on various projects to use renewable aviation fuel to meet the requirement for reduced carbon footprints. The North American market is considered to be one of the strongest demand areas for sustainable aviation fuel due to supportive legislation and measures to reduce aviation emissions.
|
Report Metric |
Details |
|
Report Name |
Sustainable Aviation Fuel Market |
|
The Market size value in 2020 |
72.1 Million USD |
|
The Revenue forecast in 2030 |
6261.9 Million USD |
|
Growth Rate |
CAGR of 56.4% from 2021 to 2030 |
|
Base year considered |
2020 |
|
Forecast period |
2021-2030 |
|
Forecast units |
Value (USD) |
|
Segments covered |
Type, End-User, Offerings, and Region |
|
Report coverage |
Revenue & volume forecast, company share, competitive landscape, growth factors, and trends |
|
Geographic regions covered |
North America, Europe, Asia Pacific, Latin America, Middle East & Africa |
|
Companies covered |
Aemetis, Inc., Avfuel Corporation, Fulcrum Bioenergy, Gevo, Lanzatech, Neste, Preem AB, Sasol, SkyNRG, and World Energy. |
Ans. The global sustainable aviation fuel market was valued at $72.1 million in 2020, and is projected to reach $6,261.9 million by 2030, registering a CAGR of 56.4% from 2021 to 2030.
Ans. The global sustainable aviation fuel market is expected to grow at a compound annual growth rate of 56.4% from 2021 to 2030.
Ans. The key players profiled in global sustainable aviation fuel market includes Aemetis, Inc., Avfuel Corporation, Fulcrum Bioenergy, Gevo, Lanzatech, Neste, Preem AB, Sasol, SkyNRG, and World Energy.
CHAPTER 1:INTRODUCTION
1.1.Report description
1.2.Key benefits for stakeholders
1.3.Key market segments
1.4.Research methodology
1.4.1.Primary research
1.4.2.Secondary research
1.4.3.Analyst tools and models
CHAPTER 2:EXECUTIVE SUMMARY
2.1.CXO perspective
CHAPTER 3:MARKET OVERVIEW
3.1.Market definition and scope
3.2.Key findings
3.2.1.Top impacting factors
3.2.2.Top investment pockets
3.2.3.Top winning strategies
3.3.Porter’s five forces analysis
3.3.1.Low-to-high bargaining power of suppliers
3.3.2.High threat of new entrants
3.3.3.Low-to-high threat of substitutes
3.3.4.Moderate-to-high intensity of rivalry
3.3.5.Moderate-to-high bargaining power of buyers
3.4.Key player positioning, 2020
3.5.Market dynamics
3.5.1.Drivers
3.5.1.1.Rise in number of airline passengers, coupled with increased disposable income
3.5.1.2.Increase in air transportation
3.5.1.3.Increase in consumption of synthetic lubricants
3.5.2.Restraints
3.5.2.1.Fluctuations in crude oil prices
3.5.2.2.Contamination of lubricants
3.5.3.Opportunities
3.5.3.1.Development of ecofriendly and safe aviation lubricants
3.5.3.2.Rise in demand for low density lubricants for reduced weight
3.6.Impact of COVID-19 on the market
3.6.1.Evolution of outbreaks
3.6.1.1.SARS
3.6.1.2.COVID-19
3.6.2.Micro-economic impact analysis
3.6.2.1.Consumer trend
3.6.2.2.Technology trends
3.6.2.3.Regulatory trend
3.6.3.Macro-economic impact analysis
3.6.3.1.GDP
3.6.3.2.Import/export analysis
3.6.3.3.Employment index
3.6.4.Impact on the aviation industry analysis
3.7.Competitive landscape
3.7.1.Competitive dashboard
3.7.2.Competitive heatmap
CHAPTER 4:SUSTAINABLE AVIATION FUEL MARKET, BY FUEL TYPE
4.1.Overview
4.2.Biofuel
4.2.1.Key market trends, growth factors and opportunities
4.2.2.Market size and forecast, by region
4.2.3.Market analysis by country
4.3.Hydrogen fuel
4.3.1.Key market trends, growth factors and opportunities
4.3.2.Market size and forecast, by region
4.3.3.Market analysis by country
4.4.Power to liquid fuel
4.4.1.Key market trends, growth factors and opportunities
4.4.2.Market size and forecast, by region
4.4.3.Market analysis by country
CHAPTER 5:SUSTAINABLE AVIATION FUEL MARKET, BY AIRCRAFT TYPE
5.1.Overview
5.2.Fixed Wings
5.2.1.Key market trends, growth factors and opportunities
5.2.2.Market size and forecast, by region
5.2.3.Market size and forecast, for fixed wings by fuel type
5.2.4.Market analysis by country
5.3.Rotorcraft
5.3.1.Key market trends, growth factors and opportunities
5.3.2.Market size and forecast, by region
5.3.3.Market size and forecast, for rotorcraft by fuel type
5.3.4.Market analysis by country
5.4.Others
5.4.1.Key market trends, growth factors and opportunities
5.4.2.Market size and forecast, by region
5.4.3.Market size and forecast, for others by fuel type
5.4.4.Market analysis by country
CHAPTER 6:SUSTAINABLE AVIATION FUEL MARKET, BY PLATFORM
6.1.Overview
6.2.Commercial aviation
6.2.1.Key market trends, growth factors and opportunities
6.2.2.Market size and forecast, by region
6.2.3.Market analysis by country
6.3.Military aviation
6.3.1.Key market trends, growth factors and opportunities
6.3.2.Market size and forecast, by region
6.3.3.Market analysis by country
6.4.Business & general aviation
6.4.1.Key market trends, growth factors and opportunities
6.4.2.Market size and forecast, by region
6.4.3.Market analysis by country
6.5.Unmanned aerial vehicle
6.5.1.Key market trends, growth factors and opportunities
6.5.2.Market size and forecast, by region
6.5.3.Market analysis by country
CHAPTER 7:SUSTAINABLE AVIATION FUEL MARKET, BY REGION
7.1.Overview
7.2.North America
7.2.1.Key market trends, growth factors, and opportunities
7.2.2.Market size and forecast, by fuel type
7.2.3.Market size and forecast, by aircraft type
7.2.4.North America Fixed Wings Sustainable Aviation Fuel Market, by fuel type
7.2.5.North America Rotorcraft Sustainable Aviation Fuel Market, by fuel type
7.2.6.North America Others Sustainable Aviation Fuel Market, by fuel type
7.2.7.Market size and forecast, by platform
7.2.8.Market analysis by country
7.2.8.1.U.S.
7.2.8.1.1.Market size and forecast, by fuel Type
7.2.8.1.2.Market size and forecast, by aircraft type
7.2.8.1.3.Market size and forecast, by platform
7.2.8.2.Canada
7.2.8.2.1.Market size and forecast, by fuel Type
7.2.8.2.2.Market size and forecast, by aircraft type
7.2.8.2.3.Market size and forecast, by platform
7.2.8.3.Mexico
7.2.8.3.1.Market size and forecast, by fuel Type
7.2.8.3.2.Market size and forecast, by aircraft type
7.2.8.3.3.Market size and forecast, by platform
7.3.Europe
7.3.1.Key market trends, growth factors, and opportunities
7.3.2.Market size and forecast, by fuel type
7.3.3.Market size and forecast, by aircraft type
7.3.4.Europe Fixed Wings Sustainable Aviation Fuel Market, by fuel type
7.3.5.Europe Rotorcraft Sustainable Aviation Fuel Market, by fuel type
7.3.6.Europe Others Sustainable Aviation Fuel Market, by fuel type
7.3.7.Market size and forecast, by platform
7.3.8.Market analysis by country
7.3.8.1.UK
7.3.8.1.1.Market size and forecast, by fuel Type
7.3.8.1.2.Market size and forecast, by aircraft type
7.3.8.1.3.Market size and forecast, by platform
7.3.8.2.Germany
7.3.8.2.1.Market size and forecast, by fuel Type
7.3.8.2.2.Market size and forecast, by aircraft type
7.3.8.2.3.Market size and forecast, by platform
7.3.8.3.France
7.3.8.3.1.Market size and forecast, by fuel Type
7.3.8.3.2.Market size and forecast, by aircraft type
7.3.8.3.3.Market size and forecast, by platform
7.3.8.4.Russia
7.3.8.4.1.Market size and forecast, by fuel type
7.3.8.4.2.Market size and forecast, by aircraft type
7.3.8.4.3.Market size and forecast, by platform
7.3.8.5.Rest of Europe
7.3.8.5.1.Market size and forecast, by fuel Type
7.3.8.5.2.Market size and forecast, by aircraft type
7.3.8.5.3.Market size and forecast, by platform
7.4.Asia-Pacific
7.4.1.Key market trends, growth factors, and opportunities
7.4.2.Market size and forecast, by fuel type
7.4.3.Market size and forecast, by aircraft type
7.4.4.Asia-Pacific Fixed Wings Sustainable Aviation Fuel Market, by fuel type
7.4.5.Asia-Pacific Rotorcraft Sustainable Aviation Fuel Market, by fuel type
7.4.6.Asia-Pacific Others Sustainable Aviation Fuel Market, by fuel type
7.4.7.Market size and forecast, by platform
7.4.8.Market analysis by country
7.4.8.1.China
7.4.8.1.1.Market size and forecast, by fuel Type
7.4.8.1.2.Market size and forecast, by aircraft type
7.4.8.1.3.Market size and forecast, by platform
7.4.8.2.Japan
7.4.8.2.1.Market size and forecast, by fuel Type
7.4.8.2.2.Market size and forecast, by aircraft type
7.4.8.2.3.Market size and forecast, by platform
7.4.8.3.India
7.4.8.3.1.Market size and forecast, by fuel Type
7.4.8.3.2.Market size and forecast, by aircraft type
7.4.8.3.3.Market size and forecast, by platform
7.4.8.4.South Korea
7.4.8.4.1.Market size and forecast, by fuel Type
7.4.8.4.2.Market size and forecast, by aircraft type
7.4.8.4.3.Market size and forecast, by platform
7.4.8.5.Rest of Asia-Pacific
7.4.8.5.1.Market size and forecast, by fuel Type
7.4.8.5.2.Market size and forecast, by aircraft type
7.4.8.5.3.Market size and forecast, by platform
7.5.LAMEA
7.5.1.Key market trends, growth factors, and opportunities
7.5.2.Market size and forecast, by fuel type
7.5.3.Market size and forecast, by aircraft type
7.5.4.LAMEA Fixed Wings Sustainable Aviation Fuel Market, by fuel type
7.5.5.LAMEA Rotorcraft Sustainable Aviation Fuel Market, by fuel type
7.5.6.LAMEA Others Sustainable Aviation Fuel Market, by fuel type
7.5.7.Market size and forecast, by platform
7.5.8.Market analysis by country
7.5.8.1.Latin America
7.5.8.1.1.Market size and forecast, by fuel Type
7.5.8.1.2.Market size and forecast, by aircraft type
7.5.8.1.3.Market size and forecast, by platform
7.5.8.2.Middle East
7.5.8.2.1.Market size and forecast, by fuel Type
7.5.8.2.2.Market size and forecast, by aircraft type
7.5.8.2.3.Market size and forecast, by platform
7.5.8.3.Africa
7.5.8.3.1.Market size and forecast, by fuel Type
7.5.8.3.2.Market size and forecast, by aircraft type
7.5.8.3.3.Market size and forecast, by platform
CHAPTER 8:COMPANY PROFILES
8.1.Aemetis
8.1.1.Company overview
8.1.2.Company snapshot
8.1.3.Product portfolio
8.1.4.Business performance
8.1.5.Key strategic moves and developments
8.2.Avfuel Corporation
8.2.1.Company overview
8.2.2.Company snapshot
8.2.3.Product portfolio
8.2.4.Key strategic moves and developments
8.3.Fulcrum Bioenergy
8.3.1.Company overview
8.3.2.Company snapshot
8.3.3.Product portfolio
8.3.4.Key strategic moves and developments
8.4.Gevo
8.4.1.Company overview
8.4.2.Company snapshot
8.4.3.Operating business segments
8.4.4.Product portfolio
8.4.5.Business performance
8.4.6.Key strategic moves and developments
8.5.LANZATECH
8.5.1.Company overview
8.5.2.Company snapshot
8.5.3.Product portfolio
8.6.Neste
8.6.1.Company overview
8.6.2.Company snapshot
8.6.3.Operating business segments
8.6.4.Product portfolio
8.6.5.Business performance
8.6.6.Key strategic moves and developments
8.7.Preem AB
8.7.1.Company overview
8.7.2.Company snapshot
8.7.3.Product portfolio
8.8.Sasol
8.8.1.Company overview
8.8.2.Company snapshot
8.8.3.Product portfolio
8.8.4.Key strategic moves and developments
8.9.SkyNRG
8.9.1.Company overview
8.9.2.Company snapshot
8.9.3.Product portfolio
8.9.4.Key strategic moves and developments
8.10.World Energy
8.10.1.Company overview
8.10.2.Company snapshot
8.10.3.Product portfolio
8.10.4.Key strategic moves and developments
LIST OF TABLES
TABLE 01.GLOBAL SUSTAINABLE AVIATION FUEL MARKET, BY FUEL TYPE, 2020-2030 ($MILLION)
TABLE 02.SUSTAINABLE AVIATION FUEL MARKET REVENUE FOR BIOFUEL, BY REGION 2020–2030 ($MILLION)
TABLE 03.SUSTAINABLE AVIATION FUEL MARKET REVENUE FOR HYDROGEN FUEL, BY REGION 2020–2030 ($MILLION)
TABLE 04.SUSTAINABLE AVIATION FUEL MARKET REVENUE FOR POWER TO LIQUID FUEL, BY REGION 2020–2030 ($MILLION)
TABLE 05.GLOBAL SUSTAINABLE AVIATION FUEL MARKET, BY AIRCRAFT TYPE, 2020-2030 ($MILLION)
TABLE 06.SUSTAINABLE AVIATION FUEL MARKET REVENUE FOR FIXED WINGS, BY REGION 2020–2030 ($MILLION)
TABLE 07.SUSTAINABLE AVIATION FUEL MARKET REVENUE FOR FIXED WINGS, BY FUEL TYPE 2020–2030 ($MILLION)
TABLE 08.SUSTAINABLE AVIATION FUEL MARKET REVENUE FOR ROTORCRAFT, BY REGION 2020–2030 ($MILLION)
TABLE 09.SUSTAINABLE AVIATION FUEL MARKET REVENUE FOR ROTORCRAFT, BY FUEL TYPE 2020–2030 ($MILLION)
TABLE 10.SUSTAINABLE AVIATION FUEL MARKET REVENUE FOR OTHERS, BY REGION 2020–2030 ($MILLION)
TABLE 11.SUSTAINABLE AVIATION FUEL MARKET REVENUE FOR OTHERS, BY FUEL TYPE 2020–2030 ($MILLION)
TABLE 12.GLOBAL SUSTAINABLE AVIATION FUEL MARKET, BY PLATFORM, 2020-2030 ($MILLION)
TABLE 13.SUSTAINABLE AVIATION FUEL MARKET REVENUE FOR COMMERCIAL AVIATION, BY REGION 2020–2030 ($MILLION)
TABLE 14.SUSTAINABLE AVIATION FUEL MARKET REVENUE FOR MILITARY AVIATION, BY REGION 2020–2030 ($MILLION)
TABLE 15.SUSTAINABLE AVIATION FUEL MARKET REVENUE FOR BUSINESS & GENERAL AVIATION, BY REGION 2020–2030 ($MILLION)
TABLE 16.SUSTAINABLE AVIATION FUEL MARKET REVENUE FOR UNMANNED AERIAL VEHICLE, BY REGION 2020–2030 ($MILLION)
TABLE 17.NORTH AMERICA SUSTAINABLE AVIATION FUEL MARKET, BY FUEL TYPE, 2020–2030 ($MILLION)
TABLE 18.NORTH AMERICA SUSTAINABLE AVIATION FUEL MARKET, BY AIRCRAFT TYPE, 2020–2030 ($MILLION)
TABLE 19.NORTH AMERICA FIXED WINGS SUSTAINABLE AVIATION FUEL MARKET, BY FUEL TYPE, 2020–2030 ($MILLION)
TABLE 20.NORTH AMERICA ROTORCRAFT SUSTAINABLE AVIATION FUEL MARKET, BY FUEL TYPE, 2020–2030 ($MILLION)
TABLE 21.NORTH AMERICA OTHERS SUSTAINABLE AVIATION FUEL MARKET, BY FUEL TYPE, 2020–2030 ($MILLION)
TABLE 22.NORTH AMERICA SUSTAINABLE AVIATION FUEL MARKET, BY PLATFORM, 2020–2030 ($MILLION)
TABLE 23.U.S. SUSTAINABLE AVIATION FUEL MARKET, BY FUEL TYPE, 2020–2030 ($MILLION)
TABLE 24.U.S. SUSTAINABLE AVIATION FUEL MARKET, BY AIRCRAFT TYPE, 2020–2030 ($MILLION)
TABLE 25.U.S. SUSTAINABLE AVIATION FUEL MARKET, BY PLATFORM, 2020–2030 ($MILLION)
TABLE 26.CANADA SUSTAINABLE AVIATION FUEL MARKET, BY FUEL TYPE, 2020–2030 ($MILLION)
TABLE 27.CANADA SUSTAINABLE AVIATION FUEL MARKET, BY AIRCRAFT TYPE, 2020–2030 ($MILLION)
TABLE 28.CANADA SUSTAINABLE AVIATION FUEL MARKET, BY PLATFORM, 2020–2030 ($MILLION)
TABLE 29.MEXICO SUSTAINABLE AVIATION FUEL MARKET, BY FUEL TYPE, 2020–2030 ($MILLION)
TABLE 30.MEXICO SUSTAINABLE AVIATION FUEL MARKET, BY AIRCRAFT TYPE, 2020–2030 ($MILLION)
TABLE 31.MEXICO SUSTAINABLE AVIATION FUEL MARKET, BY PLATFORM, 2020–2030 ($MILLION)
TABLE 32.EUROPE SUSTAINABLE AVIATION FUEL MARKET, BY FUEL TYPE, 2020–2030 ($MILLION)
TABLE 33.EUROPE SUSTAINABLE AVIATION FUEL MARKET, BY AIRCRAFT TYPE, 2020–2030 ($MILLION)
TABLE 34.EUROPE FIXED WINGS SUSTAINABLE AVIATION FUEL MARKET, BY FUEL TYPE, 2020–2030 ($MILLION)
TABLE 35.EUROPE ROTORCRAFT SUSTAINABLE AVIATION FUEL MARKET, BY FUEL TYPE, 2020–2030 ($MILLION)
TABLE 36.EUROPE OTHERS SUSTAINABLE AVIATION FUEL MARKET, BY FUEL TYPE, 2020–2030 ($MILLION)
TABLE 37.EUROPE SUSTAINABLE AVIATION FUEL MARKET, BY PLATFORM, 2020–2030 ($MILLION)
TABLE 38.UK SUSTAINABLE AVIATION FUEL MARKET, BY FUEL TYPE, 2020–2030 ($MILLION)
TABLE 39.UK SUSTAINABLE AVIATION FUEL MARKET, BY AIRCRAFT TYPE, 2020–2030 ($MILLION)
TABLE 40.UK SUSTAINABLE AVIATION FUEL MARKET, BY PLATFORM, 2020–2030 ($MILLION)
TABLE 41.GERMANY SUSTAINABLE AVIATION FUEL MARKET, BY FUEL TYPE, 2020–2030 ($MILLION)
TABLE 42.GERMANY SUSTAINABLE AVIATION FUEL MARKET, BY AIRCRAFT TYPE, 2020–2030 ($MILLION)
TABLE 43.GERMANY SUSTAINABLE AVIATION FUEL MARKET, BY PLATFORM, 2020–2030 ($MILLION)
TABLE 44.FRANCE SUSTAINABLE AVIATION FUEL MARKET, BY FUEL TYPE, 2020–2030 ($MILLION)
TABLE 45.FRANCE SUSTAINABLE AVIATION FUEL MARKET, BY AIRCRAFT TYPE, 2020–2030 ($MILLION)
TABLE 46.FRANCE SUSTAINABLE AVIATION FUEL MARKET, BY PLATFORM, 2020–2030 ($MILLION)
TABLE 47.RUSSIA SUSTAINABLE AVIATION FUEL MARKET, BY FUEL TYPE, 2020–2030 ($MILLION)
TABLE 48.RUSSIA SUSTAINABLE AVIATION FUEL MARKET, BY AIRCRAFT TYPE, 2020–2030 ($MILLION)
TABLE 49.RUSSIA SUSTAINABLE AVIATION FUEL MARKET, BY PLATFORM, 2020–2030 ($MILLION)
TABLE 50.REST OF EUROPE SUSTAINABLE AVIATION FUEL MARKET, BY FUEL TYPE, 2020–2030 ($MILLION)
TABLE 51.REST OF EUROPE SUSTAINABLE AVIATION FUEL MARKET, BY AIRCRAFT TYPE, 2020–2030 ($MILLION)
TABLE 52.REST OF EUROPE SUSTAINABLE AVIATION FUEL MARKET, BY PLATFORM, 2020–2030 ($MILLION)
TABLE 53.ASIA-PACIFIC SUSTAINABLE AVIATION FUEL MARKET, BY FUEL TYPE, 2020–2030 ($MILLION)
TABLE 54.ASIA-PACIFIC SUSTAINABLE AVIATION FUEL MARKET, BY AIRCRAFT TYPE, 2020–2030 ($MILLION)
TABLE 55.ASIA-PACIFIC FIXED WINGS SUSTAINABLE AVIATION FUEL MARKET, BY FUEL TYPE, 2020–2030 ($MILLION)
TABLE 56.ASIA-PACIFIC ROTORCRAFT SUSTAINABLE AVIATION FUEL MARKET, BY FUEL TYPE, 2020–2030 ($MILLION)
TABLE 57.ASIA-PACIFIC OTHERS SUSTAINABLE AVIATION FUEL MARKET, BY FUEL TYPE, 2020–2030 ($MILLION)
TABLE 58.ASIA-PACIFIC SUSTAINABLE AVIATION FUEL MARKET, BY PLATFORM, 2020–2030 ($MILLION)
TABLE 59.CHINA SUSTAINABLE AVIATION FUEL MARKET, BY FUEL TYPE, 2020–2030 ($MILLION)
TABLE 60.CHINA SUSTAINABLE AVIATION FUEL MARKET, BY AIRCRAFT TYPE, 2020–2030 ($MILLION)
TABLE 61.CHINA SUSTAINABLE AVIATION FUEL MARKET, BY PLATFORM, 2020–2030 ($MILLION)
TABLE 62.JAPAN SUSTAINABLE AVIATION FUEL MARKET, BY FUEL TYPE, 2020–2030 ($MILLION)
TABLE 63.JAPAN SUSTAINABLE AVIATION FUEL MARKET, BY AIRCRAFT TYPE, 2020–2030 ($MILLION)
TABLE 64.JAPAN SUSTAINABLE AVIATION FUEL MARKET, BY PLATFORM, 2020–2030 ($MILLION)
TABLE 65.INDIA SUSTAINABLE AVIATION FUEL MARKET, BY FUEL TYPE, 2020–2030 ($MILLION)
TABLE 66.INDIA SUSTAINABLE AVIATION FUEL MARKET, BY AIRCRAFT TYPE, 2020–2030 ($MILLION)
TABLE 67.INDIA SUSTAINABLE AVIATION FUEL MARKET, BY PLATFORM, 2020–2030 ($MILLION)
TABLE 68.SOUTH KOREA SUSTAINABLE AVIATION FUEL MARKET, BY FUEL TYPE, 2020–2030 ($MILLION)
TABLE 69.SOUTH KOREA SUSTAINABLE AVIATION FUEL MARKET, BY AIRCRAFT TYPE, 2020–2030 ($MILLION)
TABLE 70.SOUTH KOREA SUSTAINABLE AVIATION FUEL MARKET, BY PLATFORM, 2020–2030 ($MILLION)
TABLE 71.REST OF ASIA-PACIFIC SUSTAINABLE AVIATION FUEL MARKET, BY FUEL TYPE, 2020–2030 ($MILLION)
TABLE 72.REST OF ASIA-PACIFIC SUSTAINABLE AVIATION FUEL MARKET, BY AIRCRAFT TYPE, 2020–2030 ($MILLION)
TABLE 73.REST OF ASIA-PACIFIC SUSTAINABLE AVIATION FUEL MARKET, BY PLATFORM, 2020–2030 ($MILLION)
TABLE 74.LAMEA SUSTAINABLE AVIATION FUEL MARKET, BY FUEL TYPE, 2020–2030 ($MILLION)
TABLE 75.LAMEA SUSTAINABLE AVIATION FUEL MARKET, BY AIRCRAFT TYPE, 2020–2030 ($MILLION)
TABLE 76.LAMEA FIXED WINGS SUSTAINABLE AVIATION FUEL MARKET, BY FUEL TYPE, 2020–2030 ($MILLION)
TABLE 77.LAMEA ROTORCRAFT SUSTAINABLE AVIATION FUEL MARKET, BY FUEL TYPE, 2020–2030 ($MILLION)
TABLE 78.LAMEA OTHERS SUSTAINABLE AVIATION FUEL MARKET, BY FUEL TYPE, 2020–2030 ($MILLION)
TABLE 79.LAMEA SUSTAINABLE AVIATION FUEL MARKET, BY PLATFORM, 2020–2030 ($MILLION)
TABLE 80.LATIN AMERICA SUSTAINABLE AVIATION FUEL MARKET, BY FUEL TYPE, 2020–2030 ($MILLION)
TABLE 81.LATIN AMERICA SUSTAINABLE AVIATION FUEL MARKET, BY AIRCRAFT TYPE, 2020–2030 ($MILLION)
TABLE 82.LATIN AMERICA SUSTAINABLE AVIATION FUEL MARKET, BY PLATFORM, 2020–2030 ($MILLION)
TABLE 83.MIDDLE EAST SUSTAINABLE AVIATION FUEL MARKET, BY FUEL TYPE, 2020–2030 ($MILLION)
TABLE 84.MIDDLE EAST SUSTAINABLE AVIATION FUEL MARKET, BY AIRCRAFT TYPE, 2020–2030 ($MILLION)
TABLE 85.MIDDLE EAST SUSTAINABLE AVIATION FUEL MARKET, BY PLATFORM, 2020–2030 ($MILLION)
TABLE 86.AFRICA SUSTAINABLE AVIATION FUEL MARKET, BY FUEL TYPE, 2020–2030 ($MILLION)
TABLE 87.AFRICA SUSTAINABLE AVIATION FUEL MARKET, BY AIRCRAFT TYPE, 2020–2030 ($MILLION)
TABLE 88.AFRICA SUSTAINABLE AVIATION FUEL MARKET, BY PLATFORM, 2020–2030 ($MILLION)
TABLE 89.AEMETIS: COMPANY SNAPSHOT
TABLE 90.AEMETIS: PRODUCT PORTFOLIO
TABLE 91.KEY STRATEGIC MOVES AND DEVELOPMENTS
TABLE 92.AVFUEL CORPORATION: COMPANY SNAPSHOT
TABLE 93.AVFUEL CORPORATION: PRODUCT PORTFOLIO
TABLE 94.KEY STRATEGIC MOVES AND DEVELOPMENTS
TABLE 95.FULCRUM BIOENERGY: COMPANY SNAPSHOT
TABLE 96.FULCRUM BIOENERGY: PRODUCT PORTFOLIO
TABLE 97.FULCRUM BIOENERGY: KEY STRATEGIC MOVES AND DEVELOPMENTS
TABLE 98.GEVO: COMPANY SNAPSHOT
TABLE 99.GEVO: OPERATING SEGMENTS
TABLE 100.GEVO: PRODUCT PORTFOLIO
TABLE 101.GEVO: KEY STRATEGIC MOVES AND DEVELOPMENTS
TABLE 102.LANZATECH: COMPANY SNAPSHOT
TABLE 103.LANZATECH: PRODUCT PORTFOLIO
TABLE 104.NESTE: COMPANY SNAPSHOT
TABLE 105.NESTE: OPERATING SEGMENTS
TABLE 106.NESTE: PRODUCT PORTFOLIO
TABLE 107.NESTE: KEY STRATEGIC MOVES AND DEVELOPMENTS
TABLE 108.PREEM AB: COMPANY SNAPSHOT
TABLE 109.PREEM AB: PRODUCT PORTFOLIO
TABLE 110.SASOL: COMPANY SNAPSHOT
TABLE 111.SASOL: PRODUCT PORTFOLIO
TABLE 112.SASOL: KEY STRATEGIC MOVES AND DEVELOPMENTS
TABLE 113.SKYNRG: COMPANY SNAPSHOT
TABLE 114.SKYNRG: PRODUCT PORTFOLIO
TABLE 115.SKYNRG: KEY STRATEGIC MOVES AND DEVELOPMENTS
TABLE 116.WORLD ENERGY: COMPANY SNAPSHOT
TABLE 117.WORLD ENERGY: PRODUCT PORTFOLIO
TABLE 118.WORLD ENERGY: KEY STRATEGIC MOVES AND DEVELOPMENTS
LIST OF FIGURES
FIGURE 01.KEY MARKET SEGMENTS
FIGURE 02.EXECUTIVE SUMMARY
FIGURE 03.EXECUTIVE SUMMARY
FIGURE 04.TOP IMPACTING FACTORS
FIGURE 05.TOP INVESTMENT POCKETS
FIGURE 06.TOP WINNING STRATEGIES, BY YEAR, 2018-2021*
FIGURE 07.TOP WINNING STRATEGIES, BY DEVELOPMENT, 2018-2021*
FIGURE 08.TOP WINNING STRATEGIES, BY COMPANY, 2018-2021*
FIGURE 09.KEY PLAYER POSITIONING, 2020 (%)
FIGURE 10.MACRO-ECONOMIC INDICATORS PROJECTIONS (1/2):
FIGURE 11.MACRO-ECONOMIC INDICATORS PROJECTIONS (2/2):
FIGURE 12.COMPETITIVE DASHBOARD OF TOP 10 KEY PLAYERS (1/2)
FIGURE 13.COMPETITIVE DASHBOARD OF TOP 10 KEY PLAYERS (2/2)
FIGURE 14.COMPETITIVE HEATMAP OF TOP 10 KEY PLAYERS
FIGURE 15.GLOBAL SUSTAINABLE AVIATION FUEL MARKET, BY FUEL TYPE, 2020-2030
FIGURE 16.COMPARATIVE SHARE ANALYSIS OF SUSTAINABLE AVIATION FUEL MARKET FOR BIOFUEL, BY COUNTRY, 2020 & 2030 ($MILLON)
FIGURE 17.COMPARATIVE SHARE ANALYSIS OF SUSTAINABLE AVIATION FUEL MARKET FOR HYDROGEN FUEL, BY COUNTRY, 2020 & 2030 ($MILLON)
FIGURE 18.COMPARATIVE SHARE ANALYSIS OF SUSTAINABLE AVIATION FUEL MARKET FOR POWER TO LIQUID FUEL, BY COUNTRY, 2020 & 2030 ($MILLON)
FIGURE 19.GLOBAL SUSTAINABLE AVIATION FUEL MARKET, BY AIRCRAFT TYPE, 2020-2030
FIGURE 20.COMPARATIVE SHARE ANALYSIS OF SUSTAINABLE AVIATION FUEL MARKET FOR FIXED WINGS, BY COUNTRY, 2020 & 2030 ($MILLON)
FIGURE 21.COMPARATIVE SHARE ANALYSIS OF SUSTAINABLE AVIATION FUEL MARKET FOR ROTORCRAFT, BY COUNTRY, 2020 & 2030 ($MILLON)
FIGURE 22.COMPARATIVE SHARE ANALYSIS OF SUSTAINABLE AVIATION FUEL MARKET FOR OTHERS, BY COUNTRY, 2020 & 2030 ($MILLON)
FIGURE 23.GLOBAL SUSTAINABLE AVIATION FUEL MARKET, BY PLATFORM, 2020-2030
FIGURE 24.COMPARATIVE SHARE ANALYSIS OF SUSTAINABLE AVIATION FUEL MARKET FOR COMMERCIAL AVIATION, BY COUNTRY, 2020 & 2030 ($MILLON)
FIGURE 25.COMPARATIVE SHARE ANALYSIS OF SUSTAINABLE AVIATION FUEL MARKET FOR MILITARY AVIATION, BY COUNTRY, 2020 & 2030 ($MILLON)
FIGURE 26.COMPARATIVE SHARE ANALYSIS OF SUSTAINABLE AVIATION FUEL MARKET FOR BUSINESS & GENERAL AVIATION, BY COUNTRY, 2020 & 2030 ($MILLON)
FIGURE 27.COMPARATIVE SHARE ANALYSIS OF SUSTAINABLE AVIATION FUEL MARKET FOR UNMANNED AERIAL VEHICLE, BY COUNTRY, 2020 & 2030 ($MILLON)
FIGURE 28.SUSTAINABLE AVIATION FUEL MARKET, BY REGION, 2020-2030 (%)
FIGURE 29.COMPARATIVE SHARE ANALYSIS OF SUSTAINABLE AVIATION FUEL MARKET, BY COUNTRY, 2020–2030 (%)
FIGURE 30.U.S. SUSTAINABLE AVIATION FUEL MARKET, 2020–2030 ($MILLION)
FIGURE 31.CANADA SUSTAINABLE AVIATION FUEL MARKET, 2020–2030 ($MILLION)
FIGURE 32.MEXICO SUSTAINABLE AVIATION FUEL MARKET, 2020–2030 ($MILLION)
FIGURE 33.COMPARATIVE SHARE ANALYSIS OF SUSTAINABLE AVIATION FUEL MARKET, BY COUNTRY, 2020–2030 (%)
FIGURE 34.UK SUSTAINABLE AVIATION FUEL MARKET, 2020–2030 ($MILLION)
FIGURE 35.GERMANY SUSTAINABLE AVIATION FUEL MARKET, 2020–2030 ($MILLION)
FIGURE 36.FRANCE SUSTAINABLE AVIATION FUEL MARKET, 2020–2030 ($MILLION)
FIGURE 37.RUSSIA SUSTAINABLE AVIATION FUEL MARKET, 2020–2030 ($MILLION)
FIGURE 38.REST OF EUROPE SUSTAINABLE AVIATION FUEL MARKET, 2020–2030 ($MILLION)
FIGURE 39.COMPARATIVE SHARE ANALYSIS OF SUSTAINABLE AVIATION FUEL MARKET, BY COUNTRY, 2020–2030 (%)
FIGURE 40.CHINA SUSTAINABLE AVIATION FUEL MARKET, 2020–2030 ($MILLION)
FIGURE 41.JAPAN SUSTAINABLE AVIATION FUEL MARKET, 2020–2030 ($MILLION)
FIGURE 42.INDIA SUSTAINABLE AVIATION FUEL MARKET, 2020–2030 ($MILLION)
FIGURE 43.SOUTH KOREA SUSTAINABLE AVIATION FUEL MARKET, 2020–2030 ($MILLION)
FIGURE 44.REST OF ASIA-PACIFIC SUSTAINABLE AVIATION FUEL MARKET, 2020–2030 ($MILLION)
FIGURE 45.COMPARATIVE SHARE ANALYSIS OF SUSTAINABLE AVIATION FUEL MARKET, BY COUNTRY, 2020–2030 (%)
FIGURE 46.LATIN AMERICA SUSTAINABLE AVIATION FUEL MARKET, 2020–2030 ($MILLION)
FIGURE 47.MIDDLE EAST SUSTAINABLE AVIATION FUEL MARKET, 2020–2030 ($MILLION)
FIGURE 48.AFRICA SUSTAINABLE AVIATION FUEL MARKET, 2020–2030 ($MILLION)
FIGURE 49.AEMETIS: NET SALES, 2018–2020 ($MILLION)
FIGURE 50.AEMETIS: REVENUE SHARE BY REGION, 2020 (%)
FIGURE 51.GEVO: NET SALES, 2018–2020 ($MILLION)
FIGURE 52.GEVO: REVENUE SHARE BY SEGMENT, 2020 (%)
FIGURE 53.GEVO: REVENUE SHARE BY REGION, 2020 (%)
FIGURE 54.NESTE: NET SALES, 2018–2020 ($MILLION)
FIGURE 55.NESTE: REVENUE SHARE BY SEGMENT, 2020 (%)
FIGURE 56.NESTE: REVENUE SHARE BY REGION, 2020 (%)
$5769
$6450
$9995
HAVE A QUERY?
OUR CUSTOMER

SIMILAR REPORTS