
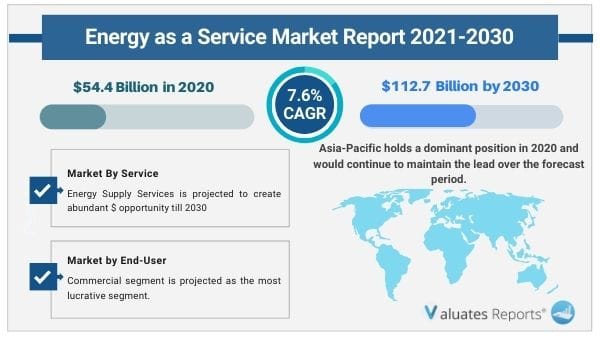
The global energy as a service market size was valued at $54.4 billion in 2020 and is projected to reach $112.7 billion by 2030, growing at a Compound Annual Growth Rate (CAGR) of 7.6% from 2021 to 2030. Key drivers of the Energy as a Service Market are growing efforts by building owners to reduce the energy cost of buildings and rising renewable energy generation.
Further rise in energy efficiency activities, growing renewable energy adoption, and increasing smart grid installations will propel the growth of the Energy as a Service Market during the forecast period.
Additionally, the rapid transition from the traditional energy model to the EaaS model by key players will create lucrative opportunities for the growth of the EaaS market in the coming years.
Aging infrastructure for generating and transmitting power has forced building owners to invest and upgrade their policies for Distributed Energy Resources (DER). DERs consist of renewable energy, demand response capabilities, and other energy-saving technologies for reducing energy usage and better control leading to effective management of costs. Thus growing demand for DERs and their cost-efficiency will boost the growth of the Energy as a Service Market during the forecast period.
Favorable government policies are leading to increased investments in energy efficiency projects fueling the wide scale adoption of renewable energy by various industries. A strong supportive legal policy framework is being adopted by governments around the world to rapidly scale up smart grid installations for ensuring their stability and realizing their energy-saving potential. Thus growing government support, rising investments, and an increase in energy efficiency projects are driving wide-scale adoption of renewable energy ultimately surging the growth of the Energy as a Service Market during the forecast period.
Key market players are looking for easy accessibility of energy sources and are undertaking contracts for DERs and energy efficiency solutions. The companies in the EaaS market are focussing on the successful deployment and distribution of renewable energy to residential and commercial sectors. Thus the growing transition of key market players from traditional energy models to EaaS models is expected to fuel the growth of the Energy as a Service Market during the forecast period.
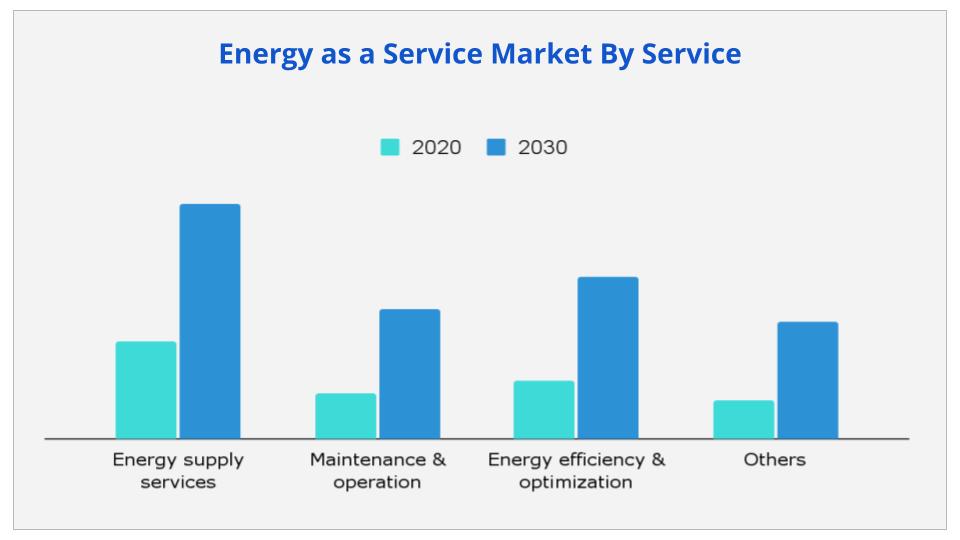
Based on type, the energy supply services segment is expected to provide lucrative opportunities for growth in the Energy as a Service Market share during the forecast period due to the increasing usage of electric driven heavy manufacturing and transportation equipment leading to rising electric energy consumption ultimately surging the demand for energy supply services.
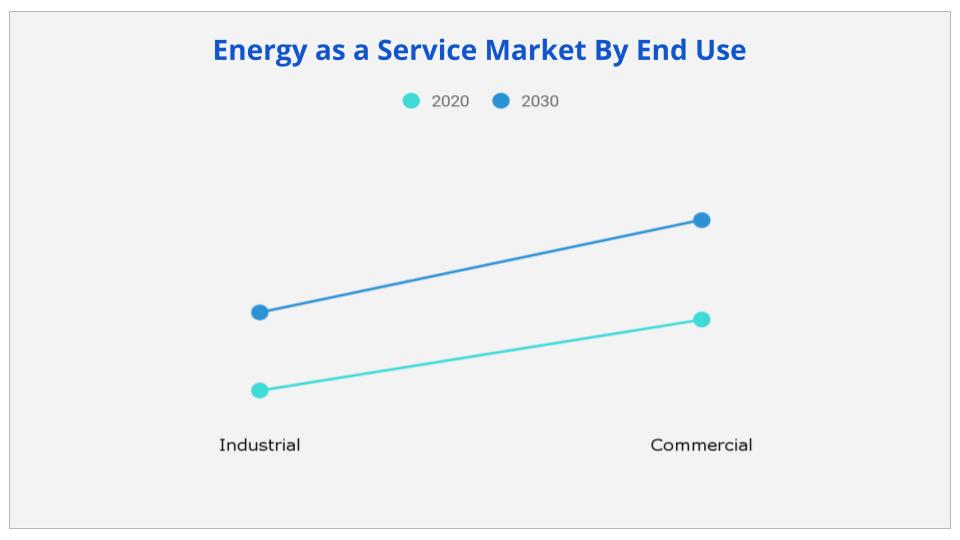
Based on end-users, the commercial segment is expected to provide lucrative opportunities for growth in the Energy as a Service Market share during the forecast period due to increasing demand for electricity from commercial sectors such as data centers, restaurants, educational institutions, and commercial complexes, etc. Further, the growing need for optimization of energy consumption for reducing energy bills and supporting sustainable environmental growth is also propelling the demand of the commercial segment.
Based on region, Asia-pacific is expected to provide lucrative opportunities for growth in the Energy as a Service Market share during the forecast period due to the presence of key market players, huge consumer base, rapid digitization, decarbonization, and increasing usage of distribution generation services.
|
Report Metric |
Details |
|
Report Name |
Energy As A Service Market |
|
The market size in 2020 |
USD 54.4 Billion |
|
The revenue forecast in 2030 |
USD 112.7 Billion |
|
Growth Rate |
Compound Annual Growth Rate (CAGR) of 7.6% from 2021 to 2030 |
|
Market size available for years |
2021-2030 |
|
Forecast units |
Value (USD) |
|
Segments covered |
Type, End-User, and Region |
|
Report coverage |
Revenue & volume forecast, company share, competitive landscape, growth factors, and trends |
|
Geographic regions covered |
North America, Europe, Asia Pacific, Latin America, Middle East & Africa |
Ans. The global energy as a service market size was valued at $54.4 billion in 2020 and is projected to reach $112.7 billion by 2030, growing at a Compound Annual Growth Rate (CAGR) of 7.6% from 2021 to 2030.
Ans. Akrema Group, Advanced Nanotech Lab, Diamon-Fusion International Inc., Fenzi SpA, Koninklijke DSM N.V, Nanoman, Nanopool GmbH, PPG Industries Inc., Unelko Corporation, and 3M.
Ans. Asia-Pacific will provide more business opportunities for Energy as a Service in future.
Ans. Commercial segment holds the maximum share of the Energy as a Service Market.
Ans. The rapid transition from the traditional energy model to the energy as a service model by key players will create lucrative opportunities for the growth of the energy as a service market in the coming years.
Ans. Rise in demand for electricity from commercial applications such as restaurants, educational institutes, data centers, commercial complexes, and warehouses.
CHAPTER 1:INTRODUCTION
1.1.Report description
1.2.Key benefits for stakeholders
1.3.Key market segments
1.4.Research methodology
1.4.1.Primary research
1.4.2.Secondary research
1.4.3.Analyst tools and models
CHAPTER 2:EXECUTIVE SUMMARY
2.1.Key findings
2.2.CXO perspective
CHAPTER 3:MARKET OVERVIEW
3.1.Market definition and scope
3.2.Key Findings
3.2.1. Top investment pockets
3.3.Value chain analysis
3.4.Patent analysis
3.5.Market dynamics
3.5.1.Drivers
3.5.1.1.Increase in energy efficiency
3.5.1.2.Availability of finances and subsidies
3.5.1.3. Acceptance in residential sector
3.5.2.Restraints
3.5.2.1.High technological costs
3.5.2.2. Information barriers and uncertainty regarding technological performance
3.5.3.Opportunity
3.5.3.1.Integration of renewable energy
3.5.3.2. Electrification of transportation and commercial buildings
3.7.Impact of government regulations on the market
3.8.Impact of COVID-19 outbreak on the market
CHAPTER 4:ENERGY AS A SERVICE MARKET, BY SERVICE
4.1.Overview
4.1.1.Market size and forecast
4.2.Energy supply services
4.2.1.Key market trends, growth factors, and opportunities
4.2.2.Market size and forecast, by region
4.2.3.Comparative share analysis, by country
4.3.Maintenance & operation
4.3.1.Key market trends, growth factors, and opportunities
4.3.2.Market size and forecast, by region
4.3.3.Comparative share analysis, by country
4.4.Energy efficiency & optimization
4.4.1.Key market trends, growth factors, and opportunities
4.4.2.Market size and forecast, by region
4.4.3.Comparative share analysis, by country
4.5.Others
4.5.1.Key market trends, growth factors, and opportunities
4.5.2.Market size and forecast, by region
4.5.3.Comparative share analysis, by country
CHAPTER 5:ENERGY AS A SERVICE MARKET, BY END USE
5.1.Overview
5.1.1.Market size and forecast
5.2.Industrial
5.2.1.Key market trends, growth factors, and opportunities
5.2.2.Market size and forecast, by region
5.2.3.Comparative Share Analysis, by Country
5.3.Commercial
5.3.1.Key market trends, growth factors, and opportunities
5.3.2.Market size and forecast, by region
5.3.3.Comparative share Analysis, by country
CHAPTER 6:ENERGY AS A SERVICE MARKET, BY REGION
6.1.Overview
6.1.1.Market size and forecast, by region
6.2.North America
6.2.1.Key market trends, growth factors, and opportunities
6.2.2.Market size and forecast, by service
6.2.3.Market size and forecast, by end use
6.2.4.Market analysis, by country
6.2.4.1.U.S.
6.2.4.1.1.Market size and forecast, by service
6.2.4.1.2.Market size and forecast, by end use
6.2.4.2.Canada
6.2.4.2.1.Market size and forecast, by service
6.2.4.2.2.Market size and forecast, by end use
6.2.4.3.Mexico
6.2.4.3.1.Market size and forecast, by service
6.2.4.3.2.Market size and forecast, by end use
6.3.Europe
6.3.1.Key market trends, growth factors, and opportunities
6.3.2.Market size and forecast, by service
6.3.3.Market size and forecast, by end use
6.3.4.Market analysis, by country
6.3.4.1.Germany
6.3.4.1.1.Market size and forecast, by service
6.3.4.1.2.Market size and forecast, by end use
6.3.4.2.France
6.3.4.2.1.Market size and forecast, by service
6.3.4.2.2.Market size and forecast, by end use
6.3.4.3.Italy
6.3.4.3.1.Market size and forecast, by service
6.3.4.3.2.Market size and forecast, by end use
6.3.4.4.Spain
6.3.4.4.1.Market size and forecast, by service
6.3.4.4.2.Market size and forecast, by end use
6.3.4.5.UK
6.3.4.5.1.Market size and forecast, by service
6.3.4.5.2.Market size and forecast, by end use
6.3.4.6.Rest of Europe
6.3.4.6.1.Market size and forecast, by service
6.3.4.6.2.Market size and forecast, by end use
6.4.Asia-Pacific
6.4.1.Key market trends, growth factors, and opportunities
6.4.2.Market size and forecast, by service
6.4.3.Market size and forecast, by end use
6.4.4.Market analysis, by country
6.4.4.1.China
6.4.4.1.1.Market size and forecast, by service
6.4.4.1.2.Market size and forecast, by end use
6.4.4.2.Japan
6.4.4.2.1.Market size and forecast, by service
6.4.4.2.2.Market size and forecast, by end use
6.4.4.3.India
6.4.4.3.1.Market size and forecast, by service
6.4.4.3.2.Market size and forecast, by end use
6.4.4.4.South Korea
6.4.4.4.1.Market size and forecast, by service
6.4.4.4.2.Market size and forecast, by end use
6.4.4.5.Australia
6.4.4.5.1.Market size and forecast, by service
6.4.4.5.2.Market size and forecast, by end use
6.4.4.6.Rest of Asia Pacific
6.4.4.6.1.Market size and forecast, by service
6.4.4.6.2.Market size and forecast, by end use
6.5.LAMEA
6.5.1.Key market trends, growth factors, and opportunities
6.5.2.Market size and forecast, by service
6.5.3.Market size and forecast, by end use
6.5.4.Market analysis, by country
6.5.4.1.Brazil
6.5.4.1.1.Market size and forecast, by service
6.5.4.1.2.Market size and forecast, by end use
6.5.4.2.Saudi Arabia
6.5.4.2.1.Market size and forecast, by service
6.5.4.2.2.Market size and forecast, by end use
6.5.4.3.South Africa
6.5.4.3.1.Market size and forecast, by service
6.5.4.3.2.Market size and forecast, by end use
6.5.4.4.Rest of LAMEA
6.5.4.4.1.Market size and forecast, by service
6.5.4.4.2.Market size and forecast, by end use
CHAPTER 7:COMPETITIVE LANDSCAPE
7.1.Introduction
7.1.1.Market Player Positioning, 2020
7.2.Top winning strategies
7.2.1.Top winning strategies, by year
7.2.2.Top winning strategies, by development
7.2.3.Top winning strategies, by company
7.3.Product Mapping of Top 10 Player
7.4.Competitive Heatmap
7.5.Key developments
7.5.1.New product launch
7.5.2.Acquisitions
7.5.3.Partnerships
7.5.4.Business expansions
CHAPTER 8:COMPANY PROFILES
8.1.ALPIQ
8.1.1.Company overview
8.1.2.Key executives
8.1.3.Company snapshot
8.1.4.Operating business segments
8.1.5.Product portfolio
8.1.6.Business performance
8.1.7.Key strategic moves and developments
8.2.EDF RENEWABLES, INC.
8.2.1.Company overview
8.2.2.Key executives
8.2.3.Company snapshot
8.2.4.Product portfolio
8.2.5.Key strategic moves and developments
8.3.ENEL X
8.3.1.Company overview
8.3.2.Key executives
8.3.3.Company snapshot
8.3.4.Product portfolio
8.3.5.Business performance
8.3.6.Key strategic moves and developments
8.4.ENGIE
8.4.1.Company overview
8.4.2.Key executives
8.4.3.Company snapshot
8.4.4.Operating business segments
8.4.5.Product portfolio
8.4.6.R&D expenditure
8.4.7.Business performance
8.4.8.Key strategic moves and developments
8.5.GENERAL ELECTRIC
8.5.1.Company overview
8.5.2.Key executives
8.5.3.Company snapshot
8.5.4.Operating business segments
8.5.5.Product portfolio
8.5.6.R&D expenditure
8.5.7.Business performance
8.6.HONEYWELL169
8.6.1.Company overview
8.6.2.Key executives
8.6.3.Company snapshot
8.6.4.Operating business segments
8.6.5.Product portfolio
8.6.6.R&D expenditure
8.6.7.Business performance
8.6.8.Key strategic moves and developments
8.7.JOHNSON CONTROLS
8.7.1.Company overview
8.7.2.Key executives
8.7.3.Company snapshot
8.7.4.Operating business segments
8.7.5.Product portfolio
8.7.6.R&D expenditure
8.7.7.Business performance
8.7.8.Key strategic moves and developments
8.8.SCHNEIDER ELECTRIC
8.8.1.Company overview
8.8.2.Key executives
8.8.3.Company snapshot
8.8.4.Operating business segments
8.8.5.Product portfolio
8.8.6.R&D expenditure
8.8.7.Business performance
8.8.8.Key strategic moves and developments
8.9.VEOLIA
8.9.1.Company overview
8.9.2.Key executives
8.9.3.Company snapshot
8.9.4.Operating business segments
8.9.5.Product portfolio
8.9.6.R&D expenditure
8.9.7.Business performance
8.9.8.Key strategic moves and developments
8.10.WGL ENERGY
8.10.1.Company overview
8.10.2.Key executives
8.10.3.Company snapshot
8.10.4.Product portfolio
8.10.5.Business performance
8.10.6.Key strategic moves and developments
Table 01.Energy As A Service Market, By Service, 2020–2030 ($Million)
Table 02.Energy Supply Services Market, By Region, 2020–2030 ($Million)
Table 03.Maintenance & Operation Market, By Region, 2020–2030 ($Million)
Table 04.Energy Efficiency & Optimization Market, By Region, 2020–2030 ($Million)
Table 05.Energy As A Service Market For Others, By Region, 2020–2030 ($Million)
Table 06.Energy As A Service Market, By End Use, 2020–2030 ($Million)
Table 07.Energy As A Service Market For Industrial, By Region, 2020–2030 ($Million)
Table 08.Energy As A Service Market For Commercial, By Region, 2020–2030 ($Million)
Table 09.Energy As A Service Market, By Region, 2020-2030 ($Million)
Table 10.North America Energy As A Service Market, By Service, 2020-2030 ($Million)
Table 11.North America Energy As A Service Market, By End Use, 2020-2030 ($Million)
Table 12.North America Energy As A Service Market, By Country, 2020-2030 ($Million)
Table 13.U.S. Energy As A Service Market, By Service, 2020-2030 ($Million)
Table 14.U.S. Energy As A Service Market, By End Use, 2020-2030 ($Million)
Table 15.Canada Energy As A Service Market, By Service, 2020-2030 ($Million)
Table 16.Canada Energy As A Service Market, By End Use, 2020-2030 ($Million)
Table 17.Mexico Energy As A Service Market, By Service, 2020-2030 ($Million)
Table 18.Mexico Energy As A Service Market, By End Use, 2020-2030 ($Million)
Table 19.Europe Energy As A Service Market, By Service, 2020-2030 ($Million)
Table 20.Europe Energy As A Service Market, By End Use, 2020-2030 ($Million)
Table 21.Europe Energy As A Service Market, By Country, 2020-2030 ($Million)
Table 22.Germany Energy As A Service Market, By Service, 2020-2030 ($Million)
Table 23.Germany Energy As A Service Market, By End Use, 2020-2030 ($Million)
Table 24.France Energy As A Service Market, By Service, 2020-2030 ($Million)
Table 25.France Energy As A Service Market, By End Use, 2020-2030 ($Million)
Table 26.Italy Energy As A Service Market, By Service, 2020-2030 ($Million)
Table 27.Italy Energy As A Service Market, By End Use, 2020-2030 ($Million)
Table 28.Spain Energy As A Service Market, By Service, 2020-2030 ($Million)
Table 29.Spain Energy As A Service Market, By End Use, 2020-2030 ($Million)
Table 30.Uk Energy As A Service Market, By Service, 2020-2030 ($Million)
Table 31.Uk Energy As A Service Market, By End Use, 2020-2030 ($Million)
Table 32.Rest Of Europe Energy As A Service Market, By Service, 2020-2030 ($Million)
Table 33.Rest Of Europe Energy As A Service Market, By End Use, 2020-2030 ($Million)
Table 34.Asia-Pacific Energy As A Service Market, By Service, 2020-2030 ($Million)
Table 35.Asia-Pacific Energy As A Service Market, By End Use, 2020-2030 ($Million)
Table 36.Asia-Pacific Energy As A Service Market, By Country, 2020-2030 ($Million)
Table 37.China Energy As A Service Market, By Service, 2020-2030 ($Million)
Table 38.China Energy As A Service Market, By End Use, 2020-2030 ($Million)
Table 39.Japan Energy As A Service Market, By Service, 2020-2030 ($Million)
Table 40.Japan Energy As A Service Market, By End Use, 2020-2030 ($Million)
Table 41.India Energy As A Service Market, By Service, 2020-2030 ($Million)
Table 42.India Energy As A Service Market, By End Use, 2020-2030 ($Million)
Table 43.South Korea Energy As A Service Market, By Service, 2020-2030 ($Million)
Table 44.South Korea Energy As A Service Market, By End Use, 2020-2030 ($Million)
Table 45.Australia Energy As A Service Market, By Service, 2020-2030 ($Million)
Table 46.Australia Energy As A Service Market, By End Use, 2020-2030 ($Million)
Table 47.Rest Of Asia-Pacific Energy As A Service Market, By Service, 2020-2030 ($Million)
Table 48.Rest Of Asia-Pacific Energy As A Service Market, By End Use, 2020-2030 ($Million)
Table 49.Lamea Energy As A Service Market, By Service, 2020-2030 ($Million)
Table 50.Lamea Energy As A Service Market, By Ende Use, 2020-2030 ($Million)
Table 51.Lamea Energy As A Service Market, By Country, 2020-2030 ($Million)
Table 52.Brazil Energy As A Service Market, By Service, 2020-2030 ($Million)
Table 53.Brazil Energy As A Service Market, By End Use, 2020-2030 ($Million)
Table 54.Saudi Arabia Energy As A Service Market, By Service, 2020-2030 ($Million)
Table 55.Saudi Arabia Energy As A Service Market, By End Use, 2020-2030 ($Million)
Table 56.South Africa Energy As A Service Market, By Service, 2020-2030 ($Million)
Table 57.South Africa Energy As A Service Market, By End Use, 2020-2030 ($Million)
Table 58.Rest Of Lamea Energy As A Service Market, By Service, 2020-2030 ($Million)
Table 59.Rest Of Lamea Energy As A Service Market, By End Use, 2020-2030 ($Million)
Table 60.Key New Product Launch (2016-2021)
Table 61.Key Acquisitions (2016-2021)
Table 62.Key Partnerships (2016-2021)
Table 63.Key Business Expansions (2016-2021)
Table 64.Alpiq: Key Executives
Table 65.Alpiq: Company Snapshot
Table 66.Alpiq: Operating Segments
Table 67.Alpiq: Product Portfolio
Table 68.Alpiq: Net Sales, 2018–2020 ($Million)
Table 69.Edf Renewables, Inc.: Key Executives
Table 70.Edf Renewables, Inc.: Company Snapshot
Table 71.Edf Renewables, Inc.: Product Portfolio
Table 72.Enel X: Key Executives
Table 73.Enel X: Company Snapshot
Table 74.Enel X: Product Portfolio
Table 75.Enel X Net Sales, 2018–2020 ($Million)
Table 76.Engie: Key Executives
Table 77.Engie: Company Snapshot
Table 78.Engie: Operating Segments
Table 79.Engie: Product Portfolio
Table 80.Engie: R&D Expenditure, 2018–2020 ($Million)
Table 81.Engie: Net Sales, 2018–2020 ($Million)
Table 82.General Electric: Key Executives
Table 83.General Electric: Company Snapshot
Table 84.General Electric: Operating Segments
Table 85.General Electric: Product Portfolio
Table 86.General Electric: R&D Expenditure, 2018–2020 ($Million)
Table 87.General Electric: Net Sales, 2018–2020 ($Million)
Table 88.Honeywell: Key Executives
Table 89.Honeywell: Company Snapshot
Table 90.Honeywell: Operating Segments
Table 91.Honeywell: Product Portfolio
Table 92.Honeywell: R&D Expenditure, 2018–2020 ($Million)
Table 93.Honeywell: Net Sales, 2018–2020 ($Million)
Table 94.Johnson Controls: Key Executives
Table 95.Johnson Controls: Company Snapshot
Table 96.Johnson Controls: Operating Segments
Table 97.Johnson Controls: Product Portfolio
Table 98.Johnson Controls: R&D Expenditure, 2018–2020 ($Million)
Table 99.Johnson Controls: Net Sales, 2018–2020 ($Million)
Table 100.Schneider Electric: Key Executives
Table 101.Schneider Electric: Company Snapshot
Table 102.Schneider Electric: Operating Segments
Table 103.Schneider Electric: Product Portfolio
Table 104.Schneider Electric: R&D Expenditure, 2018–2020 ($Million)
Table 105.Schneider Electric: Net Sales, 2018–2020 ($Million)
Table 106.Veolia: Key Executives
Table 107.Veolia: Company Snapshot
Table 108.Veolia: Operating Segments
Table 109.Veolia: Product Portfolio
Table 110.Veolia: R&D Expenditure, 2018–2020 ($Million)
Table 111.Veolia: Net Sales, 2018–2020 ($Million)
Table 112.Wgl Energy: Key Executives
Table 114.Wgl Energy: Company Snapshot
Table 115.Wgl Energy: Product Portfolio
List Of Figures
Figure 01.Key Market Segments
Figure 02.Energy As A Service Market Snapshot, By Segmentation, 2020–2030
Figure 03.Energy As A Service Market Snapshot, By Country, 2020–2030
Figure 04.Top Investment Pockets
Figure 05.High Bargaining Power Of Suppliers
Figure 06.High Threat Of New Entrants
Figure 07.High Threat Of Substitutes
Figure 08.High Intensity Of Rivalry
Figure 09.Low Bargaining Power Of Buyers
Figure 10.Patent Analysis For Energy As A Service
Figure 11.Energy As A Service Market Dynamics
Figure 12.Value Chain Analysis For Energy As A Service Market
Figure 13.Energy As A Service Market, By Service, 2021–2030 ($Million)
Figure 14.Comparative Analysis Of Energy Supply Services Market, By Country, 2021 & 2030 ($Million)
Figure 15.Comparative Analysis Of Maintenance And Operation Market, By Country, 2021 & 2030 ($Million)
Figure 16.Comparative Analysis Of Energy Efficiency And Optimization Market, By Country,
2021 & 2030 ($Million)
Figure 17.Comparative Analysis Of Others Market, By Country, 2021 & 2030 ($Million)
Figure 18.Energy As A Service Market, By End Use, 2021–2030 ($Million)
Figure 19.Comparative Analysis Of Energy As A Service Market For Industrial, By Country,
2021 & 2030 ($Million)
Figure 20.Comparative Analysis Of Energy As A Service Market For Commercial, By Country, 2021 & 2030 ($Million)
Figure 21.U.S. Energy As A Service Market Revenue, 2020–2030 ($Million)
Figure 22.Canada Energy As A Service Market Revenue, 2020–2030 ($Million)
Figure 23.Mexico Energy As A Service Market Revenue, 2020–2030 ($Million)
Figure 24.Germany Energy As A Service Market Revenue, 2020–2030 ($Million)
Figure 25.France Energy As A Service Market Revenue, 2020–2030 ($Million)
Figure 26.Italy Energy As A Service Market Revenue, 2020–2030 ($Million)
Figure 27.Spain Energy As A Service Market Revenue, 2020–2030 ($Million)
Figure 28.Uk Energy As A Service Market Revenue, 2020–2030 ($Million)
Figure 29.Rest Of Europe Energy As A Service Market Revenue, 2020–2030 ($Million)
Figure 30.China Energy As A Service Market Revenue, 2020–2030 ($Million)
Figure 31.Japan Energy As A Service Market Revenue, 2020–2030 ($Million)
Figure 32.India Energy As A Service Market Revenue, 2020–2030 ($Million)
Figure 33.South Korea Energy As A Service Market Revenue, 2020–2030 ($Million)
Figure 34.Australia Energy As A Service Market Revenue, 2020–2030 ($Million)
Figure 35.Rest Of Asia-Pacific Energy As A Service Market Revenue, 2020–2030 ($Million)
Figure 36.Brazil Energy As A Service Market Revenue, 2020–2030 ($Million)
Figure 37.Saudi Arabia Energy As A Service Market Revenue, 2020–2030 ($Million)
Figure 38.South Africa Energy As A Service Market Revenue, 2020–2030 ($Million)
Figure 39.Rest Of Lamea Energy As A Service Market Revenue, 2020–2030 ($Million)
Figure 40.Veolia: R&D Expenditure, 2018–2020 ($Million)
Figure 41.Veolia: Net Sales, 2018–2020 ($Million)
Figure 42.Veolia: Revenue Share By Segment, 2020 (%)
Figure 43.Veolia: Revenue Share By Region, 2020 (%)
Figure 44.Honeywell: R&D Expenditure, 2018–2020 ($Million)
Figure 45.Honeywell: Net Sales, 2018–2020 ($Million)
Figure 46.Honeywell: Revenue Share By Region, 2020 (%)
Figure 47.Enel X: Net Sales, 2018–2020 ($Million)
Figure 48.Schneider Electric: R&D Expenditure, 2018–2020 ($Million)
Figure 49.Schneider Electric: Net Sales, 2018–2020 ($Million)
Figure 50.Schneider Electric: Revenue Share By Segment, 2020 (%)
Figure 51.Schneider Electric: Revenue Share By Region, 2020 (%)
Figure 52.Engie: R&D Expenditure, 2018–2020 ($Million)
Figure 53.Engie: Net Sales, 2018–2020 ($Million)
Figure 54.Engie: Revenue Share By Segment, 2020 (%)
Figure 55.Engie: Revenue Share By Region, 2020 (%)
Figure 56.Johnson Controls: R&D Expenditure, 2018–2020 ($Million)
Figure 57.Johnson Controls: Net Sales, 2018–2020 ($Million)
Figure 58.Johnson Controls: Revenue Share By Segment, 2020 (%)
Figure 59.Johnson Controls: Revenue Share By Region, 2020 (%)
Figure 60.Alpiq: Net Sales, 2018–2020 ($Million)
Figure 61.Alpiq: Revenue Share By Segment, 2020 (%)
Figure 62.Alpiq: Revenue Share By Region, 2020 (%)
Figure 63.General Electric: R&D Expenditure, 2018–2020 ($Million)
Figure 64.General Electric: Net Sales, 2018–2020 ($Million)
Figure 65.General Electric: Revenue Share By Segment, 2020 (%)
Figure 66.General Electric: Revenue Share By Region, 2020 (%)
$5243
$7997
HAVE A QUERY?
OUR CUSTOMER

SIMILAR REPORTS