
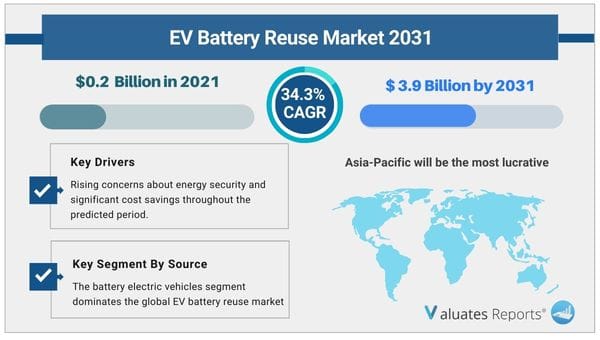
The global EV battery reuse market size was valued at $0.2 billion in 2021, and the Electric Vehicle battery reuse industry is projected to reach $3.9 billion by 2031, growing at a CAGR of 34.3% from 2022 to 2031. Due to factors like the scarcity of raw materials and the rising demand for battery materials as a result of the expanding global energy demand from other sectors, it is predicted that the market for reusing EV batteries will grow. Throughout the anticipated period, the EV battery reuse market will also profit from growing concerns about energy security and significant cost savings.
Due to the fast growing EV market, worries have been expressed concerning the long-term availability of battery materials. These include issues with supply caused by significant geopolitical cobalt concentrations, social and environmental impacts of mining, the existence of cobalt and lithium reserves, and the requirement for quick supply chain expansion to meet anticipated demand. The lack of battery raw materials and the rising global energy demand can both be addressed by recycling EV batteries. The market for reusing EV batteries is anticipated to grow as a result of these factors.
The EV battery reuse market in base station applications is anticipated to grow due to rising investments in communication towers across the globe. Reusing EV batteries can give base stations the energy storage system they require to supply a constant power source for effective operation.
One of the simpler solutions is direct reuse, where recovered batteries from insurance write-offs are inspected and put to the test to see whether they are still functional before being offered as replacements in other EVs. This strategy is akin to the markets that exist now for the powertrain components of internal combustion engines.
Batteries could potentially be utilized to replace conventional grid-connected combustion turbine peaker facilities for peak shaving or as grid-scale solar peaker storage. The EV battery reuse market is anticipated to expand as a result of this aspect. This application anticipates battery reuse lives of at least ten years. Using battery energy storage, the grid stability issues with renewable energy can be resolved. DSOs and energy suppliers can use the battery as a grid backup power source.
To improve EV second-life applications, funding is being given to research and proof-of-concept projects. For instance, funding is being provided for investigations and studies that show the potential of EV afterlife applications. This element is also anticipated to fuel the EV battery reuse market.
Asia-Pacific ruled the world market for reusing EV batteries in 2021. Numerous enterprises in this area have a strong demand for various batteries. The need for battery recycling and reuse facilities has grown as a result of the area's substantial population and developing industrial potential.
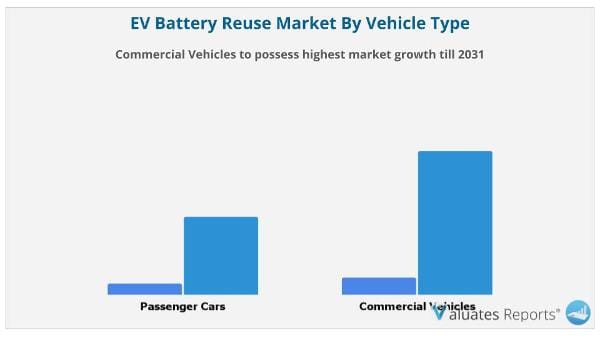
The commercial vehicle industry dominates the world market for reusing EV batteries. Commercial trucks are powered by electricity rather than diesel or petrol. The increased demand for low-emission transportation and government backing of zero-emission transportation for electric commercial vehicles, including buses, trucks, pickups, and vans, through subsidies and tax breaks, have compelled manufacturers to produce ECVs for the entire world.
The lithium manganese oxide market category dominates the global EV battery reuse market. Lithium manganese oxide batteries are frequently used in electricity, gas, and water meters, fire and smoke alarms, security apparatus, and other systems.
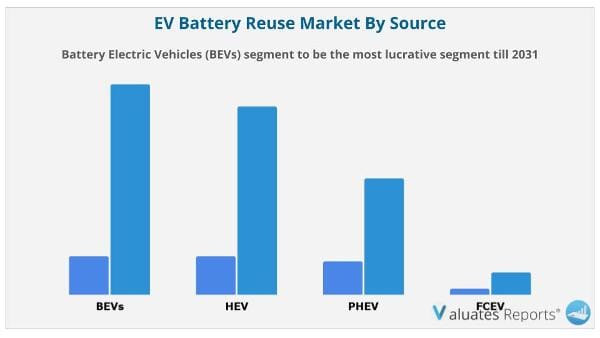
The category of battery electric cars is dominating the growth of the global EV battery reuse market. The market is growing as a result of the availability of tax advantages and the rising need for ecologically friendly mobility solutions to cut down on pollution levels.
The base station application accounted for the largest market share in 2021.
By Battery Chemistry
By Vehicle Type
By Application
By Region
By Key Players
BYD Co, Ltd., Global Battery Solutions, Ltd., Daimler AG, Samsung SDI Co., Ltd, LG Chem Ltd., Groupe PSA, GS Yuasa Corporation, General Motors, Toshiba Corporation, Envision AESC, Nissan Motor Co., Ltd., Toyota Motor Corporation, BMW Group, Tesla Inc, Johnson Controls, inc., Lithium Wrecks, Mitsubishi Electric Corporation
| Report Metric | Details |
| Report Name | EV Battery Reuse Market |
| The market size in 2021 | USD 0.2 Billion |
| The revenue forecast in 2031 | USD 3.9 Billion |
| Growth Rate | Compound Annual Growth Rate (CAGR) of 34.3% from 2022 to 2031 |
| Market size available for years | 2022-2031 |
| Forecast units | Value (USD) |
| Segments covered | By Service, Industry, Traveler, Regions |
| Report coverage | Revenue & volume forecast, company share, competitive landscape, growth factors, and trends |
| Geographic regions covered | North America, Europe, Asia Pacific, Latin America, Middle East & Africa |
Ans. The global EV battery reuse market size was valued at $0.2 billion in 2021, and the EV battery reuse industry is projected to reach $3.9 billion by 2031, growing at a CAGR of 34.3% from 2022 to 2031.
Ans. On the basis of Source, the battery electric vehicles segment dominates the global EV battery reuse market growth.
Ans. Asia-Pacific dominated the global EV battery reuse market in 2021.
CHAPTER 1:INTRODUCTION
1.1.Report description
1.2.Key market segments
1.3.Key benefits to the stakeholders
1.4.Research Methodology
1.4.1.Secondary research
1.4.2.Primary research
1.4.3.Analyst tools and models
CHAPTER 2:EXECUTIVE SUMMARY
2.1.Key findings of the study
2.2.CXO Perspective
CHAPTER 3:MARKET OVERVIEW
3.1.Market definition and scope
3.2.Key findings
3.2.1.Top investment pockets
3.3.Porter’s five forces analysis
3.4.Top player positioning
3.5.Market dynamics
3.5.1.Drivers
3.5.2.Restraints
3.5.3.Opportunities
3.6.COVID-19 Impact Analysis on the market
3.7.Value Chain Analysis
3.8.Key Regulation Analysis
CHAPTER 4: EV BATTERY REUSE MARKET, BY SOURCE
4.1 Overview
4.1.1 Market size and forecast
4.2 Battery Electric Vehicles (BEVs)
4.2.1 Key market trends, growth factors and opportunities
4.2.2 Market size and forecast, by region
4.2.3 Market analysis by country
4.3 Hybrid Electric Vehicle (HEV)
4.3.1 Key market trends, growth factors and opportunities
4.3.2 Market size and forecast, by region
4.3.3 Market analysis by country
4.4 Plug-in Hybrid Electric Vehicle (PHEV)
4.4.1 Key market trends, growth factors and opportunities
4.4.2 Market size and forecast, by region
4.4.3 Market analysis by country
4.5 Fuel Cell Electric Vehicle (FCEV)
4.5.1 Key market trends, growth factors and opportunities
4.5.2 Market size and forecast, by region
4.5.3 Market analysis by country
CHAPTER 5: EV BATTERY REUSE MARKET, BY BATTERY CHEMISTRY
5.1 Overview
5.1.1 Market size and forecast
5.2 Lithium-Iron Phosphate
5.2.1 Key market trends, growth factors and opportunities
5.2.2 Market size and forecast, by region
5.2.3 Market analysis by country
5.3 Lithium-Manganese Oxide
5.3.1 Key market trends, growth factors and opportunities
5.3.2 Market size and forecast, by region
5.3.3 Market analysis by country
5.4 Lithium-Nickel-Cobalt-Aluminum Oxide
5.4.1 Key market trends, growth factors and opportunities
5.4.2 Market size and forecast, by region
5.4.3 Market analysis by country
5.5 Lithium-Nickel-Manganese Cobalt
5.5.1 Key market trends, growth factors and opportunities
5.5.2 Market size and forecast, by region
5.5.3 Market analysis by country
5.6 Lithium-Titanate Oxide
5.6.1 Key market trends, growth factors and opportunities
5.6.2 Market size and forecast, by region
5.6.3 Market analysis by country
CHAPTER 6: EV BATTERY REUSE MARKET, BY VEHICLE TYPE
6.1 Overview
6.1.1 Market size and forecast
6.2 Passenger Cars
6.2.1 Key market trends, growth factors and opportunities
6.2.2 Market size and forecast, by region
6.2.3 Market analysis by country
6.3 Commercial Vehicles
6.3.1 Key market trends, growth factors and opportunities
6.3.2 Market size and forecast, by region
6.3.3 Market analysis by country
CHAPTER 7: EV BATTERY REUSE MARKET, BY APPLICATION
7.1 Overview
7.1.1 Market size and forecast
7.2 Low speed vehicles
7.2.1 Key market trends, growth factors and opportunities
7.2.2 Market size and forecast, by region
7.2.3 Market analysis by country
7.3 Base Stations
7.3.1 Key market trends, growth factors and opportunities
7.3.2 Market size and forecast, by region
7.3.3 Market analysis by country
7.4 EV charging
7.4.1 Key market trends, growth factors and opportunities
7.4.2 Market size and forecast, by region
7.4.3 Market analysis by country
7.5 Energy Storage
7.5.1 Key market trends, growth factors and opportunities
7.5.2 Market size and forecast, by region
7.5.3 Market analysis by country
CHAPTER 8: EV BATTERY REUSE MARKET, BY REGION
8.1 Overview
8.1.1 Market size and forecast
8.2 North America
8.2.1 Key trends and opportunities
8.2.2 North America Market size and forecast, by Source
8.2.3 North America Market size and forecast, by Battery Chemistry
8.2.4 North America Market size and forecast, by Vehicle Type
8.2.5 North America Market size and forecast, by Application
8.2.6 North America Market size and forecast, by country
8.2.6.1 U.S.
8.2.6.1.1 Market size and forecast, by Source
8.2.6.1.2 Market size and forecast, by Battery Chemistry
8.2.6.1.3 Market size and forecast, by Vehicle Type
8.2.6.1.4 Market size and forecast, by Application
8.2.6.2 Canada
8.2.6.2.1 Market size and forecast, by Source
8.2.6.2.2 Market size and forecast, by Battery Chemistry
8.2.6.2.3 Market size and forecast, by Vehicle Type
8.2.6.2.4 Market size and forecast, by Application
8.2.6.3 Mexico
8.2.6.3.1 Market size and forecast, by Source
8.2.6.3.2 Market size and forecast, by Battery Chemistry
8.2.6.3.3 Market size and forecast, by Vehicle Type
8.2.6.3.4 Market size and forecast, by Application
8.3 Europe
8.3.1 Key trends and opportunities
8.3.2 Europe Market size and forecast, by Source
8.3.3 Europe Market size and forecast, by Battery Chemistry
8.3.4 Europe Market size and forecast, by Vehicle Type
8.3.5 Europe Market size and forecast, by Application
8.3.6 Europe Market size and forecast, by country
8.3.6.1 Germany
8.3.6.1.1 Market size and forecast, by Source
8.3.6.1.2 Market size and forecast, by Battery Chemistry
8.3.6.1.3 Market size and forecast, by Vehicle Type
8.3.6.1.4 Market size and forecast, by Application
8.3.6.2 France
8.3.6.2.1 Market size and forecast, by Source
8.3.6.2.2 Market size and forecast, by Battery Chemistry
8.3.6.2.3 Market size and forecast, by Vehicle Type
8.3.6.2.4 Market size and forecast, by Application
8.3.6.3 Italy
8.3.6.3.1 Market size and forecast, by Source
8.3.6.3.2 Market size and forecast, by Battery Chemistry
8.3.6.3.3 Market size and forecast, by Vehicle Type
8.3.6.3.4 Market size and forecast, by Application
8.3.6.4 Spain
8.3.6.4.1 Market size and forecast, by Source
8.3.6.4.2 Market size and forecast, by Battery Chemistry
8.3.6.4.3 Market size and forecast, by Vehicle Type
8.3.6.4.4 Market size and forecast, by Application
8.3.6.5 UK
8.3.6.5.1 Market size and forecast, by Source
8.3.6.5.2 Market size and forecast, by Battery Chemistry
8.3.6.5.3 Market size and forecast, by Vehicle Type
8.3.6.5.4 Market size and forecast, by Application
8.3.6.6 Rest of Europe
8.3.6.6.1 Market size and forecast, by Source
8.3.6.6.2 Market size and forecast, by Battery Chemistry
8.3.6.6.3 Market size and forecast, by Vehicle Type
8.3.6.6.4 Market size and forecast, by Application
8.4 Asia-Pacific
8.4.1 Key trends and opportunities
8.4.2 Asia-Pacific Market size and forecast, by Source
8.4.3 Asia-Pacific Market size and forecast, by Battery Chemistry
8.4.4 Asia-Pacific Market size and forecast, by Vehicle Type
8.4.5 Asia-Pacific Market size and forecast, by Application
8.4.6 Asia-Pacific Market size and forecast, by country
8.4.6.1 China
8.4.6.1.1 Market size and forecast, by Source
8.4.6.1.2 Market size and forecast, by Battery Chemistry
8.4.6.1.3 Market size and forecast, by Vehicle Type
8.4.6.1.4 Market size and forecast, by Application
8.4.6.2 Japan
8.4.6.2.1 Market size and forecast, by Source
8.4.6.2.2 Market size and forecast, by Battery Chemistry
8.4.6.2.3 Market size and forecast, by Vehicle Type
8.4.6.2.4 Market size and forecast, by Application
8.4.6.3 India
8.4.6.3.1 Market size and forecast, by Source
8.4.6.3.2 Market size and forecast, by Battery Chemistry
8.4.6.3.3 Market size and forecast, by Vehicle Type
8.4.6.3.4 Market size and forecast, by Application
8.4.6.4 South Korea
8.4.6.4.1 Market size and forecast, by Source
8.4.6.4.2 Market size and forecast, by Battery Chemistry
8.4.6.4.3 Market size and forecast, by Vehicle Type
8.4.6.4.4 Market size and forecast, by Application
8.4.6.5 Australia
8.4.6.5.1 Market size and forecast, by Source
8.4.6.5.2 Market size and forecast, by Battery Chemistry
8.4.6.5.3 Market size and forecast, by Vehicle Type
8.4.6.5.4 Market size and forecast, by Application
8.4.6.6 Rest of Asia-Pacific
8.4.6.6.1 Market size and forecast, by Source
8.4.6.6.2 Market size and forecast, by Battery Chemistry
8.4.6.6.3 Market size and forecast, by Vehicle Type
8.4.6.6.4 Market size and forecast, by Application
8.5 LAMEA
8.5.1 Key trends and opportunities
8.5.2 LAMEA Market size and forecast, by Source
8.5.3 LAMEA Market size and forecast, by Battery Chemistry
8.5.4 LAMEA Market size and forecast, by Vehicle Type
8.5.5 LAMEA Market size and forecast, by Application
8.5.6 LAMEA Market size and forecast, by country
8.5.6.1 Brazil
8.5.6.1.1 Market size and forecast, by Source
8.5.6.1.2 Market size and forecast, by Battery Chemistry
8.5.6.1.3 Market size and forecast, by Vehicle Type
8.5.6.1.4 Market size and forecast, by Application
8.5.6.2 Saudi Arabia
8.5.6.2.1 Market size and forecast, by Source
8.5.6.2.2 Market size and forecast, by Battery Chemistry
8.5.6.2.3 Market size and forecast, by Vehicle Type
8.5.6.2.4 Market size and forecast, by Application
8.5.6.3 South Africa
8.5.6.3.1 Market size and forecast, by Source
8.5.6.3.2 Market size and forecast, by Battery Chemistry
8.5.6.3.3 Market size and forecast, by Vehicle Type
8.5.6.3.4 Market size and forecast, by Application
8.5.6.4 Rest of LAMEA
8.5.6.4.1 Market size and forecast, by Source
8.5.6.4.2 Market size and forecast, by Battery Chemistry
8.5.6.4.3 Market size and forecast, by Vehicle Type
8.5.6.4.4 Market size and forecast, by Application
CHAPTER 9: COMPANY LANDSCAPE
9.1. Introduction
9.2. Top winning strategies
9.3. Product Mapping of Top 10 Player
9.4. Competitive Dashboard
9.5. Competitive Heatmap
9.6. Key developments
CHAPTER 10: COMPANY PROFILES
10.1 BYD Co, Ltd.
10.1.1 Company overview
10.1.2 Company snapshot
10.1.3 Operating business segments
10.1.4 Product portfolio
10.1.5 Business performance
10.1.6 Key strategic moves and developments
10.2 Global Battery Solutions, Ltd.
10.2.1 Company overview
10.2.2 Company snapshot
10.2.3 Operating business segments
10.2.4 Product portfolio
10.2.5 Business performance
10.2.6 Key strategic moves and developments
10.3 Daimler AG
10.3.1 Company overview
10.3.2 Company snapshot
10.3.3 Operating business segments
10.3.4 Product portfolio
10.3.5 Business performance
10.3.6 Key strategic moves and developments
10.4 Samsung SDI Co., Ltd
10.4.1 Company overview
10.4.2 Company snapshot
10.4.3 Operating business segments
10.4.4 Product portfolio
10.4.5 Business performance
10.4.6 Key strategic moves and developments
10.5 LG Chem Ltd.
10.5.1 Company overview
10.5.2 Company snapshot
10.5.3 Operating business segments
10.5.4 Product portfolio
10.5.5 Business performance
10.5.6 Key strategic moves and developments
10.6 Groupe PSA
10.6.1 Company overview
10.6.2 Company snapshot
10.6.3 Operating business segments
10.6.4 Product portfolio
10.6.5 Business performance
10.6.6 Key strategic moves and developments
10.7 GS Yuasa Corporation
10.7.1 Company overview
10.7.2 Company snapshot
10.7.3 Operating business segments
10.7.4 Product portfolio
10.7.5 Business performance
10.7.6 Key strategic moves and developments
10.8 General Motors
10.8.1 Company overview
10.8.2 Company snapshot
10.8.3 Operating business segments
10.8.4 Product portfolio
10.8.5 Business performance
10.8.6 Key strategic moves and developments
10.9 Toshiba Corporation
10.9.1 Company overview
10.9.2 Company snapshot
10.9.3 Operating business segments
10.9.4 Product portfolio
10.9.5 Business performance
10.9.6 Key strategic moves and developments
10.10 Envision AESC
10.10.1 Company overview
10.10.2 Company snapshot
10.10.3 Operating business segments
10.10.4 Product portfolio
10.10.5 Business performance
10.10.6 Key strategic moves and developments
10.11 Nissan Motor Co., Ltd.
10.11.1 Company overview
10.11.2 Company snapshot
10.11.3 Operating business segments
10.11.4 Product portfolio
10.11.5 Business performance
10.11.6 Key strategic moves and developments
10.12 Toyota Motor Corporation
10.12.1 Company overview
10.12.2 Company snapshot
10.12.3 Operating business segments
10.12.4 Product portfolio
10.12.5 Business performance
10.12.6 Key strategic moves and developments
10.13 BMW Group
10.13.1 Company overview
10.13.2 Company snapshot
10.13.3 Operating business segments
10.13.4 Product portfolio
10.13.5 Business performance
10.13.6 Key strategic moves and developments
10.14 Tesla Inc
10.14.1 Company overview
10.14.2 Company snapshot
10.14.3 Operating business segments
10.14.4 Product portfolio
10.14.5 Business performance
10.14.6 Key strategic moves and developments
10.15 Johnson Controls, inc.
10.15.1 Company overview
10.15.2 Company snapshot
10.15.3 Operating business segments
10.15.4 Product portfolio
10.15.5 Business performance
10.15.6 Key strategic moves and developments
10.16 Lithium Wrecks
10.16.1 Company overview
10.16.2 Company snapshot
10.16.3 Operating business segments
10.16.4 Product portfolio
10.16.5 Business performance
10.16.6 Key strategic moves and developments
10.17 Mitsubishi Electric Corporation
10.17.1 Company overview
10.17.2 Company snapshot
10.17.3 Operating business segments
10.17.4 Product portfolio
10.17.5 Business performance
10.17.6 Key strategic moves and developments
Note: Details on financial performance and strategic moves and developments may not be captured for unlisted companies.
LIST OF TABLES
TABLE 01. LITHIUM-ION BATTERY RECYCLING MARKET, BY REGION, 2020-2030 ($MILLION)
TABLE 02. GLOBAL EV BATTERY REUSE MARKET, BY SOURCE, 2021-2031 ($MILLION)
TABLE 03. GLOBAL EV BATTERY REUSE MARKET, FOR BATTERY ELECTRIC VEHICLES (BEVS), BY REGION, 2021-2031 ($MILLION)
TABLE 04. GLOBAL EV BATTERY REUSE MARKET, FOR HYBRID ELECTRIC VEHICLE (HEV), BY REGION, 2021-2031 ($MILLION)
TABLE 05. GLOBAL EV BATTERY REUSE MARKET, FOR PLUG-IN HYBRID ELECTRIC VEHICLE (PHEV), BY REGION, 2021-2031 ($MILLION)
TABLE 06. GLOBAL EV BATTERY REUSE MARKET, FOR FUEL CELL ELECTRIC VEHICLE (FCEV), BY REGION, 2021-2031 ($MILLION)
TABLE 07. GLOBAL EV BATTERY REUSE MARKET, BY BATTERY CHEMISTRY, 2021-2031 ($MILLION)
TABLE 08. GLOBAL EV BATTERY REUSE MARKET, FOR LITHIUM-IRON PHOSPHATE, BY REGION, 2021-2031 ($MILLION)
TABLE 09. GLOBAL EV BATTERY REUSE MARKET, FOR LITHIUM-MANGANESE OXIDE, BY REGION, 2021-2031 ($MILLION)
TABLE 10. GLOBAL EV BATTERY REUSE MARKET, FOR LITHIUM-NICKEL-COBALT-ALUMINUM OXIDE, BY REGION, 2021-2031 ($MILLION)
TABLE 11. GLOBAL EV BATTERY REUSE MARKET, FOR LITHIUM-NICKEL-MANGANESE COBALT, BY REGION, 2021-2031 ($MILLION)
TABLE 12. GLOBAL EV BATTERY REUSE MARKET, FOR LITHIUM-TITANATE OXIDE, BY REGION, 2021-2031 ($MILLION)
TABLE 13. GLOBAL EV BATTERY REUSE MARKET, BY VEHICLE TYPE, 2021-2031 ($MILLION)
TABLE 14. GLOBAL EV BATTERY REUSE MARKET, FOR PASSENGER CARS, BY REGION, 2021-2031 ($MILLION)
TABLE 15. GLOBAL EV BATTERY REUSE MARKET, FOR COMMERCIAL VEHICLES, BY REGION, 2021-2031 ($MILLION)
TABLE 16. GLOBAL EV BATTERY REUSE MARKET, BY APPLICATION, 2021-2031 ($MILLION)
TABLE 17. GLOBAL EV BATTERY REUSE MARKET, FOR LOW SPEED VEHICLES, BY REGION, 2021-2031 ($MILLION)
TABLE 18. GFLOBAL EV BATTERY REUSE MARKET, FOR BASE STATIONS, BY REGION, 2021-2031 ($MILLION)
TABLE 19. GLOBAL EV BATTERY REUSE MARKET, FOR EV CHARGING, BY REGION, 2021-2031 ($MILLION)
TABLE 20. GLOBAL EV BATTERY REUSE MARKET, FOR ENERGY STORAGE, BY REGION, 2021-2031 ($MILLION)
TABLE 21. GLOBAL EV BATTERY REUSE MARKET, BY REGION, 2021-2031 ($MILLION)
TABLE 22. NORTH AMERICA EV BATTERY REUSE MARKET, BY SOURCE, 2021-2031 ($MILLION)
TABLE 23. NORTH AMERICA EV BATTERY REUSE MARKET, BY BATTERY CHEMISTRY, 2021-2031 ($MILLION)
TABLE 24. NORTH AMERICA EV BATTERY REUSE MARKET, BY VEHICLE TYPE, 2021-2031 ($MILLION)
TABLE 25. NORTH AMERICA EV BATTERY REUSE MARKET, BY APPLICATION, 2021-2031 ($MILLION)
TABLE 26. NORTH AMERICA EV BATTERY REUSE MARKET, BY COUNTRY, 2021-2031 ($MILLION)
TABLE 27. U.S. EV BATTERY REUSE MARKET, BY SOURCE, 2021-2031 ($MILLION)
TABLE 28. U.S. EV BATTERY REUSE MARKET, BY BATTERY CHEMISTRY, 2021-2031 ($MILLION)
TABLE 29. U.S. EV BATTERY REUSE MARKET, BY VEHICLE TYPE, 2021-2031 ($MILLION)
TABLE 30. U.S. EV BATTERY REUSE MARKET, BY APPLICATION, 2021-2031 ($MILLION)
TABLE 31. CANADA EV BATTERY REUSE MARKET, BY SOURCE, 2021-2031 ($MILLION)
TABLE 32. CANADA EV BATTERY REUSE MARKET, BY BATTERY CHEMISTRY, 2021-2031 ($MILLION)
TABLE 33. CANADA EV BATTERY REUSE MARKET, BY VEHICLE TYPE, 2021-2031 ($MILLION)
TABLE 34. CANADA EV BATTERY REUSE MARKET, BY APPLICATION, 2021-2031 ($MILLION)
TABLE 35. MEXICO EV BATTERY REUSE MARKET, BY SOURCE, 2021-2031 ($MILLION)
TABLE 36. MEXICO EV BATTERY REUSE MARKET, BY BATTERY CHEMISTRY, 2021-2031 ($MILLION)
TABLE 37. MEXICO EV BATTERY REUSE MARKET, BY VEHICLE TYPE, 2021-2031 ($MILLION)
TABLE 38. MEXICO EV BATTERY REUSE MARKET, BY APPLICATION, 2021-2031 ($MILLION)
TABLE 39. EUROPE EV BATTERY REUSE MARKET, BY SOURCE, 2021-2031 ($MILLION)
TABLE 40. EUROPE EV BATTERY REUSE MARKET, BY BATTERY CHEMISTRY, 2021-2031 ($MILLION)
TABLE 41. EUROPE EV BATTERY REUSE MARKET, BY VEHICLE TYPE, 2021-2031 ($MILLION)
TABLE 42. EUROPE EV BATTERY REUSE MARKET, BY APPLICATION, 2021-2031 ($MILLION)
TABLE 43. EUROPE EV BATTERY REUSE MARKET, BY COUNTRY, 2021-2031 ($MILLION)
TABLE 44. GERMANY EV BATTERY REUSE MARKET, BY SOURCE, 2021-2031 ($MILLION)
TABLE 45. GERMANY EV BATTERY REUSE MARKET, BY BATTERY CHEMISTRY, 2021-2031 ($MILLION)
TABLE 46. GERMANY EV BATTERY REUSE MARKET, BY VEHICLE TYPE, 2021-2031 ($MILLION)
TABLE 47. GERMANY EV BATTERY REUSE MARKET, BY APPLICATION, 2021-2031 ($MILLION)
TABLE 48. FRANCE EV BATTERY REUSE MARKET, BY SOURCE, 2021-2031 ($MILLION)
TABLE 49. FRANCE EV BATTERY REUSE MARKET, BY BATTERY CHEMISTRY, 2021-2031 ($MILLION)
TABLE 50. FRANCE EV BATTERY REUSE MARKET, BY VEHICLE TYPE, 2021-2031 ($MILLION)
TABLE 51. FRANCE EV BATTERY REUSE MARKET, BY APPLICATION, 2021-2031 ($MILLION)
TABLE 52. ITALY EV BATTERY REUSE MARKET, BY SOURCE, 2021-2031 ($MILLION)
TABLE 53. ITALY EV BATTERY REUSE MARKET, BY BATTERY CHEMISTRY, 2021-2031 ($MILLION)
TABLE 54. ITALY EV BATTERY REUSE MARKET, BY VEHICLE TYPE, 2021-2031 ($MILLION)
TABLE 55. ITALY EV BATTERY REUSE MARKET, BY APPLICATION, 2021-2031 ($MILLION)
TABLE 56. SPAIN EV BATTERY REUSE MARKET, BY SOURCE, 2021-2031 ($MILLION)
TABLE 57. SPAIN EV BATTERY REUSE MARKET, BY BATTERY CHEMISTRY, 2021-2031 ($MILLION)
TABLE 58. SPAIN EV BATTERY REUSE MARKET, BY VEHICLE TYPE, 2021-2031 ($MILLION)
TABLE 59. SPAIN EV BATTERY REUSE MARKET, BY APPLICATION, 2021-2031 ($MILLION)
TABLE 60. UK EV BATTERY REUSE MARKET, BY SOURCE, 2021-2031 ($MILLION)
TABLE 61. UK EV BATTERY REUSE MARKET, BY BATTERY CHEMISTRY, 2021-2031 ($MILLION)
TABLE 62. UK EV BATTERY REUSE MARKET, BY VEHICLE TYPE, 2021-2031 ($MILLION)
TABLE 63. UK EV BATTERY REUSE MARKET, BY APPLICATION, 2021-2031 ($MILLION)
TABLE 64. REST OF EUROPE EV BATTERY REUSE MARKET, BY SOURCE, 2021-2031 ($MILLION)
TABLE 65. REST OF EUROPE EV BATTERY REUSE MARKET, BY BATTERY CHEMISTRY, 2021-2031 ($MILLION)
TABLE 66. REST OF EUROPE EV BATTERY REUSE MARKET, BY VEHICLE TYPE, 2021-2031 ($MILLION)
TABLE 67. REST OF EUROPE EV BATTERY REUSE MARKET, BY APPLICATION, 2021-2031 ($MILLION)
TABLE 68. ASIA-PACIFIC EV BATTERY REUSE MARKET, BY SOURCE, 2021-2031 ($MILLION)
TABLE 69. ASIA-PACIFIC EV BATTERY REUSE MARKET, BY BATTERY CHEMISTRY, 2021-2031 ($MILLION)
TABLE 70. ASIA-PACIFIC EV BATTERY REUSE MARKET, BY VEHICLE TYPE, 2021-2031 ($MILLION)
TABLE 71. ASIA-PACIFIC EV BATTERY REUSE MARKET, BY APPLICATION, 2021-2031 ($MILLION)
TABLE 72. ASIA-PACIFIC EV BATTERY REUSE MARKET, BY COUNTRY, 2021-2031 ($MILLION)
TABLE 73. CHINA EV BATTERY REUSE MARKET, BY SOURCE, 2021-2031 ($MILLION)
TABLE 74. CHINA EV BATTERY REUSE MARKET, BY BATTERY CHEMISTRY, 2021-2031 ($MILLION)
TABLE 75. CHINA EV BATTERY REUSE MARKET, BY VEHICLE TYPE, 2021-2031 ($MILLION)
TABLE 76. CHINA EV BATTERY REUSE MARKET, BY APPLICATION, 2021-2031 ($MILLION)
TABLE 77. JAPAN EV BATTERY REUSE MARKET, BY SOURCE, 2021-2031 ($MILLION)
TABLE 78. JAPAN EV BATTERY REUSE MARKET, BY BATTERY CHEMISTRY, 2021-2031 ($MILLION)
TABLE 79. JAPAN EV BATTERY REUSE MARKET, BY VEHICLE TYPE, 2021-2031 ($MILLION)
TABLE 80. JAPAN EV BATTERY REUSE MARKET, BY APPLICATION, 2021-2031 ($MILLION)
TABLE 81. INDIA EV BATTERY REUSE MARKET, BY SOURCE, 2021-2031 ($MILLION)
TABLE 82. INDIA EV BATTERY REUSE MARKET, BY BATTERY CHEMISTRY, 2021-2031 ($MILLION)
TABLE 83. INDIA EV BATTERY REUSE MARKET, BY VEHICLE TYPE, 2021-2031 ($MILLION)
TABLE 84. INDIA EV BATTERY REUSE MARKET, BY APPLICATION, 2021-2031 ($MILLION)
TABLE 85. SOUTH KOREA EV BATTERY REUSE MARKET, BY SOURCE, 2021-2031 ($MILLION)
TABLE 86. SOUTH KOREA EV BATTERY REUSE MARKET, BY BATTERY CHEMISTRY, 2021-2031 ($MILLION)
TABLE 87. SOUTH KOREA EV BATTERY REUSE MARKET, BY VEHICLE TYPE, 2021-2031 ($MILLION)
TABLE 88. SOUTH KOREA EV BATTERY REUSE MARKET, BY APPLICATION, 2021-2031 ($MILLION)
TABLE 89. AUSTRALIA EV BATTERY REUSE MARKET, BY SOURCE, 2021-2031 ($MILLION)
TABLE 90. AUSTRALIA EV BATTERY REUSE MARKET, BY BATTERY CHEMISTRY, 2021-2031 ($MILLION)
TABLE 91. AUSTRALIA EV BATTERY REUSE MARKET, BY VEHICLE TYPE, 2021-2031 ($MILLION)
TABLE 92. AUSTRALIA EV BATTERY REUSE MARKET, BY APPLICATION, 2021-2031 ($MILLION)
TABLE 93. REST OF ASIA-PACIFIC EV BATTERY REUSE MARKET, BY SOURCE, 2021-2031 ($MILLION)
TABLE 94. REST OF ASIA-PACIFIC EV BATTERY REUSE MARKET, BY BATTERY CHEMISTRY, 2021-2031 ($MILLION)
TABLE 95. REST OF ASIA-PACIFIC EV BATTERY REUSE MARKET, BY VEHICLE TYPE, 2021-2031 ($MILLION)
TABLE 96. REST OF ASIA-PACIFIC EV BATTERY REUSE MARKET, BY APPLICATION, 2021-2031 ($MILLION)
TABLE 97. LAMEA EV BATTERY REUSE MARKET, BY SOURCE, 2021-2031 ($MILLION)
TABLE 98. LAMEA EV BATTERY REUSE MARKET, BY BATTERY CHEMISTRY, 2021-2031 ($MILLION)
TABLE 99. LAMEA EV BATTERY REUSE MARKET, BY VEHICLE TYPE, 2021-2031 ($MILLION)
TABLE 100. LAMEA EV BATTERY REUSE MARKET, BY APPLICATION, 2021-2031 ($MILLION)
TABLE 101. LAMEA EV BATTERY REUSE MARKET, BY COUNTRY, 2021-2031 ($MILLION)
TABLE 102. BRAZIL EV BATTERY REUSE MARKET, BY SOURCE, 2021-2031 ($MILLION)
TABLE 103. BRAZIL EV BATTERY REUSE MARKET, BY BATTERY CHEMISTRY, 2021-2031 ($MILLION)
TABLE 104. BRAZIL EV BATTERY REUSE MARKET, BY VEHICLE TYPE, 2021-2031 ($MILLION)
TABLE 105. BRAZIL EV BATTERY REUSE MARKET, BY APPLICATION, 2021-2031 ($MILLION)
TABLE 106. SAUDI ARABIA EV BATTERY REUSE MARKET, BY SOURCE, 2021-2031 ($MILLION)
TABLE 107. SAUDI ARABIA EV BATTERY REUSE MARKET, BY BATTERY CHEMISTRY, 2021-2031 ($MILLION)
TABLE 108. SAUDI ARABIA EV BATTERY REUSE MARKET, BY VEHICLE TYPE, 2021-2031 ($MILLION)
TABLE 109. SAUDI ARABIA EV BATTERY REUSE MARKET, BY APPLICATION, 2021-2031 ($MILLION)
TABLE 110. SOUTH AFRICA EV BATTERY REUSE MARKET, BY SOURCE, 2021-2031 ($MILLION)
TABLE 111. SOUTH AFRICA EV BATTERY REUSE MARKET, BY BATTERY CHEMISTRY, 2021-2031 ($MILLION)
TABLE 112. SOUTH AFRICA EV BATTERY REUSE MARKET, BY VEHICLE TYPE, 2021-2031 ($MILLION)
TABLE 113. SOUTH AFRICA EV BATTERY REUSE MARKET, BY APPLICATION, 2021-2031 ($MILLION)
TABLE 114. REST OF LAMEA EV BATTERY REUSE MARKET, BY SOURCE, 2021-2031 ($MILLION)
TABLE 115. REST OF LAMEA EV BATTERY REUSE MARKET, BY BATTERY CHEMISTRY, 2021-2031 ($MILLION)
TABLE 116. REST OF LAMEA EV BATTERY REUSE MARKET, BY VEHICLE TYPE, 2021-2031 ($MILLION)
TABLE 117. REST OF LAMEA EV BATTERY REUSE MARKET, BY APPLICATION, 2021-2031 ($MILLION)
TABLE 118. KEY PRODUCT LAUNCHES (2018-2022)
TABLE 119. KEY EXPANSIONS (2018-2022)
TABLE 120. KEY ACQUISITIONS (2018-2022)
TABLE 121. KEY AGREEMENTS (2018-2022)
TABLE 122. KEY COLLABORATIONS (2018-2022)
TABLE 123. KEY JOINT VENTURE (2018-2022)
TABLE 124. KEY MERGER (2018-2022)
TABLE 125. ATTERO RECYCLING: COMPANY SNAPSHOT
TABLE 126. ATTERO RECYCLING: PRODUCT PORTFOLIO
TABLE 127. ATTERO RECYCLING: KEY STRATEGIC MOVES AND DEVELOPMENTS
TABLE 128. BMW GROUP: COMPANY SNAPSHOT
TABLE 129. BMW GROUP: OPERATING SEGMENTS
TABLE 130. BMW GROUP: PRODUCT PORTFOLIO
TABLE 131. OVERALL FINANCIAL STATUS ($MILLION)
TABLE 132. BMW GROUP: KEY STRATEGIC MOVES AND DEVELOPMENTS
TABLE 133. BYD CO, LTD.: COMPANY SNAPSHOT
TABLE 134. BYD CO, LTD..: PRODUCT PORTFOLIO
TABLE 135. BYD CO, LTD.: KEY STRATEGIC MOVES AND DEVELOPMENTS
TABLE 136. ENVISION AESC: COMPANY SNAPSHOT
TABLE 137. ENVISION AESC: PRODUCT PORTFOLIO
TABLE 138. ENVISION AESC: KEY STRATEGIC MOVES AND DEVELOPMENTS
TABLE 139. GENERAL MOTORS: COMPANY SNAPSHOT
TABLE 140. GENERAL MOTORS.: OPERATING SEGMENTS
TABLE 141. GENERAL MOTORS: PRODUCT PORTFOLIO
TABLE 142. OVERALL FINANCIAL STATUS ($MILLION)
TABLE 143. GENERAL MOTORS: KEY STRATEGIC MOVES AND DEVELOPMENTS
TABLE 144. GLOBAL BATTERY SOLUTIONS, LTD.: COMPANY SNAPSHOT
TABLE 145. GLOBAL BATTERY SOLUTIONS, LTD.: PRODUCT PORTFOLIO
TABLE 146. GLOBAL BATTERY SOLUTIONS, LTD.: KEY STRATEGIC MOVES AND DEVELOPMENTS
TABLE 147. GRAVITA INDIA LTD.: COMPANY SNAPSHOT
TABLE 148. GRAVITA INDIA LTD.: OPERATING SEGMENTS
TABLE 149. GRAVITA INDIA LTD.: PRODUCT PORTFOLIO
TABLE 150. OVERALL FINANCIAL STATUS ($MILLION)
TABLE 151. GRAVITA INDIA LTD.: KEY STRATEGIC MOVES AND DEVELOPMENTS
TABLE 152. GS YUASA CORPORATION: COMPANY SNAPSHOT
TABLE 153. GS YUASA CORPORATION: OPERATING SEGMENTS
TABLE 154. GS YUASA CORPORATION: PRODUCT PORTFOLIO
TABLE 155. OVERALL FINANCIAL STATUS ($MILLION)
TABLE 156. LG CHEM LTD.: COMPANY SNAPSHOT
TABLE 157. LG CHEM LTD.: OPERATING SEGMENTS
TABLE 158. LG CHEM LTD.: PRODUCT PORTFOLIO
TABLE 159. OVERALL FINANCIAL STATUS ($MILLION)
TABLE 160. LG CHEM LTD.: KEY STRATEGIC MOVES AND DEVELOPMENTS
TABLE 161. LITHIUM WERKS: COMPANY SNAPSHOT
TABLE 162. LITHIUM WERKS: PRODUCT PORTFOLIO
TABLE 163. LITHIUM WERKS: KEY STRATEGIC MOVES AND DEVELOPMENTS
TABLE 164. MITSUBISHI ELECTRIC: COMPANY SNAPSHOT
TABLE 165. MITSUBISHI ELECTRIC: OPERATING SEGMENTS
TABLE 166. MITSUBISHI ELECTRIC: PRODUCT PORTFOLIO
TABLE 167. OVERALL FINANCIAL STATUS ($MILLION)
TABLE 168. MITSUBISHI ELECTRIC: KEY STRATEGIC MOVES AND DEVELOPMENTS
TABLE 169. NISSAN MOTOR CO., LTD.: COMPANY SNAPSHOT
TABLE 170. NISSAN MOTOR CO., LTD.: OPERATING SEGMENTS
TABLE 171. NISSAN MOTOR CO., LTD.: PRODUCT PORTFOLIO
TABLE 172. OVERALL FINANCIAL STATUS ($MILLION)
TABLE 173. NISSAN MOTOR CO., LTD.: KEY STRATEGIC MOVES AND DEVELOPMENTS
TABLE 174. SAMSUNG SDI CO., LTD: COMPANY SNAPSHOT
TABLE 175. SAMSUNG SDI CO., LTD: OPERATING SEGMENTS
TABLE 176. SAMSUNG SDI CO., LTD: PRODUCT PORTFOLIO
TABLE 177. OVERALL FINANCIAL STATUS ($MILLION)
TABLE 178. SAMSUNG SDI CO., LTD: KEY STRATEGIC MOVES AND DEVELOPMENTS
TABLE 179. STELLANTIS: COMPANY SNAPSHOT
TABLE 180. STELLANTIS: OPERATING SEGMENTS
TABLE 181. STELLANTIS: PRODUCT PORTFOLIO
TABLE 182. OVERALL FINANCIAL STATUS ($MILLION)
TABLE 183. STELLANTIS: KEY STRATEGIC MOVES AND DEVELOPMENTS
TABLE 184. TESLA INC.:COMPANY SNAPSHOT
TABLE 185. TESLA INC.: OPERATING SEGMENTS
TABLE 186. TESLA INC.: PRODUCT PORTFOLIO
TABLE 187. OVERALL FINANCIAL STATUS ($MILLION)
TABLE 188. TOSHIBA CORPORATION: COMPANY SNAPSHOT
TABLE 189. TOSHIBA CORPORATION: OPERATING SEGMENTS
TABLE 190. TOSHIBA CORPORATION: PRODUCT PORTFOLIO
TABLE 191. OVERALL FINANCIAL STATUS ($MILLION)
TABLE 192. TOSHIBA CORPORATION: KEY STRATEGIC MOVES AND DEVELOPMENTS
TABLE 193. TOYOTA MOTOR CORPORATION: COMPANY SNAPSHOT
TABLE 194. TOYOTA MOTOR CORPORATION: OPERATING SEGMENTS
TABLE 195. TOYOTA MOTOR CORPORATION: PRODUCT PORTFOLIO
TABLE 196. OVERALL FINANCIAL STATUS ($MILLION)
TABLE 197. TOYOTA MOTOR CORPORATION: KEY STRATEGIC MOVES AND DEVELOPMENTS
LIST OF FIGURES
FIGURE 01. EV BATTERY REUSE MARKET SNAPSHOT, BY SEGMENTATION, 2022–2031
FIGURE 02. EV BATTERY REUSE MARKET SNAPSHOT, BY REGION, 2022–2031
FIGURE 03. EV BATTERY REUSE MARKET SEGMENTATION
FIGURE 04. TOP INVESTMENT POCKETS
FIGURE 05. MODERATE BARGAINING POWER OF SUPPLIERS
FIGURE 06. MODERATE THREAT OF NEW ENTRANTS
FIGURE 07. MODERATE THREAT OF SUBSTITUTES
FIGURE 08. MODERATE INTENSITY OF COMPETITIVE RIVALRY
FIGURE 09. MODERATE BARGAINING POWER OF BUYERS
FIGURE 10. EV BATTERY REUSE MARKET DYNAMICS
FIGURE 11. VALUE CHAIN ANALYSIS
FIGURE 12. COMPONENTS OF A LITHIUM-ION BATTERY
FIGURE 13. COST COMPONENTS OF A LITHIUM-ION BATTERY
FIGURE 14. LITHIUM RESERVES, BY COUNTRY
FIGURE 15. MANGANESE RESERVES, BY COUNTRY
FIGURE 16. COBALT RESERVES, BY COUNTRY
FIGURE 17. NICKEL RESERVES, BY COUNTRY
FIGURE 18. GRAPHITE RESERVES, BY COUNTRY
FIGURE 19. GLOBAL EV BATTERY REUSE MARKET, BY SOURCE, 2022–2031 ($MILLION)
FIGURE 20. COMPARATIVE ANALYSIS OF EV BATTERY REUSE MARKET, FOR BATTERY ELECTRIC VEHICLES (BEVS) BY COUNTRY, 2022 & 2031 ($MILLION)
FIGURE 21. COMPARATIVE ANALYSIS OF EV BATTERY REUSE MARKET, FOR HYBRID ELECTRIC VEHICLE (HEV) BY COUNTRY, 2022 & 2031 ($MILLION)
FIGURE 22. COMPARATIVE ANALYSIS OF EV BATTERY REUSE MARKET, FOR PLUG-IN HYBRID ELECTRIC VEHICLE (PHEV) BY COUNTRY, 2022 & 2031 ($MILLION)
FIGURE 23. COMPARATIVE ANALYSIS OF EV BATTERY REUSE MARKET, FOR FUEL CELL ELECTRIC VEHICLE (FCEV) BY COUNTRY, 2022 & 2031 ($MILLION)
FIGURE 24. GLOBAL EV BATTERY REUSE MARKET, BY BATTERY CHEMISTRY, 2022–2031 ($MILLION)
FIGURE 25. COMPARATIVE ANALYSIS OF EV BATTERY REUSE MARKET, FOR LITHIUM-IRON PHOSPHATE BY COUNTRY, 2022 & 2031 ($MILLION)
FIGURE 26. COMPARATIVE ANALYSIS OF EV BATTERY REUSE MARKET, FOR LITHIUM-MANGANESE OXIDE BY COUNTRY, 2022 & 2031 ($MILLION)
FIGURE 27. COMPARATIVE ANALYSIS OF EV BATTERY REUSE MARKET, FOR LITHIUM-NICKEL-COBALT-ALUMINUM OXIDE BY COUNTRY, 2022 & 2031 ($MILLION)
FIGURE 28. COMPARATIVE ANALYSIS OF EV BATTERY REUSE MARKET, FOR LITHIUM-NICKEL-MANGANESE COBALT BY COUNTRY, 2022 & 2031 ($MILLION)
FIGURE 29. COMPARATIVE ANALYSIS OF EV BATTERY REUSE MARKET, FOR LITHIUM-TITANATE OXIDE BY COUNTRY, 2022 & 2031 ($MILLION)
FIGURE 30. GLOBAL EV BATTERY REUSE MARKET, BY VEHICLE TYPE, 2022–2031 ($MILLION)
FIGURE 31. COMPARATIVE ANALYSIS OF EV BATTERY REUSE MARKET FOR PASSENGER CARS, BY COUNTRY, 2022 & 2031 ($MILLION)
FIGURE 32. COMPARATIVE ANALYSIS OF EV BATTERY REUSE MARKET FOR COMMERCIAL VEHICLES, BY COUNTRY, 2022 & 2031 ($MILLION)
FIGURE 33. GLOBAL EV BATTERY REUSE MARKET, BY APPLICATION, 2022–2031 ($MILLION)
FIGURE 34. COMPARATIVE ANALYSIS OF EV BATTERY REUSE MARKET FOR LOW SPEED VEHICLES, BY COUNTRY, 2022 & 2031 ($MILLION)
FIGURE 35. COMPARATIVE ANALYSIS OF EV BATTERY REUSE MARKET FOR BASE STATIONS, BY COUNTRY, 2022 & 2031 ($MILLION)
FIGURE 36. COMPARATIVE ANALYSIS OF EV BATTERY REUSE MARKET FOR EV CHARGING, BY COUNTRY, 2022 & 2031 ($MILLION)
FIGURE 37. COMPARATIVE ANALYSIS OF EV BATTERY REUSE MARKET FOR ENERGY STORAGE, BY COUNTRY, 2022 & 2031 ($MILLION)
FIGURE 38. U.S. EV BATTERY REUSE MARKET, 2021–2031 ($MILLION)
FIGURE 39. CANADA EV BATTERY REUSE MARKET, 2021–2031 ($MILLION)
FIGURE 40. MEXICO EV BATTERY REUSE MARKET, 2021–2031 ($MILLION)
FIGURE 41. GERMANY EV BATTERY REUSE MARKET, 2021–2031 ($MILLION)
FIGURE 42. FRANCE EV BATTERY REUSE MARKET, 2021–2031 ($MILLION)
FIGURE 43. ITALY EV BATTERY REUSE MARKET, 2021–2031 ($MILLION)
FIGURE 44. SPAIN EV BATTERY REUSE MARKET, 2021–2031 ($MILLION)
FIGURE 45. UK EV BATTERY REUSE MARKET, 2021–2031 ($MILLION)
FIGURE 46. REST OF EUROPE EV BATTERY REUSE MARKET, 2021–2031 ($MILLION)
FIGURE 47. CHINA EV BATTERY REUSE MARKET, 2021–2031 ($MILLION)
FIGURE 48. JAPAN EV BATTERY REUSE MARKET, 2021–2031 ($MILLION)
FIGURE 49. INDIA EV BATTERY REUSE MARKET, 2021–2031 ($MILLION)
FIGURE 50. SOUTH KOREA EV BATTERY REUSE MARKET, 2021–2031 ($MILLION)
FIGURE 51. AUSTRALIA EV BATTERY REUSE MARKET, 2021–2031 ($MILLION)
FIGURE 52. REST OF ASIA-PACIFIC EV BATTERY REUSE MARKET, 2021–2031 ($MILLION)
FIGURE 53. BRAZIL EV BATTERY REUSE MARKET, 2021–2031 ($MILLION)
FIGURE 54. SAUDI ARABIA EV BATTERY REUSE MARKET, 2021–2031 ($MILLION)
FIGURE 55. SOUTH AFRICA EV BATTERY REUSE MARKET, 2021–2031 ($MILLION)
FIGURE 56. REST OF LAMEA EV BATTERY REUSE MARKET, 2021–2031 ($MILLION)
FIGURE 57. MARKET PLAYER POSITIONING, 2021
FIGURE 58. TOP WINNING STRATEGIES, BY YEAR, 2018-2022
FIGURE 59. TOP WINNING STRATEGIES, BY DEVELOPMENT, 2018-2022 (%)
FIGURE 60. TOP WINNING STRATEGIES, BY COMPANY, 2018-2022
FIGURE 61. PRODUCT MAPPING OF TOP 10 PLAYERS
FIGURE 62. COMPETITIVE HEATMAP OF KEY PLAYERS
FIGURE 63. BMW GROUP.: NET SALES, 2019–2021 ($MILLION)
FIGURE 64. BMW GROUP: REVENUE SHARE BY SEGMENT, 2021 (%)
FIGURE 65. BMW GROUP: REVENUE SHARE BY REGION, 2021 (%)
FIGURE 66. GENERAL MOTORS: NET SALES, 2019–2021 ($MILLION)
FIGURE 67. GENERAL MOTORS: REVENUE SHARE BY SEGMENT, 2021 (%)
FIGURE 68. GENERAL MOTORS: REVENUE SHARE BY REGION, 2021 (%)
FIGURE 69. GRAVITA INDIA LTD.: REVENUE, 2019–2021 ($MILLION)
FIGURE 70. GRAVITA INDIA LTD.: REVENUE SHARE BY SEGMENT, 2021 (%)
FIGURE 71. GRAVITA INDIA LTD.: REVENUE SHARE BY REGION, 2021 (%)
FIGURE 72. GS YUASA CORPORATION.: NET SALES, 2019–2021 ($MILLION)
FIGURE 73. GS YUASA CORPORATION: REVENUE SHARE BY SEGMENT, 2021 (%)
FIGURE 74. GS YUASA CORPORATION: REVENUE SHARE BY REGION, 2021 (%)
FIGURE 75. LG CHEM LTD.: REVENUE, 2019–2021 ($MILLION)
FIGURE 76. LG CHEM LTD.: REVENUE SHARE BY SEGMENT, 2021 (%)
FIGURE 77. LG CHEM LTD.: REVENUE SHARE BY REGION, 2021 (%)
FIGURE 78. MITSUBISHI ELECTRIC: NET SALES, 2019–2021 ($MILLION)
FIGURE 79. MITSUBISHI ELECTRIC: REVENUE SHARE BY SEGMENT, 2021 (%)
FIGURE 80. MITSUBISHI ELECTRIC: REVENUE SHARE BY REGION, 2021 (%)
FIGURE 81. NISSAN MOTOR CO., LTD.: NET SALES, 2019–2021 ($MILLION)
FIGURE 82. NISSAN MOTOR CO., LTD.: REVENUE SHARE BY SEGMENT, 2021 (%)
FIGURE 83. NISSAN MOTOR CO., LTD.: REVENUE SHARE BY REGION, 2021 (%)
FIGURE 84. SAMSUNG SDI CO., LTD: NET SALES, 2019–2021 ($MILLION)
FIGURE 85. SAMSUNG SDI CO., LTD: REVENUE SHARE BY SEGMENT, 2021 (%)
FIGURE 86. SAMSUNG SDI CO., LTD: REVENUE SHARE BY REGION, 2021 (%)
FIGURE 87. STELLANTIS: NET SALES, 2019–2021 ($MILLION)
FIGURE 88. STELLANTIS: REVENUE SHARE BY SEGMENT, 2021 (%)
FIGURE 89. TESLA INC.: REVENUE, 2019–2021 ($MILLION)
FIGURE 90. TESLA INC.: REVENUE SHARE BY SEGMENT, 2021 (%)
FIGURE 91. TOSHIBA CORPORATION: NET SALES, 2019–2021 ($MILLION)
FIGURE 92. TOSHIBA CORPORATION: REVENUE SHARE BY SEGMENT, 2021 (%)
FIGURE 93. TOSHIBA CORPORATION: REVENUE SHARE BY REGION, 2021 (%)
FIGURE 94. TOYOTA MOTOR CORPORATION: NET SALES, 2019–2021 ($MILLION)
FIGURE 95. TOYOTA MOTOR CORPORATION: REVENUE SHARE BY SEGMENT, 2021 (%)
FIGURE 96. TOYOTA MOTOR CORPORATION: REVENUE SHARE BY REGION, 2021 (%)
$5730
$6450
$9600
HAVE A QUERY?
OUR CUSTOMER

SIMILAR REPORTS