
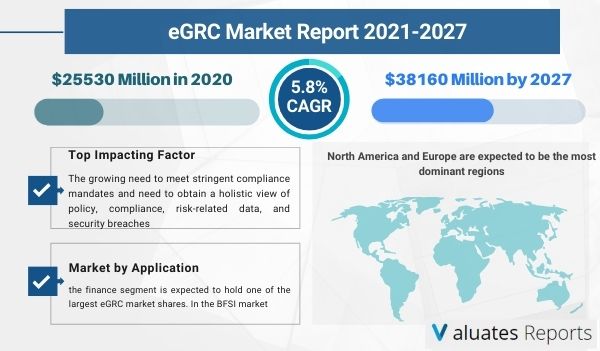
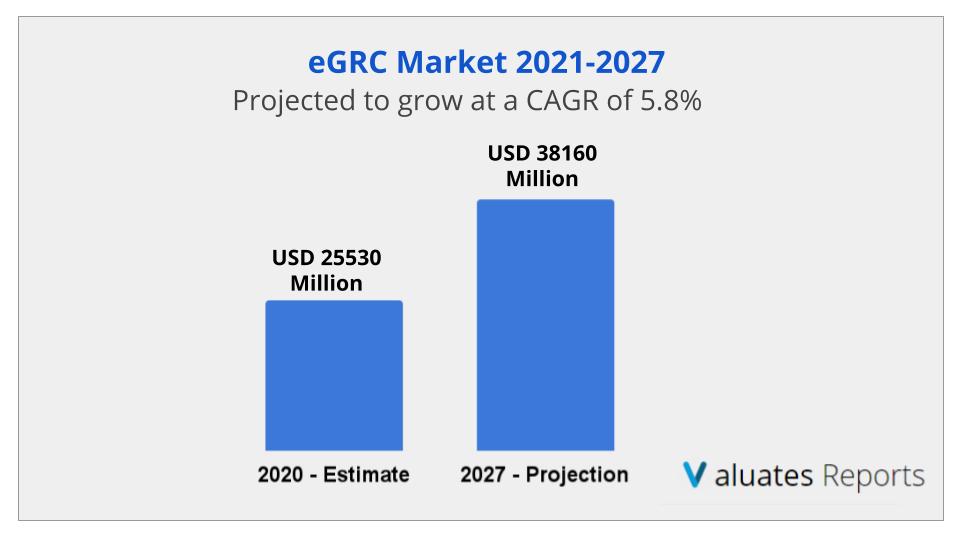
The global eGRC market size is projected to reach US$ 38160 million by 2027, from US$ 25530 million in 2020 at a Compound Annual Growth Rate (CAGR) of 5.8% during the forecast period 2021-2027. Key drivers of the eGRC market include the increasing use of data, growing business collaborations, and the need for better government regulations and compliance mandates. eGRC software basically automates much of the work related to risk management, compliance management, corporate and business objectives, etc. The main end-users of eGRC software are internal auditors, audit committees, risk and compliance managers, and accounts executives.
Other factors driving the growth of the eGRC market are rising cases of cyberattacks, money laundering practices, data thefts, and currency attacks due to rising debts. These widespread problems have increased the need for better governance and compliance management leading to the growth of the market during the forecast period. The rising adoption of eGRC software will continue in the coming years.
The complex regulatory environment and strict compliance standards set up by various government and state bodies increase the need for automation of complex business processes leading to wider adoption of eGRC software solutions. Regulations by GDPR( General Data Protection Regulation), NIST( the National Institute of Standards and Technology), and other federal bodies necessitate the need for eGRC software as non-compliance would lead to huge financial loss in the form of fines or penalties. Thus, a rise in regulatory mechanisms will drive the growth of the eGRC market during the forecast period.
The rising volume of data provides countless opportunities to business professionals in risk, audit, and compliance profiles to enhance and automate their tasks. Also analyzing and presenting huge volumes of data to stakeholders at the right time is becoming crucial. Thus, business enterprises are now taking the help of AI-powered solutions and blockchain technology to better analyze and meet ever-increasing compliance requirements. Integration of AI into eGRC software solutions is becoming increasingly important as they make the task efficient and automate a large part of the process. Hence AI and blockchain technology integration provides huge scope for the growth of the eGRC market during the forecast period.
An increase in cases of cyberattacks, money laundering, data theft, and currency attacks is leading to the growing adoption of eGRC software solutions for meeting increased compliance and for wider protection of data of business entities. The growing demand from emerging economies is expected to increase the growth of the eGRC market during the forecast period.
Due to the covid 19 outbreak, there has been an increase in the need for better risk and compliance management. As risk managers are finding it difficult to tackle the risks associated with the pandemic, the need of the hour is to deploy efficient risk optimization processes for ensuring business continuity. Hence business enterprises are now investing in smart technology like eGRC solutions for rapid risk management. Also, compliance managers across the globe are ensuring compliance with new standards and regulations set up by governments to contain the virus. Thus covid 19 has accelerated the growth of the eGRC market and will continue to rise further during the forecast period.
Based on region, North America and Europe are expected to hold the largest eGRC market share during the forecast period due to rising cyberattack threats for overreliance on digital resources by the masses.
Based on type, risk management is expected to hold the largest eGRC market share during the forecast period due to the growing need for risk management across various business enterprises.
Based on application, the finance segment is expected to provide lucrative opportunities for growth in the eGRC market share during the forecast period as the financial sector is under continuous pressure to enhance its overall performance and provide a smooth experience to the customers thereby deploying a framework for organizations to meet their regulatory and compliance-related requirements.
eGRC market is segmented by company, region (country), by Type, and by Application. Players, stakeholders, and other participants in the global eGRC market will be able to gain the upper hand as they use the report as a powerful resource. The segmental analysis focuses on revenue and forecast by Type and by Application in terms of revenue and forecast for the period 2016-2027.
|
Report Metric |
Details |
|
Report Name |
eGRC Market |
|
The market size in 2020 |
USD 25530 Million |
|
The revenue forecast in 2027 |
USD 38160 Million |
|
Growth Rate |
CAGR of 5.8% from 2021 to 2027 |
|
Market size available for years |
2021-2027 |
|
Forecast units |
Value (USD) |
|
Segments covered |
Type, End-User, Offerings, and Region |
|
Market by Type |
Audit Management, Compliance Management, Risk Management, Policy Management, Incident Management, Others |
|
Market by Applications/Enduser |
Finance, IT, Legal, Operations |
|
Report coverage |
Revenue & volume forecast, company share, competitive landscape, growth factors, and trends |
|
Geographic regions covered |
North America, Europe, Asia Pacific, Latin America, Middle East & Africa |
Ans. The global eGRC market size is projected to reach US$ 38160 million by 2027, from US$ 25530 million in 2020, at a CAGR of 5.8% during 2021-2027.
Ans. The increasing use of data across organisations and growing business collaborations results in a complex business environment and ever increasing difficulty in adhering to government regulations and compliance mandates.
Ans. In the global eGRC industry, North America and Europe are expected to be the most dominant regions.
Ans. by the type of software, the risk management software is expected to have the largest eGRC market share,
Ans. The forecast period for the egrc market is 2021 to 2027.
Ans. The major vendors operating in the egrc market include IBM, Microsoft, SAp, SAS, Oracle, Bwise, FIS, Wolters Kluwer, Metricstream, Thomson Reuters, EMC (A Dell Company).
$3900
$5850
$7800
HAVE A QUERY?
OUR CUSTOMER
SIMILAR REPORTS