
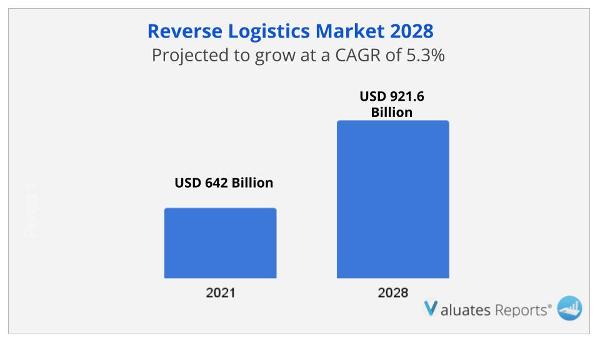
Due to the COVID-19 pandemic and Russia-Ukraine War Influence, the global Reverse logistics market estimated at USD 642 in the year 2021, is projected to reach a revised size of USD 921.6 Billion by 2028, growing at a CAGR of 5.3% during the forecast period 2021-2028.
The expansion and quick growth of the e-commerce sector, as well as the increasing need for returns and replacements, are both expected to stimulate the growth of the reverse logistics market.
The global logistics and e-commerce businesses have experienced tremendous growth in recent years as a result of the explosion of connectivity solutions. The growth of the e-commerce and logistics industries has created a global need for timely delivery and return services for the movement of goods in forward and reverse logistics. Since the debut of e-commerce ten years ago, the rate of returns for all retail sales has grown. This and other e-commerce return statistics are the result of a variety of elements, such as digital issues, consumer behaviour, and recently emerging e-commerce-specific business models. The reverse logistics industry is anticipated to increase as a result of this factor.
The market for reverse logistics is anticipated to increase as a result of the rising popularity of online shopping. The internet business will have unequalled growth in 2020, despite the fact that e-commerce has increased over the past 10 years. E-commerce is expected to grow 18% this year, demonstrating a shift in consumer behaviour that is here to stay and is likely to stay due to COVID-19's long-lasting consequences. US retail sales as a whole are forecast to drop this year. In an e-commerce-focused future, when customers are returning items at an increasing rate because any sustained disregard for reverse logistics would not be practical, retailers are at a critical juncture. Businesses must adopt new or upgrade existing holistic reverse logistics plans to reflect the capability's increasing importance.
Product recalls have increased as a result of government requirements for the quality of the automotive industry's products. Decentralized production has increased in the global automotive industry as demand for high-quality vehicle parts has grown. Deathly collisions can occur when a poor component is installed in a car, which portends the involvement of the government in accident prevention through the application of rules and regulations. The government's involvement in the development and application of vehicles for utility has contributed to the market's continued expansion for reverse logistics.
Because it maintains a smooth flow of commodities, reverse logistics is important. The process ends the life cycle of the product, cuts costs, increases value, and reduces risk. Reverse logistics creates value and increases client confidence by turning rubbish into sales. Businesses reuse, resell, and recycle returned goods. Reverse logistics that works cut distribution and storage expenses as well. The reverse logistics market is growing as a result of this factor.
Well-managed reverse logistics improve the environment and business culture while also generating financial gains. To keep customers and generate savings, the processes for what happens to products after delivery can be improved. The product data obtained through interactions with customers after delivery is an advantage of properly handled reverse logistics. Data allows a business to better understand its supply chain and improve its products and/or customer experiences.
During the projected period, Asia Pacific is anticipated to account for the greatest revenue share. Increased e-commerce usage is expected to improve regional returns, which will promote industry growth. Additionally, it is projected that the market would grow due to the rise of manufacturing companies in nearby emerging countries and the increased need for reverse logistics for electric vehicles. Due to the aforementioned factors, Asia Pacific regularly employs reverse logistics, which boosts revenue generating.
This report covers the Reverse Logistics segments by manufacturers, by type, by application, by region and country, and provides market size and CAGR for the history and forecast period (2017-2022, 2023-2028), considering 2021 as the base year. It elucidates potential revenue opportunities across different segments and explains attractive investment proposition matrices for this market.
|
Report Metric |
Details |
|
Report Name |
Reverse Logistics Market |
|
The market size in 2021 |
USD 642 Billion |
|
The revenue forecast in 2028 |
USD 921.6 Billion |
|
Growth Rate |
Compound Annual Growth Rate (CAGR) of 5.3% from 2022 to 2028 |
|
Market size available for years |
2022-2028 |
|
Forecast units |
Value (USD) |
|
Segments covered |
By Type, Application, and Region |
|
Report coverage |
Revenue & volume forecast, company share, competitive landscape, growth factors, and trends |
|
Geographic regions covered |
North America, Europe, Asia Pacific, Latin America, Middle East & Africa |
Ans. The global market for Reverse Logistics estimated at US$ 642 Billion in the year 2021, is projected to reach a revised size of US$ 921.6 Billion by 2028, growing at a CAGR of 5.3% during the forecast period 2022-2028.
Ans. The global market for Reverse Logistics is expected to grow at a compound annual growth rate of 5.3% from 2022 to 2028.
Ans. C.H. Robinson, DB Schenker, The Deutsche Post, FedEx, United Parcel Service (UPS), Kintetsu World Express, Core Logistic, Delivery Ontime Logistics, Delcart, Yusen Logistics, Safexpress.
Ans. Yes, The Chapter Cost available for the forecasted year 2022 to 2028. You can also customised reports based on your requirements.
List of Tables
Table 1. Global Market Reverse Logistics Market Size (US$ Million) Comparison by Region 2017 VS 2021 VS 2028
Table 2. Global Reverse Logistics Market Size by Region (2017-2022) & (US$ Million)
Table 3. Global Reverse Logistics Market Size Share by Region (2017-2022)
Table 4. Global Reverse Logistics Forecasted Market Size by Region (2023-2028) & (US$ Million)
Table 5. Global Reverse Logistics Forecasted Market Size Share by Region (2023-2028)
Table 6. Global Reverse Logistics Market Size (US$ Million) by Type: 2017 VS 2021 VS 2028
Table 7. Global Reverse Logistics Market Size by Type (2017-2022) & (US$ Million)
Table 8. Global Reverse Logistics Revenue Market Share by Type (2017-2022)
Table 9. Global Reverse Logistics Forecasted Market Size by Type (2023-2028) & (US$ Million)
Table 10. Global Reverse Logistics Revenue Market Share by Type (2023-2028)
Table 11. Global Reverse Logistics Market Size (US$ Million) by Application: 2017 VS 2021 VS 2028
Table 12. Global Reverse Logistics Market Size by Application (2017-2022) & (US$ Million)
Table 13. Global Reverse Logistics Revenue Market Share by Application (2017-2022)
Table 14. Global Reverse Logistics Forecasted Market Size by Application (2023-2028) & (US$ Million)
Table 15. Global Reverse Logistics Revenue Market Share by Application (2023-2028)
Table 16. Global Reverse Logistics Revenue (US$ Million) by Players (2017-2022)
Table 17. Global Reverse Logistics Revenue Market Share by Players (2017-2022)
Table 18. Global Top Players Market Share by Company Type (Tier 1, Tier 2 and Tier 3) & (based on the Revenue in Reverse Logistics as of 2021)
Table 19. Date of Key Players Enter into Reverse Logistics Market
Table 20. Global Reverse Logistics Top Players Headquarters and Area Served
Table 21. Reverse Logistics Product Solution and Service
Table 22. Global Reverse Logistics Players Market Concentration Ratio (CR5 and HHI)
Table 23. Mergers & Acquisitions, Expansion Plans
Table 24. C.H. Robinson Basic Information List
Table 25. C.H. Robinson Description and Business Overview
Table 26. C.H. Robinson Reverse Logistics Products, Services and Solutions
Table 27. Revenue (US$ Million) in Reverse Logistics Business of C.H. Robinson (2017-2022)
Table 28. C.H. Robinson Recent Developments
Table 29. DB Schenker Basic Information List
Table 30. DB Schenker Description and Business Overview
Table 31. DB Schenker Reverse Logistics Products, Services and Solutions
Table 32. Revenue (US$ Million) in Reverse Logistics Business of DB Schenker (2017-2022)
Table 33. DB Schenker Recent Developments
Table 34. The Deutsche Post Basic Information List
Table 35. The Deutsche Post Description and Business Overview
Table 36. The Deutsche Post Reverse Logistics Products, Services and Solutions
Table 37. Revenue (US$ Million) in Reverse Logistics Business of The Deutsche Post (2017-2022)
Table 38. The Deutsche Post Recent Developments
Table 39. FedEx Basic Information List
Table 40. FedEx Description and Business Overview
Table 41. FedEx Reverse Logistics Products, Services and Solutions
Table 42. Revenue (US$ Million) in Reverse Logistics Business of FedEx (2017-2022)
Table 43. FedEx Recent Developments
Table 44. United Parcel Service (UPS) Basic Information List
Table 45. United Parcel Service (UPS) Description and Business Overview
Table 46. United Parcel Service (UPS) Reverse Logistics Products, Services and Solutions
Table 47. Revenue (US$ Million) in Reverse Logistics Business of United Parcel Service (UPS) (2017-2022)
Table 48. United Parcel Service (UPS) Recent Developments
Table 49. Kintetsu World Express Basic Information List
Table 50. Kintetsu World Express Description and Business Overview
Table 51. Kintetsu World Express Reverse Logistics Products, Services and Solutions
Table 52. Revenue (US$ Million) in Reverse Logistics Business of Kintetsu World Express (2017-2022)
Table 53. Kintetsu World Express Recent Developments
Table 54. Core Logistic Basic Information List
Table 55. Core Logistic Description and Business Overview
Table 56. Core Logistic Reverse Logistics Products, Services and Solutions
Table 57. Revenue (US$ Million) in Reverse Logistics Business of Core Logistic (2017-2022)
Table 58. Core Logistic Recent Developments
Table 59. Deliveryontime Logistics Basic Information List
Table 60. Deliveryontime Logistics Description and Business Overview
Table 61. Deliveryontime Logistics Reverse Logistics Products, Services and Solutions
Table 62. Revenue (US$ Million) in Reverse Logistics Business of Deliveryontime Logistics (2017-2022)
Table 63. Deliveryontime Logistics Recent Developments
Table 64. Delcart Basic Information List
Table 65. Delcart Description and Business Overview
Table 66. Delcart Reverse Logistics Products, Services and Solutions
Table 67. Revenue (US$ Million) in Reverse Logistics Business of Delcart (2017-2022)
Table 68. Delcart Recent Developments
Table 69. Yusen Logistics Basic Information List
Table 70. Yusen Logistics Description and Business Overview
Table 71. Yusen Logistics Reverse Logistics Products, Services and Solutions
Table 72. Revenue (US$ Million) in Reverse Logistics Business of Yusen Logistics (2017-2022)
Table 73. Yusen Logistics Recent Developments
Table 74. Safexpress Basic Information List
Table 75. Safexpress Description and Business Overview
Table 76. Safexpress Reverse Logistics Products, Services and Solutions
Table 77. Revenue (US$ Million) in Reverse Logistics Business of Safexpress (2017-2022)
Table 78. Safexpress Recent Developments
Table 79. North America Reverse Logistics Market Size by Country (2017-2022) & (US$ Million)
Table 80. North America Reverse Logistics Market Size by Country (2023-2028) & (US$ Million)
Table 81. Europe Reverse Logistics Market Size by Country (2017-2022) & (US$ Million)
Table 82. Europe Reverse Logistics Market Size by Country (2023-2028) & (US$ Million)
Table 83. Asia-Pacific Reverse Logistics Market Size by Region (2017-2022) & (US$ Million)
Table 84. Asia-Pacific Reverse Logistics Market Size by Region (2023-2028) & (US$ Million)
Table 85. Asia-Pacific Reverse Logistics Market Share by Region (2017-2022)
Table 86. Asia-Pacific Reverse Logistics Market Share by Region (2023-2028)
Table 87. Latin America Reverse Logistics Market Size by Country (2017-2022) & (US$ Million)
Table 88. Latin America Reverse Logistics Market Size by Country (2023-2028) & (US$ Million)
Table 89. Middle East & Africa Reverse Logistics Market Size by Country (2017-2022) & (US$ Million)
Table 90. Middle East & Africa Reverse Logistics Market Size by Country (2023-2028) & (US$ Million)
Table 91. Reverse Logistics Market Trends
Table 92. Reverse Logistics Market Drivers
Table 93. Reverse Logistics Market Challenges
Table 94. Reverse Logistics Market Restraints
Table 95. Research Programs/Design for This Report
Table 96. Key Data Information from Secondary Sources
Table 97. Key Data Information from Primary Sources
List of Figures
Figure 1. Global Reverse Logistics Market Size Year-over-Year 2017-2028 & (US$ Million)
Figure 2. Global Reverse Logistics Market Size (US$ Million), 2017 VS 2021 VS 2028
Figure 3. Global Reverse Logistics Market Share by Regions: 2021 VS 2028
Figure 4. Global Reverse Logistics Forecasted Market Size Share by Region (2023-2028)
Figure 5. North America Reverse Logistics Market Size Growth Rate (2017-2028) & (US$ Million)
Figure 6. Europe Reverse Logistics Market Size Growth Rate (2017-2028) & (US$ Million)
Figure 7. Asia-Pacific Reverse Logistics Market Size Growth Rate (2017-2028) & (US$ Million)
Figure 8. Latin America Reverse Logistics Market Size Growth Rate (2017-2028) & (US$ Million)
Figure 9. Middle East & Africa Reverse Logistics Market Size Growth Rate (2017-2028) & (US$ Million)
Figure 10. Global Reverse Logistics Market Size Share by Type in 2021 & 2028
Figure 11. Returning Merchandise/Product Market Size (US$ Million) & YoY Growth (2017-2028)
Figure 12. Reusable Packaging Market Size (US$ Million) & YoY Growth (2017-2028)
Figure 13. Remanufacturing, Redesigning, and Refurbishing Market Size (US$ Million) & YoY Growth (2017-2028)
Figure 14. Others Market Size (US$ Million) & YoY Growth (2017-2028)
Figure 15. Global Reverse Logistics Market Size Share by Application in 2021 & 2028
Figure 16. Packaging Market Size (US$ Million) & YoY Growth (2017-2028)
Figure 17. Consumer Electronic Market Size (US$ Million) & YoY Growth (2017-2028)
Figure 18. Pharmaceutical Market Size (US$ Million) & YoY Growth (2017-2028)
Figure 19. Retail Market Size (US$ Million) & YoY Growth (2017-2028)
Figure 20. Automotive Market Size (US$ Million) & YoY Growth (2017-2028)
Figure 21. Others Market Size (US$ Million) & YoY Growth (2017-2028)
Figure 22. Reverse Logistics Market Share by Company Type (Tier 1, Tier 2 and Tier 3): 2017 VS 2021
Figure 23. Global Top 5 and Top 10 Players Reverse Logistics Market Share in 2021
Figure 24. North America Reverse Logistics Market Share by Country (2017-2028)
Figure 25. U.S. Reverse Logistics Market Size (2017-2028) & (US$ Million)
Figure 26. Canada Reverse Logistics Market Size (2017-2028) & (US$ Million)
Figure 27. Germany Reverse Logistics Market Size (2017-2028) & (US$ Million)
Figure 28. France Reverse Logistics Market Size (2017-2028) & (US$ Million)
Figure 29. U.K. Reverse Logistics Market Size (2017-2028) & (US$ Million)
Figure 30. Italy Reverse Logistics Market Size (2017-2028) & (US$ Million)
Figure 31. Russia Reverse Logistics Market Size (2017-2028) & (US$ Million)
Figure 32. Asia-Pacific Reverse Logistics Market Share by Region (2017-2028)
Figure 33. China Reverse Logistics Market Size (2017-2028) & (US$ Million)
Figure 34. Japan Reverse Logistics Market Size (2017-2028) & (US$ Million)
Figure 35. South Korea Reverse Logistics Market Size (2017-2028) & (US$ Million)
Figure 36. India Reverse Logistics Market Size (2017-2028) & (US$ Million)
Figure 37. Australia Reverse Logistics Market Size (2017-2028) & (US$ Million)
Figure 38. Taiwan Reverse Logistics Market Size (2017-2028) & (US$ Million)
Figure 39. Indonesia Reverse Logistics Market Size (2017-2028) & (US$ Million)
Figure 40. Latin America Reverse Logistics Market Share by Country (2017-2028)
Figure 41. Mexico Reverse Logistics Market Size (2017-2028) & (US$ Million)
Figure 42. Brazil Reverse Logistics Market Size (2017-2028) & (US$ Million)
Figure 43. Argentina Reverse Logistics Market Size (2017-2028) & (US$ Million)
Figure 44. Middle East & Africa Reverse Logistics Market Share by Country (2017-2028)
Figure 45. Turkey Reverse Logistics Market Size (2017-2028) & (US$ Million)
Figure 46. Saudi Arabia Reverse Logistics Market Size (2017-2028) & (US$ Million)
Figure 47. U.A.E Reverse Logistics Market Size (2017-2028) & (US$ Million)
Figure 48. Bottom-up and Top-down Approaches for This Report
Figure 49. Data Triangulation
$3350
$6700
HAVE A QUERY?
OUR CUSTOMER

SIMILAR REPORTS