
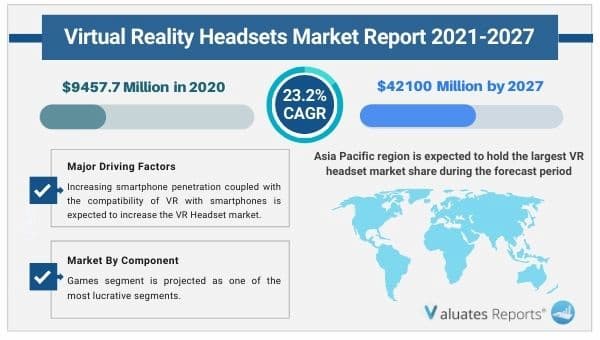
The global Virtual Reality Headsets market size is projected to reach US$ 42100 million by 2027, from US$ 9457.7 million in 2020, at a Compound Annual Growth Rate (CAGR) of 23.2% during the forecast period 2021-2027. Some of the major factors driving the growth of the VR Headsets market size are increasing VR headset adoption in advertising, gaming, automotive industry, growing smartphone market, and increasing technical expertise among vendors and consumers. Military and other research projects are using the Virtual Reality Headsets to enhance mental and well-being training programs.
The major regions covered in the report are North America, Europe, Asia-Pacific, South America, Middle East & Africa, etc. The Virtual Reality Headsets Market report provides a list of all the key players in the Virtual Reality Headsets market and a detailed analysis of the strategies the companies are adopting.
Virtual reality has tremendous potential to be integrated into a wide range of applications, including healthcare, education, and industrial prototyping. This widespread adoption is expected to increase the VR Headset market size.
The increasing R&D activities are expected to fuel the growth of the VR Headset market size. Augmented reality, Virtual reality, and wearable devices are rapidly converging, with changing technology application trends, allowing users to have immersive and interactive content. Furthermore, technological developments and advances in networking and connectivity are expected to fuel VR headset demand in the coming years.
The adoption of VR headsets in the retail industry is expected to increase the VR Headset market size during the forecast period. VR technology can change the consumer shopping experience in the areas of retail accessibility, consumer engagement, and better sharing of product information. Continuous research is being conducted to develop low-cost, wearable VR solutions for the mass market.
Asia Pacific region is expected to hold the largest VR headset market share during the forecast period. This dominance is attributed to the ongoing technological developments in developing countries, and increasing demand for high-end electronic devices.
North America, followed by Europe, has shown a high level of adoption of VR devices in the retail and manufacturing industries. Governments in the developed nations, such as the U.S. and Germany, are spending a significant amount on VR headsets for training security and military sector.
Ans. The global virtual reality headsets market size is projected to reach US$ 42100 million by 2027, from US$ 9457.7 million in 2020, at a Compound Annual Growth Rate (CAGR) of 23.2% during 2021-2027.
Ans. Increasing smartphone penetration coupled with the compatibility of virtual reality with smartphones is expected to increase the VR Headset market size.
Ans. Asia Pacific segment is expected to hold the largest VR headset market share during the forecast period.
Ans. Circumscribed Type, Integrated Type are the types of VR headset market.
Ans. To get latest version of virtual reality headsets market report can be obtained on demand from the website.
Table 1. Global Virtual Reality Headsets Market Size by Type (K Units) & (US$ Million) (2021 VS 2027)
Table 2. Global Virtual Reality Headsets Consumption (K Units) Comparison by Application: 2016 VS 2021 VS 2027
Table 3. Virtual Reality Headsets Market Size Comparison by Region: 2016 VS 2021 VS 2027
Table 4. Global Virtual Reality Headsets Production (K Units) by Manufacturers
Table 5. Global Virtual Reality Headsets Production (K Units) by Manufacturers (2016-2021)
Table 6. Global Virtual Reality Headsets Production Market Share by Manufacturers (2016-2021)
Table 7. Global Virtual Reality Headsets Revenue (US$ Million) by Manufacturers (2016-2021)
Table 8. Global Virtual Reality Headsets Revenue Share by Manufacturers (2016-2021)
Table 9. Company Type (Tier 1, Tier 2 and Tier 3) & (based on the Revenue in Virtual Reality Headsets as of 2020)
Table 10. Global Market Virtual Reality Headsets Average Price (USD/Unit) of Key Manufacturers (2016-2021)
Table 11. Manufacturers Virtual Reality Headsets Production Sites and Area Served
Table 12. Manufacturers Virtual Reality Headsets Product Types
Table 13. Mergers & Acquisitions, Expansion
Table 14. Global Virtual Reality Headsets Production (K Units) by Region (2016-2021)
Table 15. Global Virtual Reality Headsets Revenue (US$ Million) by Region (2016-2021)
Table 16. Global Virtual Reality Headsets Revenue Market Share by Region (2016-2021)
Table 17. Global Virtual Reality Headsets Production (K Units), Revenue (US$ Million), Price (USD/Unit) and Gross Margin (2016-2021)
Table 18. North America Virtual Reality Headsets Production (K Units), Revenue (US$ Million), Price (USD/Unit) and Gross Margin (2016-2021)
Table 19. Europe Virtual Reality Headsets Production (K Units), Revenue (US$ Million), Price (USD/Unit) and Gross Margin (2016-2021)
Table 20. China Virtual Reality Headsets Production (K Units), Revenue (US$ Million), Price (USD/Unit) and Gross Margin (2016-2021)
Table 21. Japan Virtual Reality Headsets Production (K Units), Revenue (US$ Million), Price (USD/Unit) and Gross Margin (2016-2021)
Table 22. South Korea Virtual Reality Headsets Production (K Units), Revenue (US$ Million), Price (USD/Unit) and Gross Margin (2016-2021)
Table 23. Global Virtual Reality Headsets Consumption Market by Region (2016-2021) & (K Units)
Table 24. Global Virtual Reality Headsets Consumption Market Share by Region (2016-2021)
Table 25. North America Virtual Reality Headsets Consumption by Country (2016-2021) & (K Units)
Table 26. Europe Virtual Reality Headsets Consumption by Country (2016-2021) & (K Units)
Table 27. Asia Pacific Virtual Reality Headsets Consumption by Region (2016-2021) & (K Units)
Table 28. Latin America Virtual Reality Headsets Consumption by Countries (2016-2021) & (K Units)
Table 29. Global Virtual Reality Headsets Production (K Units) by Type (2016-2021)
Table 30. Global Virtual Reality Headsets Production Market Share by Type (2016-2021)
Table 31. Global Virtual Reality Headsets Revenue (US$ Million) by Type (2016-2021)
Table 32. Global Virtual Reality Headsets Revenue Share by Type (2016-2021)
Table 33. Global Virtual Reality Headsets Price (USD/Unit) by Type (2016-2021)
Table 34. Global Virtual Reality Headsets Consumption by Application (2016-2021) & (K Units)
Table 35. Global Virtual Reality Headsets Consumption Market Share by Application (2016-2021)
Table 36. Global Virtual Reality Headsets Consumption Growth Rate by Application (2016-2021)
Table 37. Oculus Rift Virtual Reality Headsets Corporation Information
Table 38. Oculus Rift Specification and Application
Table 39. Oculus Rift Virtual Reality Headsets Production (K Units), Revenue (US$ Million), Price (USD/Unit) and Gross Margin (2016-2021)
Table 40. Oculus Rift Main Business and Markets Served
Table 41. Oculus Rift Recent Developments/Updates
Table 42. LG Virtual Reality Headsets Corporation Information
Table 43. LG Specification and Application
Table 44. LG Virtual Reality Headsets Production (K Units), Revenue (US$ Million), Price (USD/Unit) and Gross Margin (2016-2021)
Table 45. LG Main Business and Markets Served
Table 46. LG Recent Developments/Updates
Table 47. Sony PlayStation VR Virtual Reality Headsets Corporation Information
Table 48. Sony PlayStation VR Specification and Application
Table 49. Sony PlayStation VR Virtual Reality Headsets Production (K Units), Revenue (US$ Million), Price (USD/Unit) and Gross Margin (2016-2021)
Table 50. Sony PlayStation VR Main Business and Markets Served
Table 51. Sony PlayStation VR Recent Developments/Updates
Table 52. HTC Vive Virtual Reality Headsets Corporation Information
Table 53. HTC Vive Specification and Application
Table 54. HTC Vive Virtual Reality Headsets Production (K Units), Revenue (US$ Million), Price (USD/Unit) and Gross Margin (2016-2021)
Table 55. HTC Vive Main Business and Markets Served
Table 56. HTC Vive Recent Developments/Updates
Table 57. Samsung Gear VR Virtual Reality Headsets Corporation Information
Table 58. Samsung Gear VR Specification and Application
Table 59. Samsung Gear VR Virtual Reality Headsets Production (K Units), Revenue (US$ Million), Price (USD/Unit) and Gross Margin (2016-2021)
Table 60. Samsung Gear VR Main Business and Markets Served
Table 61. Samsung Gear VR Recent Developments/Updates
Table 62. Microsoft HoloLens Virtual Reality Headsets Corporation Information
Table 63. Microsoft HoloLens Specification and Application
Table 64. Microsoft HoloLens Virtual Reality Headsets Production (K Units), Revenue (US$ Million), Price (USD/Unit) and Gross Margin (2016-2021)
Table 65. Microsoft HoloLens Main Business and Markets Served
Table 66. Microsoft HoloLens Recent Developments/Updates
Table 67. FOVE VR Virtual Reality Headsets Corporation Information
Table 68. FOVE VR Specification and Application
Table 69. FOVE VR Virtual Reality Headsets Production (K Units), Revenue (US$ Million), Price (USD/Unit) and Gross Margin (2016-2021)
Table 70. FOVE VR Main Business and Markets Served
Table 71. FOVE VR Recent Developments/Updates
Table 72. Zeiss VR One Virtual Reality Headsets Corporation Information
Table 73. Zeiss VR One Specification and Application
Table 74. Zeiss VR One Virtual Reality Headsets Production (K Units), Revenue (US$ Million), Price (USD/Unit) and Gross Margin (2016-2021)
Table 75. Zeiss VR One Main Business and Markets Served
Table 76. Zeiss VR One Recent Developments/Updates
Table 77. Avegant Glyph Virtual Reality Headsets Corporation Information
Table 78. Avegant Glyph Specification and Application
Table 79. Avegant Glyph Virtual Reality Headsets Production (K Units), Revenue (US$ Million), Price (USD/Unit) and Gross Margin (2016-2021)
Table 80. Avegant Glyph Main Business and Markets Served
Table 81. Avegant Glyph Recent Developments/Updates
Table 82. Razer OSVR Virtual Reality Headsets Corporation Information
Table 83. Razer OSVR Specification and Application
Table 84. Razer OSVR Virtual Reality Headsets Production (K Units), Revenue (US$ Million), Price (USD/Unit) and Gross Margin (2016-2021)
Table 85. Razer OSVR Main Business and Markets Served
Table 86. Razer OSVR Recent Developments/Updates
Table 87. Google Cardboard Virtual Reality Headsets Corporation Information
Table 88. Google Cardboard Specification and Application
Table 89. Google Cardboard Virtual Reality Headsets Production (K Units), Revenue (US$ Million), Price (USD/Unit) and Gross Margin (2016-2021)
Table 90. Google Cardboard Main Business and Markets Served
Table 91. Google Cardboard Recent Developments/Updates
Table 92. Freefly VR headset Virtual Reality Headsets Corporation Information
Table 93. Freefly VR headset Specification and Application
Table 94. Freefly VR headset Virtual Reality Headsets Production (K Units), Revenue (US$ Million), Price (USD/Unit) and Gross Margin (2016-2021)
Table 95. Freefly VR headset Main Business and Markets Served
Table 96. Freefly VR headset Recent Developments/Updates
Table 97. Production Base and Market Concentration Rate of Raw Material
Table 98. Key Suppliers of Raw Materials
Table 99. Virtual Reality Headsets Distributors List
Table 100. Virtual Reality Headsets Customers List
Table 101. Virtual Reality Headsets Market Trends
Table 102. Virtual Reality Headsets Growth Drivers
Table 103. Virtual Reality Headsets Market Challenges
Table 104. Virtual Reality Headsets Market Restraints
Table 105. Global Virtual Reality Headsets Production (K Units) Forecast by Region (2022-2027)
Table 106. North America Virtual Reality Headsets Consumption Forecast by Country (2022-2027) & (K Units)
Table 107. Europe Virtual Reality Headsets Consumption Forecast by Country (2022-2027) & (K Units)
Table 108. Asia Pacific Virtual Reality Headsets Consumption Forecast by Region (2022-2027) & (K Units)
Table 109. Latin America Virtual Reality Headsets Consumption Forecast by Country (2022-2027) & (K Units)
Table 110. Global Virtual Reality Headsets Production Forecast by Type (2022-2027) & (K Units)
Table 111. Global Virtual Reality Headsets Revenue Forecast by Type (2022-2027) & (US$ Million)
Table 112. Global Virtual Reality Headsets Price Forecast by Type (2022-2027) & (USD/Unit)
Table 113. Global Virtual Reality Headsets Consumption (K Units) Forecast by Application (2022-2027)
Table 114. Research Programs/Design for This Report
Table 115. Key Data Information from Secondary Sources
Table 116. Key Data Information from Primary Sources
List of Figures
Figure 1. Product Picture of Virtual Reality Headsets
Figure 2. Global Virtual Reality Headsets Market Share by Type: 2020 VS 2027
Figure 3. Circumscribed Type Product Picture
Figure 4. Integrated Type Product Picture
Figure 5. Global Virtual Reality Headsets Market Share by Application: 2020 VS 2027
Figure 6. Games
Figure 7. Medicine
Figure 8. Film and Television
Figure 9. Other
Figure 10. Global Virtual Reality Headsets Revenue (US$ Million), 2016 VS 2021 VS 2027
Figure 11. Global Virtual Reality Headsets Revenue (US$ Million) (2016-2027)
Figure 12. Global Virtual Reality Headsets Production (K Units) & (2016-2027)
Figure 13. North America Virtual Reality Headsets Revenue (US$ Million) and Growth Rate (2016-2027)
Figure 14. Europe Virtual Reality Headsets Revenue (US$ Million) and Growth Rate (2016-2027)
Figure 15. China Virtual Reality Headsets Revenue (US$ Million) and Growth Rate (2016-2027)
Figure 16. Japan Virtual Reality Headsets Revenue (US$ Million) and Growth Rate (2016-2027)
Figure 17. South Korea Virtual Reality Headsets Revenue (US$ Million) and Growth Rate (2016-2027)
Figure 18. Virtual Reality Headsets Production Share by Manufacturers in 2020
Figure 19. Global Virtual Reality Headsets Revenue Share by Manufacturers in 2020
Figure 20. Virtual Reality Headsets Market Share by Company Type (Tier 1, Tier 2 and Tier 3): 2016 VS 2020
Figure 21. Global Market Virtual Reality Headsets Average Price (USD/Unit) of Key Manufacturers in 2020
Figure 22. The Global 5 and 10 Largest Players: Market Share by Virtual Reality Headsets Revenue in 2020
Figure 23. Global Virtual Reality Headsets Production Market Share by Region (2016-2021)
Figure 24. North America Virtual Reality Headsets Production (K Units) Growth Rate (2016-2021)
Figure 25. Europe Virtual Reality Headsets Production (K Units) Growth Rate (2016-2021)
Figure 26. China Virtual Reality Headsets Production (K Units) Growth Rate (2016-2021)
Figure 27. Japan Virtual Reality Headsets Production (K Units) Growth Rate (2016-2021)
Figure 28. South Korea Virtual Reality Headsets Production (K Units) Growth Rate (2016-2021)
Figure 29. Global Virtual Reality Headsets Consumption Market Share by Region (2016-2021)
Figure 30. Global Virtual Reality Headsets Consumption Market Share by Region in 2020
Figure 31. North America Virtual Reality Headsets Consumption and Growth Rate (2016-2021) & (K Units)
Figure 32. North America Virtual Reality Headsets Consumption Market Share by Country in 2020
Figure 33. Canada Virtual Reality Headsets Consumption Growth Rate (2016-2021) & (K Units)
Figure 34. U.S. Virtual Reality Headsets Consumption Growth Rate (2016-2021) & (K Units)
Figure 35. Europe Virtual Reality Headsets Consumption Growth Rate (2016-2021) & (K Units)
Figure 36. Europe Virtual Reality Headsets Consumption Market Share by Country in 2020
Figure 37. Germany America Virtual Reality Headsets Consumption and Growth Rate (2016-2021) & (K Units)
Figure 38. France Virtual Reality Headsets Consumption and Growth Rate (2016-2021) & (K Units)
Figure 39. U.K. Virtual Reality Headsets Consumption and Growth Rate (2016-2021) & (K Units)
Figure 40. Italy Virtual Reality Headsets Consumption and Growth Rate (2016-2021) & (K Units)
Figure 41. Russia Virtual Reality Headsets Consumption and Growth Rate (2016-2021) & (K Units)
Figure 42. Asia Pacific Virtual Reality Headsets Consumption and Growth Rate (2016-2021) & (K Units)
Figure 43. Asia Pacific Virtual Reality Headsets Consumption Market Share by Regions in 2020
Figure 44. China Virtual Reality Headsets Consumption and Growth Rate (2016-2021) & (K Units)
Figure 45. Japan Virtual Reality Headsets Consumption and Growth Rate (2016-2021) & (K Units)
Figure 46. South Korea Virtual Reality Headsets Consumption and Growth Rate (2016-2021) & (K Units)
Figure 47. Taiwan Virtual Reality Headsets Consumption and Growth Rate (2016-2021) & (K Units)
Figure 48. Southeast Asia Virtual Reality Headsets Consumption and Growth Rate (2016-2021) & (K Units)
Figure 49. India Virtual Reality Headsets Consumption and Growth Rate (2016-2021) & (K Units)
Figure 50. Australia Virtual Reality Headsets Consumption and Growth Rate (2016-2021) & (K Units)
Figure 51. Latin America Virtual Reality Headsets Consumption and Growth Rate (2016-2021) & (K Units)
Figure 52. Latin America Virtual Reality Headsets Consumption Market Share by Country in 2020
Figure 53. Mexico Virtual Reality Headsets Consumption and Growth Rate (2016-2021) & (K Units)
Figure 54. Brazil Virtual Reality Headsets Consumption and Growth Rate (2016-2021) & (K Units)
Figure 55. Production Market Share of Virtual Reality Headsets by Type (2016-2021)
Figure 56. Production Market Share of Virtual Reality Headsets by Type in 2020
Figure 57. Revenue Share of Virtual Reality Headsets by Type (2016-2021)
Figure 58. Revenue Market Share of Virtual Reality Headsets by Type in 2020
Figure 59. Global Virtual Reality Headsets Consumption Market Share by Application (2016-2021)
Figure 60. Global Virtual Reality Headsets Consumption Market Share by Application in 2020
Figure 61. Global Virtual Reality Headsets Consumption Growth Rate by Application (2016-2021)
Figure 62. Key Raw Materials Price Trend
Figure 63. Manufacturing Cost Structure of Virtual Reality Headsets
Figure 64. Manufacturing Process Analysis of Virtual Reality Headsets
Figure 65. Virtual Reality Headsets Industrial Chain Analysis
Figure 66. Channels of Distribution
Figure 67. Distributors Profiles
Figure 68. Global Virtual Reality Headsets Production Market Share Forecast by Region (2022-2027)
Figure 69. North America Virtual Reality Headsets Production (K Units) Growth Rate Forecast (2022-2027)
Figure 70. Europe Virtual Reality Headsets Production (K Units) Growth Rate Forecast (2022-2027)
Figure 71. China Virtual Reality Headsets Production (K Units) Growth Rate Forecast (2022-2027)
Figure 72. Japan Virtual Reality Headsets Production (K Units) Growth Rate Forecast (2022-2027)
Figure 73. South Korea Virtual Reality Headsets Production (K Units) Growth Rate Forecast (2022-2027)
Figure 74. Global Forecasted Demand Analysis of Virtual Reality Headsets (2015-2027) & (K Units)
Figure 75. Global Virtual Reality Headsets Production Market Share Forecast by Type (2022-2027)
Figure 76. Global Virtual Reality Headsets Revenue Market Share Forecast by Type (2022-2027)
Figure 77. Global Virtual Reality Headsets Consumption Forecast by Application (2022-2027)
Figure 78. Bottom-up and Top-down Approaches for This Report
Figure 79. Data Triangulation
$3350
$6700
HAVE A QUERY?
OUR CUSTOMER
