
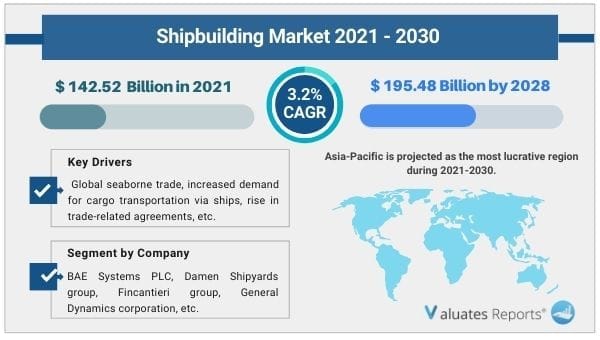
The global shipbuilding market size was valued at US$ 142.52 billion in 2020 and is projected to reach US$ 195.48 billion by 2030 growing at a CAGR of 3.2% during the forecast period. Key drivers of the shipbuilding market include the rising seaborne trade due to economic growth.
The increase in trade-related agreements and preference for cargo transportation through marine vessels will propel the growth of the shipbuilding market during the review period.
The rapid technological advancements and automation in shipbuilding will provide lucrative opportunities for market expansion in the coming years.
However, environmental hazards and fluctuations in transport, inventory costs will hamper the shipbuilding market growth during the forecast period.
Growing seaborne trade activities
The international seaborne trade is booming as bulk transportation of raw materials, import-export goods transfer, and finished goods supply happens through tankers, cargo ships, or bulk carriers. Globalization and economic liberalization have increased reliance on sea trade. The international shipping industry has become the lifeblood of the global economy with increased efficiency and reduced freight costs for consumers. Ships have become a crucial part of the supply chain management systems. This will drive the growth of the shipbuilding market during the review period.
Rising trade agreements and shipping transportation
Trade agreements between developed and developing nations are becoming free and flexible. Many countries are removing extra duties, taxes to promote the global import, export of goods and services. Suppliers are moving towards marine transportation as they are economical, have low maintenance costs, are flexible, and come in various sizes to fulfill all your needs for transporting bulky goods. These factors will propel the growth of the shipbuilding market in the coming years.
Advent of automation and advanced technologies in the shipbuilding industry
Robotic technologies and automation systems are being deployed gradually to manage the port, terminals, and shipbuilding processes. Robots essentially help in cutting, welding, stacking inventories, and managing tight schedules, routes for eliminating overlap or delays. Wireless monitoring with limited human interaction and smart vessels are being developed to revolutionize the shipping industry in the coming years. These constantly changing technologies will augment the growth of the shipbuilding market in the future.
Environmental risks and inventory, transport costs
The continuous changes in marine transport and inventory costs will create obstacles. Moreover, cargo ships generate environmental pollutants such as oil, chemical spills, garbage, underwater noise pollution, and the release of ballast water containing invasive aquatic species. Then there are hazards related to ships sinking, sediment contamination, etc. These problems will hamper the shipbuilding market growth during the subsequent years.
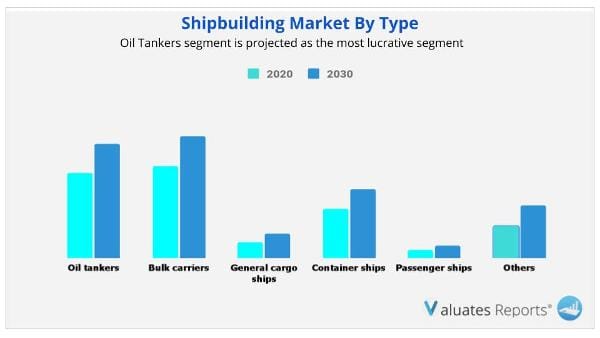
Based on type, the bulk carrier segment is expected to grow the highest in the shipbuilding market share. On the other hand, the oil tanker segment will grow the fastest during the forecast period.
Based on end-user, the transport segment will dominate in the shipbuilding market share due to increasing international trade and reliance on commercial ships and vessels.
Based on region, Asia-Pacific is expected to maintain its lead in the shipbuilding market share during the review period due to strong government support, low prices, competitiveness, and strong linkage industries.
| Report Metric | Details |
| Report Name | Shipbuilding Market |
| The market size in 2020 | 142.52 Billion USD |
| The revenue forecast in 2030 | 195.48 Billion USD |
| Growth Rate | CAGR of 3.2% from 2021 to 2030 |
| Market size available for years | 2021-2030 |
| Forecast units | Value (USD) |
| Segments covered | Type, End-User, Offerings, and Region |
| Report coverage | Revenue & volume forecast, company share, competitive landscape, growth factors, and trends |
| Geographic regions covered | North America, Europe, Asia Pacific, Latin America, Middle East & Africa |
Ans. The global shipbuilding market was valued at $142.52 billion in 2020, and is projected to reach $195.48 billion by 2030.
Ans. The global Computer Peripherals market is expected to grow at a compound annual growth rate of 3.2% from 2021 to 2030.
Ans. Some of the major companies are BAE Systems PLC, Damen Shipyards group, Fincantieri group, General Dynamics corporation, Huntington Ingalls industries, Korea Shipbuilding & Offshore Engineering, Mitsubishi Heavy Industries, Oshima Shipbuilding co. ltd, Samsuung Heavy Industries, and Sumitomo Heavy Industries.
CHAPTER 1:INTRODUCTION
1.1.Report description
1.2.Key benefits for stakeholders
1.3.Key market segments
1.4.Research methodology
1.4.1.Primary research
1.4.2.Secondary research
1.4.3.Analyst tools and models
CHAPTER 2:EXECUTIVE SUMMARY
2.1.CXO perspective
CHAPTER 3:MARKET OVERVIEW
3.1.Market definition and scope
3.2.Key findings
3.2.1.Top impacting factors
3.2.2.Top investment pockets
3.2.3.Top winning strategies
3.3.Porter’s five forces analysis
3.4.Key player positioning (2020)
3.5.Market dynamics
3.5.1.Drivers
3.5.1.1.Gradual rise in international seaborne trade
3.5.1.2.Increase in demand for cargo transportation through ships
3.5.1.3.Rise in trade-related agreements
3.5.1.4.Technological advancements in marine vessel engines
3.5.2.Restraints
3.5.2.1.Fluctuations in transportation and inventory costs
3.5.2.2.Environmental concerns associated with marine vessels
3.5.3.Opportunities
3.5.3.1.Trend of automation in marine transportation
3.5.3.2.Increase in marine safety norms
3.6.Impact of COVID-19 on the market
3.6.1.Evolution of outbreaks
3.6.1.1.COVID-19
3.6.2.Micro-economic impact analysis
3.6.2.1.Consumer trend
3.6.2.2.Technology trends
3.6.2.3.Regulatory trend
3.6.2.4.Macroeconomic impact analysis
3.6.3.Impact on the Shipbuilding industry analysis
CHAPTER 4:SHIPBUILDING MARKET, TYPE
4.1.Overview
4.2.Oil tankers
4.2.1.Key market trends, growth factors, and opportunities
4.2.2.Market size and forecast, by region
4.2.3.Market analysis, by country
4.3.Bulk carriers
4.3.1.Key market trends, growth factors, and opportunities
4.3.2.Market size and forecast, by region
4.3.3.Market analysis, by country
4.4.General cargo ships
4.4.1.Key market trends, growth factors, and opportunities
4.4.2.Market size and forecast, by region
4.4.3.Market analysis, by country
4.5.Container ships
4.5.1.Key market trends, growth factors, and opportunities
4.5.2.Market size and forecast, by region
4.5.3.Market analysis, by country
4.6.Passenger ships
4.6.1.Key market trends, growth factors, and opportunities
4.6.2.Market size and forecast, by region
4.6.3.Market analysis, by country
4.7.Others
4.7.1.Key market trends, growth factors, and opportunities
4.7.2.Market size and forecast, by region
4.7.3.Market analysis, by country
CHAPTER 5:SHIPBUILDING MARKET, BY END-USE
5.1.Overview
5.2.Transport
5.2.1.Key market trends, growth factors, and opportunities
5.2.2.Market size and forecast, by region
5.2.3.Market analysis, by country
5.3.Military
5.3.1.Key market trends, growth factors, and opportunities
5.3.2.Market size and forecast, by region
5.3.3.Market analysis, by country
CHAPTER 6:SHIPBUILDING MARKET, BY REGION
6.1.Overview
6.2.North America
6.2.1.Key market trends, growth factors, and opportunities
6.2.2.Market size and forecast, by Type
6.2.3.Market size and forecast, by End-Use
6.2.4.Market size and forecast, by country
6.2.4.1.U.S.
6.2.4.1.1.Market size and forecast, by Type
6.2.4.1.2.Market size and forecast, by End-Use
6.2.4.2.Canada
6.2.4.2.1.Market size and forecast, by Type
6.2.4.2.2.Market size and forecast, by End-Use
6.2.4.3.Mexico
6.2.4.3.1.Market size and forecast, by Type
6.2.4.3.2.Market size and forecast, by End-Use
6.3.Europe
6.3.1.Key market trends, growth factors, and opportunities
6.3.2.Market size and forecast, by Type
6.3.3.Market size and forecast, by End-Use
6.3.4.Market size and forecast, by country
6.3.4.1.Germany
6.3.4.1.1.Market size and forecast, by Type
6.3.4.1.2.Market size and forecast, by End-Use
6.3.4.2.UK
6.3.4.2.1.Market size and forecast, by Type
6.3.4.2.2.Market size and forecast, by End-Use
6.3.4.3.France
6.3.4.3.1.Market size and forecast, by Type
6.3.4.3.2.Market size and forecast, by End-Use
6.3.4.4.Rest of Europe
6.3.4.4.1.Market size and forecast, by Type
6.3.4.4.2.Market size and forecast, by End-Use
6.4.Asia-Pacific
6.4.1.Key market trends, growth factors, and opportunities
6.4.2.Market size and forecast, by Type
6.4.3.Market size and forecast, by End-Use
6.4.4.Market size and forecast, by country
6.4.4.1.China
6.4.4.1.1.Market size and forecast, by Type
6.4.4.1.2.Market size and forecast, by End-Use
6.4.4.2.Japan
6.4.4.2.1.Market size and forecast, by Type
6.4.4.2.2.Market size and forecast, by End-Use
6.4.4.3.South Korea
6.4.4.3.1.Market size and forecast, by Type
6.4.4.3.2.Market size and forecast, by End-Use
6.4.4.4.Rest of Asia-Pacific
6.4.4.4.1.Market size and forecast, by Type
6.4.4.4.2.Market size and forecast, by End-Use
6.5.LAMEA
6.5.1.Key market trends, growth factors, and opportunities
6.5.2.Market size and forecast, by Type
6.5.3.Market size and forecast, by End-Use
6.5.4.Market size and forecast, by country
6.5.4.1.Latin America
6.5.4.1.1.Market size and forecast, by Type
6.5.4.1.2.Market size and forecast, by End-Use
6.5.4.2.Middle East
6.5.4.2.1.Market size and forecast, by Type
6.5.4.2.2.Market size and forecast, by End-Use
6.5.4.3.Africa
6.5.4.3.1.Market size and forecast, by Type
6.5.4.3.2.Market size and forecast, by End-Use
CHAPTER 7:COMPANY PROFILES
7.1.BAE SYSTEMS PLC
7.1.1.Company overview
7.1.2.Key executives
7.1.3.Company snapshot
7.1.4.Operating business segments
7.1.5.Product portfolio
7.1.6.R&D expenditure
7.1.7.Business performance
7.1.8.Key strategic moves and developments
7.2.DAMEN SHIPYARDS GROUP
7.2.1.Company overview
7.2.2.Key executives
7.2.3.Company snapshot
7.2.4.Product portfolio
7.2.5.Key strategic moves and developments
7.3.FINCANTIERI GROUP
7.3.1.Company overview
7.3.2.Key executives
7.3.3.Company snapshot
7.3.4.Operating business segments
7.3.5.Product portfolio
7.3.6.R&D expenditure
7.3.7.Business performance
7.3.8.Key strategic moves and developments
7.4.GENERAL DYNAMICS CORPORATION
7.4.1.Company overview
7.4.2.Key executives
7.4.3.Company snapshot
7.4.4.Operating business segments
7.4.5.Product portfolio
7.4.6.R&D expenditure
7.4.7.Business performance
7.4.8.Key strategic moves and developments
7.5.HUNTINGTON INGALLS INDUSTRIES, INC.
7.5.1.Company overview
7.5.2.Key executives
7.5.3.Company snapshot
7.5.4.Operating business segments
7.5.5.Product portfolio
7.5.6.R&D expenditure
7.5.7.Business performance
7.5.8.Key strategic moves and developments
7.6.KOREA SHIPBUILDING & OFFSHORE ENGINEERING CO., LTD. (HYUNDAI HEAVY INDUSTRIES CO., LTD.)
7.6.1.Company overview
7.6.2.Key executives
7.6.3.Company snapshot
7.6.4.Operating business segments
7.6.5.Product portfolio
7.6.6.R&D expenditure
7.6.7.Business performance
7.6.8.Key strategic moves and developments
7.7.MITSUBISHI HEAVY INDUSTRIES, LTD.
7.7.1.Company overview
7.7.2.Key executives
7.7.3.Company snapshot
7.7.4.Operating business segments
7.7.5.Product portfolio
7.7.6.R&D expenditure
7.7.7.Business performance
7.7.8.Key strategic moves and developments
7.8.OSHIMA SHIPBUILDING CO., LTD.
7.8.1.Company overview
7.8.2.Key executives
7.8.3.Company snapshot
7.8.4.Product portfolio
7.8.5.Key strategic moves and developments
7.9.SAMSUNG HEAVY INDUSTRIES CO., LTD.
7.9.1.Company overview
7.9.2.Key executives
7.9.3.Company snapshot
7.9.4.Operating business segments
7.9.5.Product portfolio
7.9.6.R&D expenditure
7.9.7.Business performance
7.9.8.Key strategic moves and developments
7.10.SUMITOMO HEAVY INDUSTRIES, LTD.
7.10.1.Company overview
7.10.2.Key executives
7.10.3.Company snapshot
7.10.4.Operating business segments
7.10.5.Product portfolio
7.10.6.R&D expenditure
7.10.7.Business performance
7.10.8.Key strategic moves and developments
LIST OF TABLES
TABLE 01.SHIPBUILDING MARKET, BY TYPE, 2020–2030 ($MILLION)
TABLE 02.SHIPBUILDING MARKET FOR OIL TANKERS, BY REGION 2020–2030 ($MILLION)
TABLE 03.SHIPBUILDING MARKET FOR BULK CARRIERS, BY REGION 2020–2030 ($MILLION)
TABLE 04.SHIPBUILDING MARKET FOR GENERAL CARGO SHIPS, BY REGION 2020–2030 ($MILLION)
TABLE 05.SHIPBUILDING MARKET FOR CONTAINER SHIPS, BY REGION 2020–2030 ($MILLION)
TABLE 06.SHIPBUILDING MARKET FOR PASSENGER SHIPS, BY REGION 2020–2030 ($MILLION)
TABLE 07.SHIPBUILDING MARKET FOR OTHERS, BY REGION 2020–2030 ($MILLION)
TABLE 08.SHIPBUILDING MARKET, BY END-USE, 2020–2030 ($MILLION)
TABLE 09.SHIPBUILDING MARKET FOR PRE-OWNED VEHICES, BY REGION 2020–2030 ($MILLION)
TABLE 10.SHIPBUILDING MARKET FOR MILITARYS, BY REGION 2020–2030 ($MILLION)
TABLE 11.SHIPBUILDING MARKET, BY REGION 2020–2030 ($MILLION)
TABLE 12.NORTH AMERICA SHIPBUILDING MARKET, BY TYPE, 2020–2030 ($MILLION)
TABLE 13.NORTH AMERICA SHIPBUILDING MARKET, BY END-USE, 2020–2030 ($MILLION)
TABLE 14.U.S. SHIPBUILDING MARKET, BY TYPE, 2020–2030 ($MILLION)
TABLE 15.U.S. SHIPBUILDING MARKET, BY END-USE, 2020–2030 ($MILLION)
TABLE 16.CANADA SHIPBUILDING MARKET, BY TYPE, 2020–2030 ($MILLION)
TABLE 17.CANADA SHIPBUILDING MARKET, BY END-USE, 2020–2030 ($MILLION)
TABLE 18.MEXICO SHIPBUILDING MARKET, BY TYPE, 2020–2030 ($MILLION)
TABLE 19.MEXICO SHIPBUILDING MARKET, BY END-USE, 2020–2030 ($MILLION)
TABLE 20.EUROPE SHIPBUILDING MARKET, BY TYPE, 2020–2030 ($MILLION)
TABLE 21.EUROPE SHIPBUILDING MARKET, BY END-USE, 2020–2030 ($MILLION)
TABLE 22.GERMANY SHIPBUILDING MARKET, BY TYPE, 2020–2030 ($MILLION)
TABLE 23.GERMANY SHIPBUILDING MARKET, BY END-USE, 2020–2030 ($MILLION)
TABLE 24.UK SHIPBUILDING MARKET, BY TYPE, 2020–2030 ($MILLION)
TABLE 25.UK SHIPBUILDING MARKET, BY END-USE, 2020–2030 ($MILLION)
TABLE 26.FRANCE SHIPBUILDING MARKET, BY TYPE, 2020–2030 ($MILLION)
TABLE 27.FRANCE SHIPBUILDING MARKET, BY END-USE, 2020–2030 ($MILLION)
TABLE 28.REST OF EUROPE SHIPBUILDING MARKET, BY TYPE, 2020–2030 ($MILLION)
TABLE 29.REST OF EUROPE SHIPBUILDING MARKET, BY END-USE, 2020–2030 ($MILLION)
TABLE 30.ASIA-PACIFIC SHIPBUILDING MARKET, BY TYPE, 2020–2030 ($MILLION)
TABLE 31.ASIA-PACIFIC SHIPBUILDING MARKET, BY END-USE, 2020–2030 ($MILLION)
TABLE 32.CHINA SHIPBUILDING MARKET, BY TYPE, 2020–2030 ($MILLION)
TABLE 33.CHINA SHIPBUILDING MARKET, BY END-USE, 2020–2030 ($MILLION)
TABLE 34.JAPAN SHIPBUILDING MARKET, BY TYPE, 2020–2030 ($MILLION)
TABLE 35.JAPAN SHIPBUILDING MARKET, BY END-USE, 2020–2030 ($MILLION)
TABLE 36.SOUTH KOREA SHIPBUILDING MARKET, BY TYPE, 2020–2030 ($MILLION)
TABLE 37.SOUTH KOREA SHIPBUILDING MARKET, BY END-USE, 2020–2030 ($MILLION)
TABLE 38.REST OF ASIA-PACIFIC SHIPBUILDING MARKET, BY TYPE, 2020–2030 ($MILLION)
TABLE 39.REST OF ASIA-PACIFIC SHIPBUILDING MARKET, BY END-USE, 2020–2030 ($MILLION)
TABLE 40.LAMEA SHIPBUILDING MARKET, BY TYPE, 2020–2030 ($MILLION)
TABLE 41.LAMEA SHIPBUILDING MARKET, BY END-USE, 2020–2030 ($MILLION)
TABLE 42.LATIN AMERICA SHIPBUILDING MARKET, BY TYPE, 2020–2030 ($MILLION)
TABLE 43.LATIN AMERICA SHIPBUILDING MARKET, BY END-USE, 2020–2030 ($MILLION)
TABLE 44.MIDDLE EAST SHIPBUILDING MARKET, BY TYPE, 2020–2030 ($MILLION)
TABLE 45.MIDDLE EAST SHIPBUILDING MARKET, BY END-USE, 2020–2030 ($MILLION)
TABLE 46.AFRICA SHIPBUILDING MARKET, BY TYPE, 2020–2030 ($MILLION)
TABLE 47.AFRICA SHIPBUILDING MARKET, BY END-USE, 2020–2030 ($MILLION)
TABLE 48.BAE SYSTEMS PLC: KEY EXECUTIVES
TABLE 49.BAE SYSTEMS PLC: COMPANY SNAPSHOT
TABLE 50.BAE SYSTEMS PLC: OPERATING SEGMENTS
TABLE 51.BAE SYSTEMS PLC: PRODUCT PORTFOLIO
TABLE 52.BAE SYSTEMS PLC: R&D EXPENDITURE, 2018–2020 ($MILLION)
TABLE 53.BAE SYSTEMS PLC: NET SALES, 2018–2020 ($MILLION)
TABLE 54.DAMEN SHIPYARDS GROUP: KEY EXECUTIVE
TABLE 55.DAMEN SHIPYARDS GROUP: COMPANY SNAPSHOT
TABLE 56.DAMEN SHIPYARDS GROUP: PRODUCT PORTFOLIO
TABLE 57.FINCANTIERI GROUP: KEY EXECUTIVES
TABLE 58.FINCANTIERI GROUP: COMPANY SNAPSHOT
TABLE 59.FINCANTIERI GROUP: OPERATING SEGMENTS
TABLE 60.FINCANTIERI GROUP: PRODUCT PORTFOLIO
TABLE 61.FINCANTIERI GROUP: R&D EXPENDITURE, 2018–2020 ($MILLION)
TABLE 62.FINCANTIERI GROUP: NET SALES, 2018–2020 ($MILLION)
TABLE 63.GENERAL DYNAMICS CORPORATION: KEY EXECUTIVES
TABLE 64.GENERAL DYNAMICS CORPORATION: COMPANY SNAPSHOT
TABLE 65.GENERAL DYNAMICS CORPORATION: OPERATING SEGMENTS
TABLE 66.GENERAL DYNAMICS CORPORATION: PRODUCT PORTFOLIO
TABLE 67.GENERAL DYNAMICS CORPORATION: R&D EXPENDITURE, 2018–2020 ($MILLION)
TABLE 68.GENERAL DYNAMICS CORPORATION: NET SALES, 2018–2020 ($MILLION)
TABLE 69.HUNTINGTON INGALLS INDUSTRIES, INC.: KEY EXECUTIVES
TABLE 70.HUNTINGTON INGALLS INDUSTRIES, INC.: COMPANY SNAPSHOT
TABLE 71.HUNTINGTON INGALLS INDUSTRIES, INC.: OPERATING SEGMENTS
TABLE 72.HUNTINGTON INGALLS INDUSTRIES, INC.: PRODUCT PORTFOLIO
TABLE 73.HUNTINGTON INGALLS INDUSTRIES, INC.: R&D EXPENDITURE, 2018–2020 ($MILLION)
TABLE 74.HUNTINGTON INGALLS INDUSTRIES, INC.: NET SALES, 2018–2020 ($MILLION)
TABLE 75.KOREA SHIPBUILDING & OFFSHORE ENGINEERING CO., LTD.: KEY EXECUTIVES
TABLE 76.KOREA SHIPBUILDING & OFFSHORE ENGINEERING CO., LTD.: COMPANY SNAPSHOT
TABLE 77.KOREA SHIPBUILDING & OFFSHORE ENGINEERING CO., LTD.: OPERATING SEGMENTS
TABLE 78.KOREA SHIPBUILDING & OFFSHORE ENGINEERING CO., LTD.: PRODUCT PORTFOLIO
TABLE 79.KOREA SHIPBUILDING & OFFSHORE ENGINEERING CO., LTD.: R&D EXPENDITURE, 2018–2020 ($MILLION)
TABLE 80.KOREA SHIPBUILDING & OFFSHORE ENGINEERING CO., LTD.: NET SALES, 2018–2020 ($MILLION)
TABLE 81.MITSUBISHI HEAVY INDUSTRIES, LTD.: KEY EXECUTIVES
TABLE 82.MITSUBISHI HEAVY INDUSTRIES, LTD.: COMPANY SNAPSHOT
TABLE 83.MITSUBISHI HEAVY INDUSTRIES, LTD.: OPERATING SEGMENTS
TABLE 84.MITSUBISHI HEAVY INDUSTRIES, LTD.: PRODUCT PORTFOLIO
TABLE 85.MITSUBISHI HEAVY INDUSTRIES, LTD.: R&D EXPENDITURE, 2018–2020 ($MILLION)
TABLE 86.MITSUBISHI HEAVY INDUSTRIES, LTD.: NET SALES, 2018–2020 ($MILLION)
TABLE 87.OSHIMA SHIPBUILDING CO., LTD.: KEY EXECUTIVES
TABLE 88.OSHIMA SHIPBUILDING CO., LTD.: COMPANY SNAPSHOT
TABLE 89.OSHIMA SHIPBUILDING CO., LTD.: PRODUCT PORTFOLIO
TABLE 90.SAMSUNG HEAVY INDUSTRIES CO., LTD.: KEY EXECUTIVES
TABLE 91.SAMSUNG HEAVY INDUSTRIES CO., LTD.: COMPANY SNAPSHOT
TABLE 92.SAMSUNG HEAVY INDUSTRIES CO., LTD.: OPERATING SEGMENTS
TABLE 93.SAMSUNG HEAVY INDUSTRIES CO., LTD.: PRODUCT PORTFOLIO
TABLE 94.SAMSUNG HEAVY INDUSTRIES CO., LTD.: R&D EXPENDITURE, 2018–2020 ($MILLION)
TABLE 95.SAMSUNG HEAVY INDUSTRIES CO., LTD.: NET SALES, 2018–2020 ($MILLION)
TABLE 96.SUMITOMO HEAVY INDUSTRIES, LTD.: KEY EXECUTIVES
TABLE 97.SUMITOMO HEAVY INDUSTRIES, LTD.: COMPANY SNAPSHOT
TABLE 98.SUMITOMO HEAVY INDUSTRIES, LTD.: OPERATING SEGMENTS
TABLE 99.SUMITOMO HEAVY INDUSTRIES, LTD.: PRODUCT PORTFOLIO
TABLE 100.SUMITOMO HEAVY INDUSTRIES, LTD.: R&D EXPENDITURE, 2018–2020 ($MILLION)
TABLE 101.SUMITOMO HEAVY INDUSTRIES, LTD.: NET SALES, 2018–2020 ($MILLION)
LIST OF FIGURES
FIGURE 01.KEY MARKET SEGMENTS
FIGURE 02.EXECUTIVE SUMMARY, BY SEGMENT
FIGURE 03.EXECUTIVE SUMMARY, BY COUNTRY
FIGURE 04.TOP IMPACTING FACTORS
FIGURE 05.TOP INVESTMENT POCKETS
FIGURE 06.TOP WINNING STRATEGIES, BY YEAR, 2018–2021*
FIGURE 07.TOP WINNING STRATEGIES, BY YEAR, 2018–2021*
FIGURE 08.TOP WINNING STRATEGIES, BY COMPANY, 2018–2021*
FIGURE 09.MODERATE BARGAINING POWER OF SUPPLIERS
FIGURE 10.MODERATE BARGAINING POWER OF BUYERS
FIGURE 11.MODERATE-TO-HIGH OF NEW ENTRANTS
FIGURE 12.MODERATE OF SUBSTITUTES
FIGURE 13.MODERATE COMPETITIVE RIVALARY
FIGURE 14.KEY PLAYER POSITIOING (2020)
FIGURE 15.INTERNATIONAL SEABORNE TRADE (MN OF TONS)
FIGURE 16.MACRO-ECONOMIC INDICATORS PROJECTIONS (1/2):
FIGURE 17.MACRO-ECONOMIC INDICATORS PROJECTIONS (2/2):
FIGURE 18.SHIPBUILDING MARKET SHARE, BY TYPE, 2020–2030 (%)
FIGURE 19.COMPARATIVE SHARE ANALYSIS OF SHIPBUILDING MARKET FOR ELECTRIC SHIPBUILDING, BY COUNTRY, 2020 & 2030(%)
FIGURE 20.COMPARATIVE SHARE ANALYSIS OF SHIPBUILDING MARKET FOR BULK CARRIERS, BY COUNTRY, 2020 & 2030(%)
FIGURE 21.COMPARATIVE SHARE ANALYSIS OF SHIPBUILDING MARKET FOR GENERAL CARGO SHIPS, BY COUNTRY, 2020 & 2030(%)
FIGURE 22.COMPARATIVE SHARE ANALYSIS OF SHIPBUILDING MARKET FOR CONTAINER SHIPS, BY COUNTRY, 2020 & 2030(%)
FIGURE 23.COMPARATIVE SHARE ANALYSIS OF SHIPBUILDING MARKET FOR PASSENGER SHIPS, BY COUNTRY, 2020 & 2030(%)
FIGURE 24.COMPARATIVE SHARE ANALYSIS OF SHIPBUILDING MARKET FOR OTHERS, BY COUNTRY, 2020 & 2030(%)
FIGURE 25.SHIPBUILDING MARKET SHARE, BY END-USE, 2020–2030 (%)
FIGURE 26.COMPARATIVE SHARE ANALYSIS OF SHIPBUILDING MARKET FOR TRANSPORT, BY COUNTRY, 2020 & 2030(%)
FIGURE 27.COMPARATIVE SHARE ANALYSIS OF SHIPBUILDING MARKET FOR MILITARYS, BY COUNTRY, 2020 & 2030(%)
FIGURE 28.SHIPBUILDING MARKET, BY REGION, 2021–2030 (%)
FIGURE 29.COMPARATIVE SHARE ANALYSIS OF SHIPBUILDING MARKET, BY COUNTRY, 2020–2030 (%)
FIGURE 30.U.S. SHIPBUILDING MARKET, 2020–2030 ($MILLION)
FIGURE 31.CANADA SHIPBUILDING MARKET, 2020–2030 ($MILLION)
FIGURE 32.MEXICO SHIPBUILDING MARKET, 2020–2030 ($MILLION)
FIGURE 33.COMPARATIVE SHARE ANALYSIS OF SHIPBUILDING MARKET, BY COUNTRY, 2020–2030 (%)
FIGURE 34.GERMANY SHIPBUILDING MARKET, 2020–2030 ($MILLION)
FIGURE 35.UK SHIPBUILDING MARKET, 2020–2030 ($MILLION)
FIGURE 36.FRANCE SHIPBUILDING MARKET, 2020–2030 ($MILLION)
FIGURE 37.REST OF EUROPE SHIPBUILDING MARKET, 2020–2030 ($MILLION)
FIGURE 38.COMPARATIVE SHARE ANALYSIS OF SHIPBUILDING MARKET, BY COUNTRY, 2020–2030 (%)
FIGURE 39.CHINA SHIPBUILDING MARKET, 2020–2030 ($MILLION)
FIGURE 40.JAPAN SHIPBUILDING MARKET, 2020–2030 ($MILLION)
FIGURE 41.SOUTH KOREA SHIPBUILDING MARKET, 2020–2030 ($MILLION)
FIGURE 42.REST OF ASIA-PACIFIC SHIPBUILDING MARKET, 2020–2030 ($MILLION)
FIGURE 43.COMPARATIVE SHARE ANALYSIS OF SHIPBUILDING MARKET, BY COUNTRY, 2020–2030 (%)
FIGURE 44.LATIN AMERICA SHIPBUILDING MARKET, 2020–2030 ($MILLION)
FIGURE 45.MIDDLE EAST SHIPBUILDING MARKET, 2020–2030 ($MILLION)
FIGURE 46.AFRICA SHIPBUILDING MARKET, 2020–2030 ($MILLION)
FIGURE 47.BAE SYSTEMS PLC: R&D EXPENDITURE, 2018–2020 ($MILLION)
FIGURE 48.BAE SYSTEMS PLC: NET SALES, 2018–2020 ($MILLION)
FIGURE 49.BAE SYSTEMS PLC: REVENUE SHARE BY SEGMENT, 2020 (%)
FIGURE 50.BAE SYSTEMS PLC: REVENUE SHARE BY REGION, 2020 (%)
FIGURE 51.FINCANTIERI GROUP: R&D EXPENDITURE, 2018–2020 ($MILLION)
FIGURE 52.FINCANTIERI GROUP: NET SALES, 2018–2020 ($MILLION)
FIGURE 53.FINCANTIERI GROUP: REVENUE SHARE BY SEGMENT, 2020 (%)
FIGURE 54.FINCANTIERI GROUP: REVENUE SHARE BY REGION, 2020 (%)
FIGURE 55.GENERAL DYNAMICS CORPORATION: R&D EXPENDITURE, 2018–2020 ($MILLION)
FIGURE 56.GENERAL DYNAMICS CORPORATION: NET SALES, 2018–2020 ($MILLION)
FIGURE 57.GENERAL DYNAMICS CORPORATION: REVENUE SHARE BY SEGMENT, 2020 (%)
FIGURE 58.GENERAL DYNAMICS CORPORATION: REVENUE SHARE BY REGION, 2020 (%)
FIGURE 59.HUNTINGTON INGALLS INDUSTRIES, INC.: R&D EXPENDITURE, 2018–2020 ($MILLION)
FIGURE 60.HUNTINGTON INGALLS INDUSTRIES, INC.: NET SALES, 2018–2020 ($MILLION)
FIGURE 61.HUNTINGTON INGALLS INDUSTRIES, INC.: REVENUE SHARE BY SEGMENT, 2020 (%)
FIGURE 62.KOREA SHIPBUILDING & OFFSHORE ENGINEERING CO., LTD.: R&D EXPENDITURE, 2018–2020 ($MILLION)
FIGURE 63.KOREA SHIPBUILDING & OFFSHORE ENGINEERING CO., LTD.: NET SALES, 2018–2020 ($MILLION)
FIGURE 64.KOREA SHIPBUILDING & OFFSHORE ENGINEERING CO., LTD.: REVENUE SHARE BY SEGMENT, 2020 (%)
FIGURE 65.MITSUBISHI HEAVY INDUSTRIES, LTD.: R&D EXPENDITURE, 2018–2020 ($MILLION)
FIGURE 66.MITSUBISHI HEAVY INDUSTRIES, LTD.: NET SALES, 2018–2020 ($MILLION)
FIGURE 67.MITSUBISHI HEAVY INDUSTRIES, LTD.: REVENUE SHARE BY SEGMENT, 2020 (%)
FIGURE 68.MITSUBISHI HEAVY INDUSTRIES, LTD.: REVENUE SHARE BY REGION, 2020 (%)
FIGURE 69.SAMSUNG HEAVY INDUSTRIES CO., LTD.: R&D EXPENDITURE, 2018–2020 ($MILLION)
FIGURE 70.SAMSUNG HEAVY INDUSTRIES CO., LTD.: NET SALES, 2018–2020 ($MILLION)
FIGURE 71.SAMSUNG HEAVY INDUSTRIES CO., LTD.: REVENUE SHARE BY SEGMENT, 2020 (%)
FIGURE 72.SAMSUNG HEAVY INDUSTRIES CO., LTD.: REVENUE SHARE BY REGION, 2020 (%)
FIGURE 73.SUMITOMO HEAVY INDUSTRIES, LTD.: R&D EXPENDITURE, 2018–2020 ($MILLION)
FIGURE 74.SUMITOMO HEAVY INDUSTRIES, LTD.: NET SALES, 2018–2020 ($MILLION)
FIGURE 75.SUMITOMO HEAVY INDUSTRIES, LTD.: REVENUE SHARE BY SEGMENT, 2020 (%)
FIGURE 76.SUMITOMO HEAVY INDUSTRIES, LTD.: REVENUE SHARE BY REGION, 2020 (%)
$5769
$6450
$9995
HAVE A QUERY?
OUR CUSTOMER

SIMILAR REPORTS