
The global security testing market size was valued at $6.25 billion in 2020 and is projected to reach $36.78 billion by 2030, growing at a CAGR of 19.2% from 2021 to 2030. The global security testing market is growing due to an increase in web and mobile-based business vital applications that require greater secure endpoint protection, as well as organizations employing security measures to prevent financial losses due to rising attacker complexity.
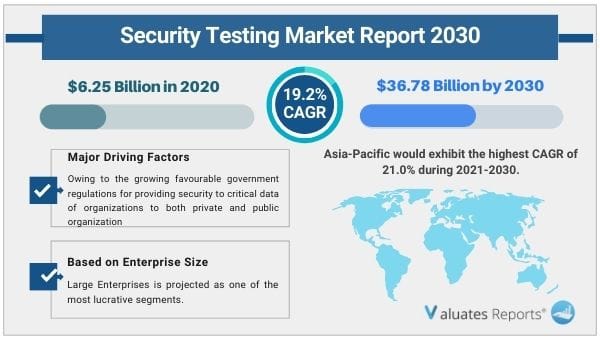
Furthermore, Security testing market growth is aided by stringent government regulations aimed at boosting the adoption of security testing solutions and services. The capacity of the security testing market to discover all conceivable gaps and flaws in the software system, which could result in a loss of information, revenue, or reputation at the hands of workers or outsiders, is propelling its expansion.
Security testing is a sort of software testing that identifies and protects software applications from malicious intruder attacks by identifying vulnerabilities, dangers, and risks.
Businesses are letting workers work from home using their own devices, such as laptops and smartphones, to access company data in the aftermath of the COVID-19 epidemic, as well as providing company-specific online and mobile-based applications for use. Due to weak protection, these external devices run on the employee network, which is subject to numerous cyberattacks. As a result, businesses are implementing security testing solutions to increase security and lower the risk of various forms of cyber-attacks, propelling the market forward. Security testing market growth is also fueled by rising cyberattacks, in-house data thefts, and other theft issues among businesses.
Due to an increase in the number of cyberattacks on businesses and government agencies aiming to get access to sensitive data, the government has implemented strict government guidelines aimed at protecting both businesses and their client's sensitive data. Furthermore, in the aftermath of the COVID-19 epidemic, the rise in remote workforces around the world has increased the number of cyberattacks on an organization's essential data, propelling the Security Testing Market forward. Governments are also establishing numerous requirements, such as standardizing security testing solutions in organizations and enhancing security testing training, which is moving the Security Testing Market forward.
Increased adoption of cloud-based security testing, as well as technological evolution and implementation of new technologies, such as DevOps, DevSecOps, and Agile in software security testing, are expected to provide lucrative opportunities for the Security Testing Market to grow during the forecast period.
Large enterprises have the greatest Security Testing Market share in terms of enterprise size since they have a large amount of data and even a tiny data breach can result in a significant financial loss as well as a loss of image for the firm.
Because of a paradigm shift in deployment methods from on-premise to cloud-based models among SMEs and certain large-scale organizations, the cloud segment is predicted to develop rapidly in the future years. Furthermore, major market players have been developing numerous tactics to help businesses move from on-premise to cloud-based models, creating a profitable market opportunity.
North America dominated the security testing market in 2020, and this trend is projected to continue throughout the forecast period. This is owing to the existence of industrialised economies like Canada and the United States, which value innovating current solutions. During the period 2021-2030, Asia-Pacific is predicted to have the highest CAGR of 21.0 percent.
|
Report Metric |
Details |
|
Report Name |
Security Testing Market |
|
The market size in 2020 |
USD 6.25 Billion |
|
The revenue forecast in 2030 |
USD 36.78 Billion |
|
Growth Rate |
CAGR of 19.2% from 2021 to 2030 |
|
Market size available for years |
2021-2030 |
|
Forecast units |
Value (USD) |
|
Segments covered |
Type, Deployment Mode, Enterprise Size, and Industry Verticals, Regions |
|
Report coverage |
Revenue & volume forecast, company share, competitive landscape, growth factors, and trends |
|
Geographic regions covered |
North America, Europe, Asia Pacific, Latin America, Middle East & Africa |
Ans. The global security testing market size was valued at $6.25 billion in 2020, and is projected to reach $36.78 billion by 2030, growing at a CAGR of 19.2% from 2021 to 2030.
Ans. The COVID-19 outbreak has considerably boosted growth of the security testing market, owing to the growing favourable government regulations for providing security to critical data of organizations to both private and public organization and for supporting new practices for working remotely and maintaining social distancing.
Ans. North America will provide more business opportunities for security testing in future, and this trend is projected to continue throughout the forecast period.
Ans. Security testing market growth is aided by stringent government regulations aimed at boosting the adoption of security testing solutions and services.
Ans. Network Security is the most influencing segment growing in the security testing report
Ans. North America & Asia Pacific are the key matured markets growing in the security testing report
Table of Content
CHAPTER 1:INTRODUCTION
1.1.Report description
1.2.Key benefits for stakeholders
1.3.Key market segments
1.4.Research methodology
1.4.1.Secondary research
1.4.2.Primary research
1.4.3.Analyst tools & models
CHAPTER 2:EXECUTIVE SUMMARY
2.1.Key findings
2.1.1.Top impacting factors
2.1.2.Top investment pockets
2.2.CXO perspective
CHAPTER 3:MARKET OVERVIEW
3.1.Market definition and scope
3.2.Key forces shaping the global security testing market
3.3.Market dynamics
3.3.1.Drivers
3.3.1.1.Surge in web and mobile-based business critical applications requiring higher secure endpoint protection
3.3.1.2.Stringent government regulations to increase the adoption of security testing solutions and services
3.3.2.Restraints
3.3.2.1.Lack of skilled security professionals
3.3.2.2.High implementation cost
3.3.3.Opportunities
3.3.3.1.Increased adoption of cloud-based security testing and evolution of technologies
3.3.3.2.Implementation of new technologies, such as DevOps, DevSecOps, and Agile, in software security testing
3.4.COVID-19 impact analysis on the security testing market
3.4.1.Impact on market size
3.4.2.Consumer trends, preferences, and budget impact
3.4.3.Economic impact
3.4.4.Strategies to tackle negative impact
3.4.5.Opportunity window
CHAPTER 4:SECURITY TESTING MARKET, BY DEPLOYMENT MODE
4.1.Overview
4.2.On-Premise
4.2.1.Key market trends, growth factors, and opportunities
4.2.2.Market size and forecast, by region
4.2.3.Market analysis, by country
4.3.Cloud
4.3.1.Key market trends, growth factors, and opportunities
4.3.2.Market size and forecast, by region
4.3.3.Market analysis, by country
CHAPTER 5:SECURITY TESTING MARKET, BY SECURITY TYPE
5.1.Overview
5.2.Network security
5.2.1.Key market trends, growth factors, and opportunities
5.2.2.Market size and forecast, by region
5.2.3.Market analysis, by country
5.3.Application security
5.3.1.Key market trends, growth factors, and opportunities
5.3.2.Market size and forecast, by region
5.3.3.Market analysis, by country
5.3.4.Application security testing market, by offering
5.3.4.1.Web-based application security
5.3.4.2.Market size and forecast, by region
5.3.4.3.Mobile application security
5.3.4.4.Market size and forecast, by region
5.3.4.4.1.Web-based application security testing market, by offering
5.3.4.4.1.1.Solution
5.3.4.4.1.2.Market size and forecast, by region
5.3.4.4.1.3.Service
5.3.4.4.1.4.Market size and forecast, by region
5.4.Device security
5.4.1.Key market trends, growth factors, and opportunities
5.4.2.Market size and forecast, by region
5.4.3.Market analysis, by country
5.5.Others
5.5.1.Key market trends, growth factors, and opportunities
5.5.2.Market size and forecast, by region
5.5.3.Market analysis, by country
CHAPTER 6:SECURITY TESTING MARKET, BY ENTERPRISE SIZE
6.1.Overview
6.2.Large enterprises
6.2.1.Key market trends, growth factors, and opportunities
6.2.2.Market size and forecast, by region
6.2.3.Market analysis, by country
6.3.SMEs
6.3.1.Key market trends, growth factors, and opportunities
6.3.2.Market size and forecast, by region
6.3.3.Market analysis, by country
CHAPTER 7:SECURITY TESTING MARKET, BY INDUSTRY VERTICAL
7.1.Overview
7.2.BFSI
7.2.1.Key market trends, growth factors, and opportunities
7.2.2.Market size and forecast, by region
7.2.3.Market analysis, by country
7.3.IT & Telecom
7.3.1.Key market trends, growth factors, and opportunities
7.3.2.Market size and forecast, by region
7.3.3.Market analysis, by country
7.4.Healthcare
7.4.1.Key market trends, growth factors, and opportunities
7.4.2.Market size and forecast, by region
7.4.3.Market analysis, by country
7.5.Retail & E-commerce
7.5.1.Key market trends, growth factors, and opportunities
7.5.2.Market size and forecast, by region
7.5.3.Market analysis, by country
7.6.Education
7.6.1.Key market trends, growth factors, and opportunities
7.6.2.Market size and forecast, by region
7.6.3.Market analysis, by country
7.7.Others
7.7.1.Key market trends, growth factors, and opportunities
7.7.2.Market size and forecast, by region
7.7.3.Market analysis, by country
CHAPTER 8:SECURITY TESTING MARKET, BY REGION
8.1.Overview
8.1.1.Market size and forecast, by region
8.2.North America
8.2.1.Key market trends, growth factors, and opportunities
8.2.2.Market size and forecast, by deployment mode
8.2.3.Market size and forecast, by security type
8.2.4.Market size and forecast, by application security
8.2.5.Market size and forecast, by web application security
8.2.6.Market size and forecast, by enterprise size
8.2.7.Market size and forecast, by industry vertical
8.2.8.Market analysis, by country
8.2.8.1.U.S.
8.2.8.1.1.Market size and forecast, by deployment mode
8.2.8.1.2.Market size and forecast, by security type
8.2.8.1.3.Market size and forecast, by application security
8.2.8.1.4.Market size and forecast, by web application security
8.2.8.1.5.Market size and forecast, by enterprise size
8.2.8.1.6.Market size and forecast, by industry vertical
8.2.8.2.Canada
8.2.8.2.1.Market size and forecast, by deployment mode
8.2.8.2.2.Market size and forecast, by security type
8.2.8.2.3.Market size and forecast, by application security
8.2.8.2.4.Market size and forecast, by web application security
8.2.8.2.5.Market size and forecast, by enterprise size
8.2.8.2.6.Market size and forecast, by industry vertical
8.3.Europe
8.3.1.Key market trends, growth factors, and opportunities
8.3.2.Market size and forecast, by deployment mode
8.3.3.Market size and forecast, by security type
8.3.4.Market size and forecast, by application security
8.3.5.Market size and forecast, by web application security
8.3.6.Market size and forecast, by enterprise size
8.3.7.Market size and forecast, by industry vertical
8.3.8.Market analysis, by country
8.3.8.1.UK
8.3.8.1.1.Market size and forecast, by deployment mode
8.3.8.1.2.Market size and forecast, by security type
8.3.8.1.3.Market size and forecast, by application security
8.3.8.1.4.Market size and forecast, by web application security
8.3.8.1.5.Market size and forecast, by enterprise size
8.3.8.1.6.Market size and forecast, by industry vertical
8.3.8.2.Germany
8.3.8.2.1.Market size and forecast, by deployment mode
8.3.8.2.2.Market size and forecast, by security type
8.3.8.2.3.Market size and forecast, by application security
8.3.8.2.4.Market size and forecast, by web application security
8.3.8.2.5.Market size and forecast, by enterprise size
8.3.8.2.6.Market size and forecast, by industry vertical
8.3.8.3.France
8.3.8.3.1.Market size and forecast, by deployment mode
8.3.8.3.2.Market size and forecast, by security type
8.3.8.3.3.Market size and forecast, by application security
8.3.8.3.4.Market size and forecast, by web application security
8.3.8.3.5.Market size and forecast, by enterprise size
8.3.8.3.6.Market size and forecast, by industry vertical
8.3.8.4.Italy
8.3.8.4.1.Market size and forecast, by deployment mode
8.3.8.4.2.Market size and forecast, by security type
8.3.8.4.3.Market size and forecast, by application security
8.3.8.4.4.Market size and forecast, by web application security
8.3.8.4.5.Market size and forecast, by enterprise size
8.3.8.4.6.Market size and forecast, by industry vertical
8.3.8.5.Spain
8.3.8.5.1.Market size and forecast, by deployment mode
8.3.8.5.2.Market size and forecast, by security type
8.3.8.5.3.Market size and forecast, by application security
8.3.8.5.4.Market size and forecast, by web application security
8.3.8.5.5.Market size and forecast, by enterprise size
8.3.8.5.6.Market size and forecast, by industry vertical
8.3.8.6.Netherlands
8.3.8.6.1.Market size and forecast, by deployment mode
8.3.8.6.2.Market size and forecast, by security type
8.3.8.6.3.Market size and forecast, by application security
8.3.8.6.4.Market size and forecast, by web application security
8.3.8.6.5.Market size and forecast, by enterprise size
8.3.8.6.6.Market size and forecast, by industry vertical
8.3.8.7.Rest of Europe
8.3.8.7.1.Market size and forecast, by deployment mode
8.3.8.7.2.Market size and forecast, by security type
8.3.8.7.3.Market size and forecast, by application security
8.3.8.7.4.Market size and forecast, by web application security
8.3.8.7.5.Market size and forecast, by enterprise size
8.3.8.7.6.Market size and forecast, by industry vertical
8.4.Asia-Pacific
8.4.1.Key market trends, growth factors, and opportunities
8.4.2.Market size and forecast, by deployment mode
8.4.3.Market size and forecast, by security type
8.4.4.Market size and forecast, by application security
8.4.5.Market size and forecast, by web application security
8.4.6.Market size and forecast, by enterprise size
8.4.7.Market size and forecast, by industry vertical
8.4.8.Market analysis, by country
8.4.8.1.China
8.4.8.1.1.Market size and forecast, by deployment mode
8.4.8.1.2.Market size and forecast, by security type
8.4.8.1.3.Market size and forecast, by application security
8.4.8.1.4.Market size and forecast, by web application security
8.4.8.1.5.Market size and forecast, by enterprise size
8.4.8.1.6.Market size and forecast, by industry vertical
8.4.8.2.Japan
8.4.8.2.1.Market size and forecast, by deployment mode
8.4.8.2.2.Market size and forecast, by security type
8.4.8.2.3.Market size and forecast, by application security
8.4.8.2.4.Market size and forecast, by web application security
8.4.8.2.5.Market size and forecast, by enterprise size
8.4.8.2.6.Market size and forecast, by industry vertical
8.4.8.3.India
8.4.8.3.1.Market size and forecast, by deployment mode
8.4.8.3.2.Market size and forecast, by security type
8.4.8.3.3.Market size and forecast, by application security
8.4.8.3.4.Market size and forecast, by web application security
8.4.8.3.5.Market size and forecast, by enterprise size
8.4.8.3.6.Market size and forecast, by industry vertical
8.4.8.4.Australia
8.4.8.4.1.Market size and forecast, by deployment mode
8.4.8.4.2.Market size and forecast, by security type
8.4.8.4.3.Market size and forecast, by application security
8.4.8.4.4.Market size and forecast, by web application security
8.4.8.4.5.Market size and forecast, by enterprise size
8.4.8.4.6.Market size and forecast, by industry vertical
8.4.8.5.South Korea
8.4.8.5.1.Market size and forecast, by deployment mode
8.4.8.5.2.Market size and forecast, by security type
8.4.8.5.3.Market size and forecast, by application security
8.4.8.5.4.Market size and forecast, by web application security
8.4.8.5.5.Market size and forecast, by enterprise size
8.4.8.5.6.Market size and forecast, by industry vertical
8.4.8.6.Rest of Asia-Pacific
8.4.8.6.1.Market size and forecast, by deployment mode
8.4.8.6.2.Market size and forecast, by security type
8.4.8.6.3.Market size and forecast, by application security
8.4.8.6.4.Market size and forecast, by web application security
8.4.8.6.5.Market size and forecast, by enterprise size
8.4.8.6.6.Market size and forecast, by industry vertical
8.5.LAMEA
8.5.1.Key market trends, growth factors, and opportunities
8.5.2.Market size and forecast, by deployment mode
8.5.3.Market size and forecast, by security type
8.5.4.Market size and forecast, by application security
8.5.5.Market size and forecast, by web application security
8.5.6.Market size and forecast, by enterprise size
8.5.7.Market size and forecast, by industry vertical
8.5.8.Market analysis, by country
8.5.8.1.Latin America
8.5.8.1.1.Market size and forecast, by deployment mode
8.5.8.1.2.Market size and forecast, by security type
8.5.8.1.3.Market size and forecast, by application security
8.5.8.1.4.Market size and forecast, by web application security
8.5.8.1.5.Market size and forecast, by enterprise size
8.5.8.1.6.Market size and forecast, by industry vertical
8.5.8.2.Middle East
8.5.8.2.1.Market size and forecast, by deployment mode
8.5.8.2.2.Market size and forecast, by security type
8.5.8.2.3.Market size and forecast, by application security
8.5.8.2.4.Market size and forecast, by web application security
8.5.8.2.5.Market size and forecast, by enterprise size
8.5.8.2.6.Market size and forecast, by industry vertical
8.5.8.3.Africa
8.5.8.3.1.Market size and forecast, by deployment mode
8.5.8.3.2.Market size and forecast, by security type
8.5.8.3.3.Market size and forecast, by application security
8.5.8.3.4.Market size and forecast, by web application security
8.5.8.3.5.Market size and forecast, by enterprise size
8.5.8.3.6.Market size and forecast, by industry vertical
CHAPTER 9:COMPETITIVE LANDSCAPE
9.1.Key players positioning analysis, 2020
9.2.Competitive dashboard
9.3.Top winning strategies
CHAPTER 10:COMPANY PROFILE
10.1.AT&T
10.1.1.Company overview
10.1.2.Key executives
10.1.3.Company snapshot
10.1.4.Operating business segments
10.1.5.Product portfolio
10.1.6.Business performance
10.1.7.Key strategic moves and developments
10.2.CIGNITI
10.2.1.Company overview
10.2.2.Key executives
10.2.3.Company snapshot
10.2.4.Product portfolio
10.2.5.Business performance
10.2.6.Key strategic moves and developments
10.3.INTERNATIONAL BUSINESS MACHINES CORPORATION
10.3.1.Company overview
10.3.2.Key executive
10.3.3.Company snapshot
10.3.4.Operating business segments
10.3.5.Product portfolio
10.3.6.R&D expenditure
10.3.7.Business performance
10.3.8.Key strategic moves and developments
10.4.MCAFEE, LLC
10.4.1.Company overview
10.4.2.Key executives
10.4.3.Company snapshot
10.4.4.Product portfolio
10.4.5.Key strategic moves and developments
10.5.MICRO FOCUS
10.5.1.Company overview
10.5.2.Key executives
10.5.3.Company snapshot
10.5.4.Product portfolio
10.5.5.R&D expenditure
10.5.6.Business performance
10.5.7.Key strategic moves and developments
10.6.NTT SECURITY APPSEC SOLUTIONS INC.
10.6.1.Company overview
10.6.2.Key executives
10.6.3.Company snapshot
10.6.4.Product portfolio
10.6.5.Key strategic moves and developments
10.7.RAPID7
10.7.1.Company overview
10.7.2.Key executives
10.7.3.Company snapshot
10.7.4.Product portfolio
10.7.5.R&D Expenditure
10.7.6.Business performance
10.7.7.Key strategic moves and developments
10.8.SECUREWORKS, INC.
10.8.1.Company overview
10.8.2.Key executives
10.8.3.Company snapshot
10.8.4.Product portfolio
10.8.5.R&D expenditure
10.8.6.Business performance
10.8.7.Key strategic moves and developments
10.9.SYNOPSYS, INC.
10.9.1.Company overview
10.9.2.Key executives
10.9.3.Company snapshot
10.9.4.Product portfolio
10.9.5.R&D expenditure
10.9.6.Business performance
10.9.7.Key strategic moves and developments
10.10.VERACODE
10.10.1.Company overview
10.10.2.Key executives
10.10.3.Company snapshot
10.10.4.Product portfolio
List of Tables & Figures
Table 01.Security Testing Market Revenue, By Deployment Mode, 2020–2030 ($Million)
Table 02.Security Testing Market Revenue For On-premise, By Region, 2020–2030 ($Million)
Table 03.Security Testing Market Revenue For Cloud, By Region, 2020–2030 ($Million)
Table 04.Security Testing Market Revenue, By Security Type, 2020–2030 ($Million)
Table 05.Security Testing Market Revenue For Network Security, By Region, 2020–2030 ($Million)
Table 06.Security Testing Market Revenue For Application Security, By Region, 2020–2030 ($Million)
Table 07.Application Security Testing Market Revenue, By Offering, 2020–2030($Million)
Table 08.Application Security Testing Market Revenue For Web-based Application Security, By Region, 2020–2030 ($Million)
Table 09.Application Security Testing Market Revenue For Web-based Application Security, By Region, 2020–2030 ($Million)
Table 10.Web-based Application Security Testing Market Revenue, By Offering, 2020–2030($Million)
Table 11.Web-based Application Security Testing Market Revenue For Solution, By Region, 2020–2030 ($Million)
Table 12.Web-based Application Security Testing Market Revenue For Service, By Region, 2020–2030 ($Million)
Table 13.Security Testing Market Revenue For Device Security, By Region, 2020–2030 ($Million)
Table 14.Security Testing Market Revenue For Others, By Region, 2020–2030 ($Million)
Table 15.Security Testing Market Revenue, By Enterprise Size, 2020–2030 ($Million)
Table 16.Security Testing Market Revenue For Large Enterprises, By Region, 2020–2030 ($Million)
Table 17.Security Testing Market Revenue For Smes, By Region, 2020–2030 ($Million)
Table 18.Security Testing Market Revenue, By Industry Vertical, 2020–2030 ($Million)
Table 19.Security Testing Market Revenue For Bfsi, By Region, 2020–2030 ($Million)
Table 20.Security Testing Market Revenue For It & Telecom, By Region, 2020–2030 ($Million)
Table 21.Security Testing Market Revenue For Healthcare, By Region, 2020–2030 ($Million)
Table 22.Security Testing Market Revenue For Retail & E-commerce, By Region, 2020–2030 ($Million)
Table 23.Security Testing Market Revenue For Education, By Region, 2020–2030 ($Million)
Table 24.Security Testing Market Revenue For Others, By Region, 2020–2030 ($Million)
Table 25.Security Testing Market Revenue, By Region, 2020–2030 ($Million)
Table 26.North America Security Testing Market Revenue, By Deployment Mode, 2020–2030 ($Million)
Table 27.North America Security Testing Market Revenue, By Security Type, 2020–2030 ($Million)
Table 28.North America Security Testing Market Revenue, By Application Security, 2020–2030 ($Million)
Table 29.North America Security Testing Market Revenue, By Web Application Security, 2020–2030 ($Million)
Table 30.North America Security Testing Market Revenue, By Enterprise Size, 2020–2030 ($Million)
Table 31.North America Security Testing Market Revenue, By Industry Vertical, 2020–2030 ($Million)
Table 32.North America Security Testing Market Revenue, By Country, 2020–2028 ($Million)
Table 33.U.S. Security Testing Market Revenue, By Deployment Mode, 2020–2030 ($Million)
Table 34.U.S. Security Testing Market Revenue, By Security Type, 2020–2030 ($Million)
Table 35.U.S. Security Testing Market Revenue, By Application Security, 2020–2030 ($Million)
Table 36.U.S. Security Testing Market Revenue, By Web Application Security, 2020–2030 ($Million)
Table 37.U.S. Security Testing Market Revenue, By Enterprise Size, 2020–2030 ($Million)
Table 38.U.S. Security Testing Market Revenue, By Industry Vertical, 2020–2030 ($Million)
Table 39.Canada Security Testing Market Revenue, By Deployment Mode, 2020–2030 ($Million)
Table 40.Canada Security Testing Market Revenue, By Security Type, 2020–2030 ($Million)
Table 41.Canada Security Testing Market Revenue, By Application Security, 2020–2030 ($Million)
Table 42.Canada Security Testing Market Revenue, By Web Application Security, 2020–2030 ($Million)
Table 43.Canada Security Testing Market Revenue, By Enterprise Size, 2020–2030 ($Million)
Table 44.Canada Security Testing Market Revenue, By Industry Vertical, 2020–2030 ($Million)
Table 45.Europe Security Testing Market Revenue, By Deployment Mode, 2020–2030 ($Million)
Table 46.Europe Security Testing Market Revenue, By Security Type, 2020–2030 ($Million)
Table 47.Europe Security Testing Market Revenue, By Application Security, 2020–2030 ($Million)
Table 48.Europe Security Testing Market Revenue, By Web Application Security, 2020–2030 ($Million)
Table 49.Europe Security Testing Market Revenue, By Enterprise Size, 2020–2030 ($Million)
Table 50.Europe Security Testing Market Revenue, By Industry Vertical, 2020–2030 ($Million)
Table 51.Europe Security Testing Market Revenue, By Country, 2020–2028 ($Million)
Table 52.Uk Security Testing Market Revenue, By Deployment Mode, 2020–2030 ($Million)
Table 53.Uk Security Testing Market Revenue, By Security Type, 2020–2030 ($Million)
Table 54.Uk Security Testing Market Revenue, By Application Security, 2020–2030 ($Million)
Table 55.Uk Security Testing Market Revenue, By Web Application Security, 2020–2030 ($Million)
Table 56.Uk Security Testing Market Revenue, By Enterprise Size, 2020–2030 ($Million)
Table 57.Uk Security Testing Market Revenue, By Industry Vertical, 2020–2030 ($Million)
Table 58.Germany Security Testing Market Revenue, By Deployment Mode, 2020–2030 ($Million)
Table 59.Germany Security Testing Market Revenue, By Security Type, 2020–2030 ($Million)
Table 60.Germany Security Testing Market Revenue, By Application Security, 2020–2030 ($Million)
Table 61.Germany Security Testing Market Revenue, By Web Application Security, 2020–2030 ($Million)
Table 62.Germany Security Testing Market Revenue, By Enterprise Size, 2020–2030 ($Million)
Table 63.Germany Security Testing Market Revenue, By Industry Vertical, 2020–2030 ($Million)
Table 64.France Security Testing Market Revenue, By Deployment Mode, 2020–2030 ($Million)
Table 65.France Security Testing Market Revenue, By Security Type, 2020–2030 ($Million)
Table 66.France Security Testing Market Revenue, By Application Security, 2020–2030 ($Million)
Table 67.France Security Testing Market Revenue, By Web Application Security, 2020–2030 ($Million)
Table 68.France Security Testing Market Revenue, By Enterprise Size, 2020–2030 ($Million)
Table 69.France Security Testing Market Revenue, By Industry Vertical, 2020–2030 ($Million)
Table 70.Italy Security Testing Market Revenue, By Deployment Mode, 2020–2030 ($Million)
Table 71.Italy Security Testing Market Revenue, By Security Type, 2020–2030 ($Million)
Table 72.Italy Security Testing Market Revenue, By Application Security, 2020–2030 ($Million)
Table 73.Italy Security Testing Market Revenue, By Web Application Security, 2020–2030 ($Million)
Table 74.Italy Security Testing Market Revenue, By Enterprise Size, 2020–2030 ($Million)
Table 75.Italy Security Testing Market Revenue, By Industry Vertical, 2020–2030 ($Million)
Table 76.Spain Security Testing Market Revenue, By Deployment Mode, 2020–2030 ($Million)
Table 77.Spain Security Testing Market Revenue, By Security Type, 2020–2030 ($Million)
Table 78.Spain Security Testing Market Revenue, By Application Security, 2020–2030 ($Million)
Table 79.Spain Security Testing Market Revenue, By Web Application Security, 2020–2030 ($Million)
Table 80.Spain Security Testing Market Revenue, By Enterprise Size, 2020–2030 ($Million)
Table 81.Spain Security Testing Market Revenue, By Industry Vertical, 2020–2030 ($Million)
Table 82.Netherlands Security Testing Market Revenue, By Deployment Mode, 2020–2030 ($Million)
Table 83.Netherlands Security Testing Market Revenue, By Security Type, 2020–2030 ($Million)
Table 84.Netherlands Security Testing Market Revenue, By Application Security, 2020–2030 ($Million)
Table 85.Netherlands Security Testing Market Revenue, By Web Application Security, 2020–2030 ($Million)
Table 86.Netherlands Security Testing Market Revenue, By Enterprise Size, 2020–2030 ($Million)
Table 87.Netherlands Security Testing Market Revenue, By Industry Vertical, 2020–2030 ($Million)
Table 88.Rest Of Europe Security Testing Market Revenue, By Deployment Mode, 2020–2030 ($Million)
Table 89.Rest Of Europe Security Testing Market Revenue, By Security Type, 2020–2030 ($Million)
Table 90.Rest Of Europe Security Testing Market Revenue, By Application Security, 2020–2030 ($Million)
Table 91.Rest Of Europe Security Testing Market Revenue, By Web Application Security, 2020–2030 ($Million)
Table 92.Rest Of Europe Security Testing Market Revenue, By Enterprise Size, 2020–2030 ($Million)
Table 93.Rest Of Europe Security Testing Market Revenue, By Industry Vertical, 2020–2030 ($Million)
Table 94.Asia-pacific Security Testing Market Revenue, By Deployment Mode, 2020–2030 ($Million)
Table 95.Asia-pacific Security Testing Market Revenue, By Security Type, 2020–2030 ($Million)
Table 96.Asia-pacific Security Testing Market Revenue, By Application Security, 2020–2030 ($Million)
Table 97.Asia-pacific Security Testing Market Revenue, By Web Application Security, 2020–2030 ($Million)
Table 98.Asia-pacific Security Testing Market Revenue, By Enterprise Size, 2020–2030 ($Million)
Table 99.Asia-pacific Security Testing Market Revenue, By Industry Vertical, 2020–2030 ($Million)
Table 100.Asia-pacific Security Testing Market Revenue, By Country, 2020–2028 ($Million)
Table 101.China Security Testing Market Revenue, By Deployment Mode, 2020–2030 ($Million)
Table 102.China Security Testing Market Revenue, By Security Type, 2020–2030 ($Million)
Table 103.China Security Testing Market Revenue, By Application Security, 2020–2030 ($Million)
Table 104.China Security Testing Market Revenue, By Web Application Security, 2020–2030 ($Million)
Table 105.China Security Testing Market Revenue, By Enterprise Size, 2020–2030 ($Million)
Table 106.China Security Testing Market Revenue, By Industry Vertical, 2020–2030 ($Million)
Table 107.Japan Security Testing Market Revenue, By Deployment Mode, 2020–2030 ($Million)
Table 108.Japan Security Testing Market Revenue, By Security Type, 2020–2030 ($Million)
Table 109.Japan Security Testing Market Revenue, By Application Security, 2020–2030 ($Million)
Table 110.Japan Security Testing Market Revenue, By Web Application Security, 2020–2030 ($Million)
Table 111.Japan Security Testing Market Revenue, By Enterprise Size, 2020–2030 ($Million)
Table 112.Japan Security Testing Market Revenue, By Industry Vertical, 2020–2030 ($Million)
Table 113.India Security Testing Market Revenue, By Deployment Mode, 2020–2030 ($Million)
Table 114.India Security Testing Market Revenue, By Security Type, 2020–2030 ($Million)
Table 115.India Security Testing Market Revenue, By Application Security, 2020–2030 ($Million)
Table 116.India Security Testing Market Revenue, By Web Application Security, 2020–2030 ($Million)
Table 117.India Security Testing Market Revenue, By Enterprise Size, 2020–2030 ($Million)
Table 118.India Security Testing Market Revenue, By Industry Vertical, 2020–2030 ($Million)
Table 119.Australia Security Testing Market Revenue, By Deployment Mode, 2020–2030 ($Million)
Table 120.Australia Security Testing Market Revenue, By Security Type, 2020–2030 ($Million)
Table 121.Australia Security Testing Market Revenue, By Application Security, 2020–2030 ($Million)
Table 122.Australia Security Testing Market Revenue, By Web Application Security, 2020–2030 ($Million)
Table 123.Australia Security Testing Market Revenue, By Enterprise Size, 2020–2030 ($Million)
Table 124.Australia Security Testing Market Revenue, By Industry Vertical, 2020–2030 ($Million)
Table 125.South Korea Security Testing Market Revenue, By Deployment Mode, 2020–2030 ($Million)
Table 126.South Korea Security Testing Market Revenue, By Security Type, 2020–2030 ($Million)
Table 127.South Korea Security Testing Market Revenue, By Application Security, 2020–2030 ($Million)
Table 128.South Korea Security Testing Market Revenue, By Web Application Security, 2020–2030 ($Million)
Table 129.South Korea Security Testing Market Revenue, By Enterprise Size, 2020–2030 ($Million)
Table 130.South Korea Security Testing Market Revenue, By Industry Vertical, 2020–2030 ($Million)
Table 131.Rest Of Asia-pacific Security Testing Market Revenue, By Deployment Mode, 2020–2030 ($Million)
Table 132.Rest Of Asia-pacific Security Testing Market Revenue, By Security Type, 2020–2030 ($Million)
Table 133.Rest Of Asia-pacific Security Testing Market Revenue, By Application Security, 2020–2030 ($Million)
Table 134.Rest Of Asia-pacific Security Testing Market Revenue, By Web Application Security, 2020–2030 ($Million)
Table 135.Rest Of Asia-pacific Security Testing Market Revenue, By Enterprise Size, 2020–2030 ($Million)
Table 136.Rest Of Asia-pacific Security Testing Market Revenue, By Industry Vertical, 2020–2030 ($Million)
Table 137.Lamea Security Testing Market Revenue, By Deployment Mode, 2020–2030 ($Million)
Table 138.Lamea Security Testing Market Revenue, By Security Type, 2020–2030 ($Million)
Table 139.Lamea Security Testing Market Revenue, By Application Security, 2020–2030 ($Million)
Table 140.Lamea Security Testing Market Revenue, By Web Application Security, 2020–2030 ($Million)
Table 141.Lamea Security Testing Market Revenue, By Enterprise Size, 2020–2030 ($Million)
Table 142.Lamea Security Testing Market Revenue, By Industry Vertical, 2020–2030 ($Million)
Table 143.Lamea Security Testing Market Revenue, By Country, 2020–2028 ($Million)
Table 144.Latin America Security Testing Market Revenue, By Deployment Mode, 2020–2030 ($Million)
Table 145.Latin America Security Testing Market Revenue, By Security Type, 2020–2030 ($Million)
Table 146.Latin America Security Testing Market Revenue, By Application Security, 2020–2030 ($Million)
Table 147.Latin America Security Testing Market Revenue, By Web Application Security, 2020–2030 ($Million)
Table 148.Latin America Security Testing Market Revenue, By Enterprise Size, 2020–2030 ($Million)
Table 149.Latin America Security Testing Market Revenue, By Industry Vertical, 2020–2030 ($Million)
Table 150.Middle East Security Testing Market Revenue, By Deployment Mode, 2020–2030 ($Million)
Table 151.Middle East Security Testing Market Revenue, By Security Type, 2020–2030 ($Million)
Table 152.Middle East Security Testing Market Revenue, By Application Security, 2020–2030 ($Million)
Table 153.Middle East Security Testing Market Revenue, By Web Application Security, 2020–2030 ($Million)
Table 154.Middle East Security Testing Market Revenue, By Enterprise Size, 2020–2030 ($Million)
Table 155.Middle East Security Testing Market Revenue, By Industry Vertical, 2020–2030 ($Million)
Table 156.Africa Security Testing Market Revenue, By Deployment Mode, 2020–2030 ($Million)
Table 157.Africa Security Testing Market Revenue, By Security Type, 2020–2030 ($Million)
Table 158.Africa Security Testing Market Revenue, By Application Security, 2020–2030 ($Million)
Table 159.Africa Security Testing Market Revenue, By Web Application Security, 2020–2030 ($Million)
Table 160.Africa Security Testing Market Revenue, By Enterprise Size, 2020–2030 ($Million)
Table 161.Africa Security Testing Market Revenue, By Industry Vertical, 2020–2030 ($Million)
Table 162.At&T.: Key Executives
Table 163.At&T: Company Snapshot
Table 164.At&T: Operating Segments
Table 165.At&T: Product Portfolio
Table 166.Cigniti: Key Executives
Table 167.Cigniti: Company Snapshot
Table 168.Cigniti: Product Portfolio
Table 169.International Business Machines Corporation: Key Executive
Table 170.International Business Machines Corporation: Company Snapshot
Table 171.International Business Machines Corporation: Operating Segments
Table 172.International Business Machines Corporation: Product Portfolio
Table 173.Mcafee, Llc: Key Executives
Table 174.Mcafee, Llc: Company Snapshot
Table 175.Mcafee, Llc: Product Portfolio
Table 176.Micro Focus: Key Executives
Table 177.Micro Focus: Company Snapshot
Table 178.Micro Focus: Product Portfolio
Table 179.Ntt Security Appsec Solutions Inc.: Key Executives
Table 180.Ntt Security Appsec Solutions Inc.: Company Snapshot
Table 181.Ntt Security Appsec Solutions Inc.: Product Portfolio
Table 182.Rapid7: Key Executives
Table 183.Rapid7: Company Snapshot
Table 184.Rapid7: Product Portfolio
Table 185.Secureworks, Inc.: Key Executives
Table 186.Secureworks, Inc.: Company Snapshot
Table 187.Secureworks, Inc.: Product Portfolio
Table 188.Synopsys, Inc.: Key Executives
Table 189.Synopsys, Inc.: Company Snapshot
Table 190.Synopsys, Inc.: Product Portfolio
Table 191.Veracode: Key Executives
Table 192.Veracode: Company Snapshot
Table 193.Veracode: Product Portfolio
List Of Figures
Figure 01.Key Market Segments
Figure 02.Security Testing Market Snapshot, By Segmentation, 2020–2030
Figure 03.Security Testing Market Snapshot, By Country, 2020–2030
Figure 04.Top Impacting Factors
Figure 05.Top Investment Pockets
Figure 06.Moderate -to-high Bargaining Power Of Suppliers
Figure 07.Moderate-to-high Bargaining Power Of Buyer
Figure 08.Moderate –to- High Threat Of Substitutes
Figure 09.Moderate-to-high Threat Of New Entrants
Figure 10.Low-to-high Competitive Rivalry
Figure 11.Security Testing Market Revenue, By Deployment Mode, 2020–2030 ($Million)
Figure 12.Comparative Share Analysis Of Security Testing Market For On-premise, By Country, 2020 & 2030 (%)
Figure 13.Comparative Share Analysis Of Security Testing Market For Cloud, By Country, 2020 & 2030(%)
Figure 14.Security Testing Market Revenue, By Security Type, 2020–2030 ($Million)
Figure 15.Comparative Share Analysis Of Security Testing Market For Network Security, By Country, 2020 & 2030 (%)
Figure 16.Comparative Share Analysis Of Security Testing Market For Application Security, By Country, 2020 & 2030(%)
Figure 17.Application Security Testing Market, By Offering, 2020–2030
Figure 18.Web-based Application Security Testing Market, By Offering, 2020–2030
Figure 19.Comparative Share Analysis Of Security Testing Market For Device Security, By Country, 2020 & 2030 (%)
Figure 20.Comparative Share Analysis Of Security Testing Market For Others, By Country, 2020 & 2030(%)
Figure 21.Security Testing Market Revenue, By Enterprise Size, 2020–2030 ($Million)
Figure 22.Comparative Share Analysis Of Security Testing Market For Large Enterprises, By Country, 2020 & 2030 (%)
Figure 23.Comparative Share Analysis Of Security Testing Market For Smes, By Country, 2020 & 2030(%)
Figure 24.Security Testing Market Revenue, By Industry Vertical, 2020–2030 ($Million)
Figure 25.Comparative Share Analysis Of Security Testing Market For Bfsi, By Country, 2020 & 2030(%)
Figure 26.Comparative Share Analysis Of Security Testing Market For It & Telecom, By Country, 2020 & 2030 (%)
Figure 27.Comparative Share Analysis Of Security Testing Market For Healthcare, By Country, 2020 & 2030 (%)
Figure 28.Comparative Share Analysis Of Security Testing Market For Retail & E-commerce, By Country, 2020 & 2030(%)
Figure 29.Comparative Share Analysis Of Security Testing Market For Education, By Country, 2020 & 2030(%)
Figure 30.Comparative Share Analysis Of Security Testing Market For Others, By Country, 2020 & 2030(%)
Figure 31.U.S. Security Testing Market Revenue, 2020–2030 ($Million)
Figure 32.Canada Security Testing Market Revenue, 2020–2030 ($Million)
Figure 33.Uk Security Testing Market Revenue, 2020–2030 ($Million)
Figure 34.Germany Security Testing Market Revenue, 2020–2030 ($Million)
Figure 35.France Security Testing Market Revenue, 2020–2030 ($Million)
Figure 36.Italy Security Testing Market Revenue, 2020–2030 ($Million)
Figure 37.Spain Security Testing Market Revenue, 2020–2030 ($Million)
Figure 38.Netherlands Security Testing Market Revenue, 2020–2030 ($Million)
Figure 39.Rest Of Europe Security Testing Market Revenue, 2020–2030 ($Million)
Figure 40.China Security Testing Market Revenue, 2020–2030 ($Million)
Figure 41.Japan Security Testing Market Revenue, 2020–2030 ($Million)
Figure 42.India Security Testing Market Revenue, 2020–2030 ($Million)
Figure 43.Australia Security Testing Market Revenue, 2020–2030 ($Million)
Figure 44.South Korea Security Testing Market Revenue, 2020–2030 ($Million)
Figure 45.Rest Of Asia-pacific Security Testing Market Revenue, 2020–2030 ($Million)
Figure 46.Latin America Security Testing Market Revenue, 2020–2030 ($Million)
Figure 47.Middle East Security Testing Market Revenue, 2020–2030 ($Million)
Figure 48.Africa Security Testing Market Revenue, 2020–2030 ($Million)
Figure 49.Key Player Positioning Analysis: Global Security Testing Market
Figure 50.Competitive Dashboard
Figure 51.Competitive Dashboard
Figure 52.Competitive Heatmap Of Key Players
Figure 53.Top Winning Strategies, By Year, 2019-2021
Figure 54.Top Winning Strategies, By Development, 2019-2021
Figure 55.Top Winning Strategies, By Company, 2019-2021
Figure 56.At&T: Revenue, 2018–2020 ($Million)
Figure 57.At&T: Revenue Share By Segment, 2020 (%)
Figure 58.At&T: Revenue Share By Region, 2020 (%)
Figure 59.Cigniti: Revenue, 2018–2020 ($Million)
Figure 60.R&D Expenditure, 2018–2020 ($Million)
Figure 61.International Business Machines Corporation: Revenue, 2018–2020 ($Million)
Figure 62.International Business Machines Corporation: Revenue Share By Segment, 2020 (%)
Figure 63.International Business Machines Corporation: Revenue Share By Region, 2020 (%)
Figure 64.R&D Expenditure, 2017–2019 ($Million)
Figure 65.Micro Focus: Revenue, 2018–2020 ($Million)
Figure 66.Micro Focus: Revenue Share By Region, 2020 (%)
Figure 67.R&D Expenditure, 2018–2020 ($Million)
Figure 68.Rapid7: Net Sales, 2018–2020 ($Million),
Figure 69.Rapid7: Revenue Share By Region (2020)
Figure 70.R&D Expenditure, 2019–2021 ($Million)
Figure 71.Secureworks, Inc.: Net Sales, 2019–2021 ($Million),
Figure 72.Secureworks, Inc.: Revenue Share By Region (2020)
Figure 73.R&D Expenditure, 2018–2020 ($Million)
Figure 74.Synopsys, Inc..: Net Sales, 2019–2021 ($Million),
Figure 75.Synopsys, Inc.: Revenue Share By Region (2020)
$6169
$10665
HAVE A QUERY?
OUR CUSTOMER

SIMILAR REPORTS