
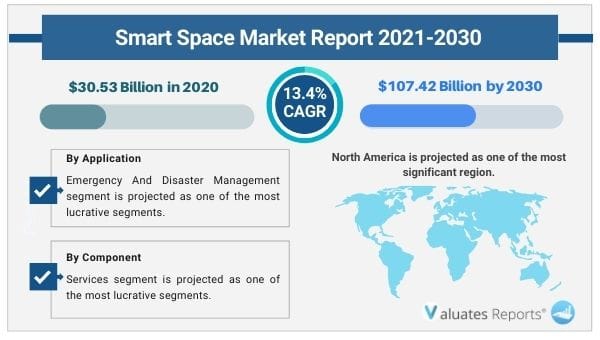
The global smart space market was valued at $30.53 billion in 2020, and is projected to reach $107.42 billion by 2030, registering a CAGR of 13.4%. Digital technologies such as Internet of Things (IoT), cloud computing, connected devices, and Artificial Intelligence (AI) are transforming every sector and part of the world. These have changed work life of people in offices, process of production in factories and industries, and daily operations in cities. Smart space is also one of these key technologies, which is bringing innovation and changes across various sectors by creating smart and connected environment. Proliferation of advanced technologies such as internet of things (IoT) and artificial intelligence (AI) drives the growth of the smart space market.
The COVID-19 pandemic has significantly fostered growth rate of the market owing to the increased shift toward creation of safe smart spaces and significant increase in the IoT deployment. In addition to this, the proliferation of smart buildings driven by pandemic is impacting positively on the market. Smart buildings offers functions such as social distancing, occupancy tracking/monitoring, ventilation and air-conditioning (HVAC) systems, smart heating, and stricter cleaning requirements
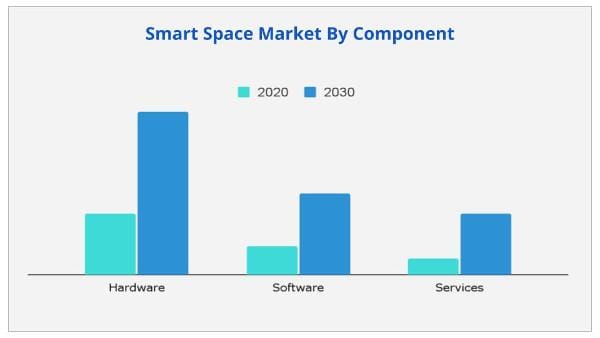
On the basis of component, the hardware segment dominated the smart space market share in 2020, and is expected to maintain its dominance in the upcoming years. This is due to the increased adoption of smart devices in smart homes and buildings, which is the major factor that drives the demand for various hardware in the smart space industry. However, the services segment is expected to witness highest growth rate during the forecast period.
By space type, the smart indoor spaces segment dominated the growth of the smart space market size in 2020, and is expected to maintain its dominance in the upcoming years. Increase in trend of making homes, buildings, and other indoor spaces smarter is the major factor that drives the adoption of smart space platform in this segment. Moreover, a recent report published by the British Council for Offices (BCO) on “Improving Productivity in the Workplace” stated that indoor environments have a significant effect on an actual workplace productivity, which indicates that workplaces need to be smart and modern.
North America dominates the smart space market. Market growth in this region is attributed to several factors such as huge government funding on innovative as well as smart technologies, increased number of IoT devices, and a strong technical base. However, Asia-Pacific is expected to witness highest growth rate during the forecast period, owing to the proliferation of connected systems fueled by the ongoing trend of smart offices and homes in the region along with the government-driven infrastructural projects.
The report focuses on the growth prospects, restraints, and global smart space market analysis. The study provides Porter’s five forces analysis of the global market forecast to understand the impact of various factors such as bargaining power of suppliers, competitive intensity of competitors, the threat of new entrants, threat of substitutes, and bargaining power of buyers on the global smart space market trends.
The global smart space market is segmented based on component, space type, application, end user, industry vertical, and region. Based on component, the market is divided into hardware, software, and services. Based on space type, it is bifurcated into smart indoor spaces and smart outdoor spaces.
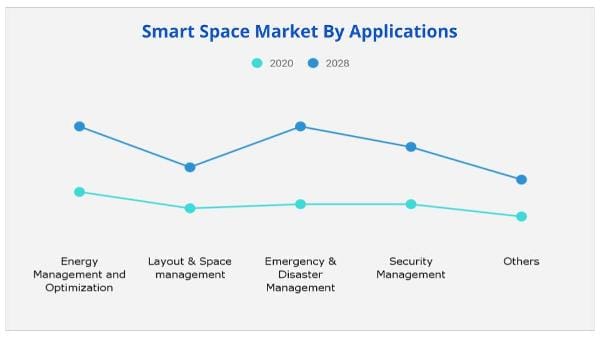
Based on application, it is classified into energy management and optimization, layout & space management, emergency & disaster management, and security management, and others. Depending on end user, smart space market share is segmented into residential and commercial. The commercial segment is further categorized into energy & utility, transportation & logistic, healthcare, education, retail, manufacturing, government, and others. Based on region, the market is analyzed across North America, Europe, Asia-Pacific, and LAMEA.
The global smart space market was valued at $30.53 billion in 2020, and is projected to reach $107.42 billion by 2030, registering a CAGR of 13.4%. The current estimation of 2030 is projected to be higher than pre-COVID-19 estimates. The COVID-19 pandemic has significantly fostered the growth rate of the market owing to the increased shift toward creation of safe smart spaces and significant increase in the IoT deployment.
In addition to this, the proliferation of smart buildings driven by pandemic is impacting positively on the market. Smart buildings offer functions such as social distancing, occupancy tracking/monitoring, ventilation and air-conditioning (HVAC) systems, smart heating, and stricter cleaning requirements.
The global smart space market is influenced by several factors such as the proliferation of advanced technologies such as the Internet of Things (IoT) and artificial intelligence (AI) drive the growth of the market. In addition, the rise in Greenfield projects and the increase in environmental concerns across the globe are also expected to boost market growth. However, the high initial capital expenditure required for connected devices & other hardware, and rise in privacy concerns pertaining to information manipulation are expected to impede the market growth during the forecast period. Furthermore, an increase in smart city initiatives across all the regions and the emergence of 5G technology are expected to provide major growth opportunities for the market in upcoming years.
Several developing countries are shifting toward Greenfield strategies to reduce the pressure on more developed cities, as these cities face issues such as increased population and infrastructural constraints. Moreover, Greenfield projects bring integrated smart infrastructure for new buildings, factories, airports, and power plants, which drives the market growth for smart space. The Greenfield project mainly focuses on new infrastructures and buildings; thus, eliminating the need of integrating with any legacy systems, which is also one of the major factors that drives the market growth for smart space.
For instance, South Korea’s Songdo development is one of the Greenfield projects that have highly energy-efficient and digital infrastructure. In addition, it also has a household waste management system that collects waste directly from homes and takes it to processing centers through network of tunnels for sorting and treatment, which further eliminates the need for garbage trucks.
Smart space is a digital or physical environment where humans interact with technology enabled systems in connected as well as coordinated and smart ecosystems. The smart spaces environment is a part of other relative concepts such as smart/connected homes, connected factories, and smart cities. The smart city initiative thus involves the adoption of digital technologies for smart retail, Internet of Things (IoT), smart mobility, smart grid, and others to create a sustainable city.
In addition, it also enhances city operations, businesses, and lifestyle of people, which in turn provides major opportunities to the smart space market. For instance, smart cities initiatives include enhanced connectivity, better security, increased awareness toward infrastructure issues, and other benefits, which thus provide major opportunities for the market growth. Moreover, rise in investment by various governments in smart city projects is also creating the opportunity for the market. In addition, countries such as India, the U.S., China, Europe, and others, are investing heavily in smart city projects to tackle urban issues. For instance, the U.S. government is expected to invest approximately $160 million in smart city initiatives in upcoming five years. Also, the Indian government has announced to invest $30 billion in smart city initiatives, out of which 80% of the funds would be expended on area-based development (ABD) and remaining 20% on ICT solutions.
| Report Metric |
Details |
| Base Year: |
2020 |
| Market Size in 2020: |
USD 30.53 Billion |
| Forecast Period: |
2021 to 2030 |
| Forecast Period 2021 to 2030 CAGR: |
13.4% |
| 2030 Value Projection: |
USD 107.42 Billion |
| No. of Pages: |
285 |
| Tables & Figures |
141 |
| Charts |
80 |
| Segments covered: |
Component, Space Type, Application and End User, Region |
Ans. Smart Space Market was valued at USD 30.53 Billion by 2020 and is projected to reach USD 107.42 Billion in 2030, growing at a CAGR of 13.4% from 2021 to 2030.
Ans. Some of the key smart space industry players profiled in the report include Cisco Systems, Inc., Eutech Cybernetic Pte. Ltd., Hitachi Vantara Corporation, Huawei Technologies Co., Ltd., International Business Machines Corporation (IBM), Schneider Electric SE, Siemens AG, SmartSpace Software Plc, Spacewell, and others.
Ans. Increase in smart city initiatives across all the regions and emergence of 5G technology are expected to provide major growth opportunities for smart space market in upcoming years.
Ans. The commercial segment dominated growth in the smart space market share in 2020
Ans. Asia-Pacific is expected to observe highest growth rate during the forecast period. The market for smart space technology in Asia-Pacific is fueled by high demand and increase in electricity consumption as well as growth in IoT penetration in countries such as India, China, Japan, and others
Ans. The forecast period for the Smart Space Market is 2021 to 2030
CHAPTER 1:INTRODUCTION
1.1.REPORT DESCRIPTION
1.2.KEY BENEFITS FOR STAKEHOLDERS
1.3.KEY MARKET SEGMENTS
1.3.1.Key market players
1.4.RESEARCH METHODOLOGY
1.4.1.Primary research
1.4.2.Secondary research
1.4.3.Analyst tools and models
CHAPTER 2:EXECUTIVE SUMMARY
2.1.CXO PERSPECTIVE
CHAPTER 3:MARKET OVERVIEW
3.1.MARKET DEFINITION AND SCOPE
3.2.KEY FINDINGS
3.2.1.Top impacting factors
3.2.2.Top investment pockets
3.3.PORTER’S FIVE FORCES ANALYSIS
3.4.VALUE CHAIN ANALYSIS
3.5.IMPACT OF GOVERNMENT REGULATIONS ON GLOBAL SMART SPACE MARKET
3.6.MARKET DYNAMICS
3.6.1.Drivers
3.6.1.1.Proliferation of advanced technologies such as Internet of Things (IoT) and Artificial Intelligence (AI)
3.6.1.2.Increase in environmental concerns
3.6.1.3.Rise in number of greenfield projects
3.6.2.Restraints
3.6.2.1.High Initial Capital Expenditure
3.6.2.2.Growth in privacy concerns pertaining to information manipulation
3.6.3.Opportunities
3.6.3.1.Rise in smart cities initiatives
3.6.3.2.Advent of 5G technology
3.7.COVID-19 IMPACT ANALYSIS
3.7.1.Impact on market size
3.7.2.Consumer trends, preferences, and budget impact
3.7.3.Economic impact
3.7.4.Regulatory framework
3.7.5.Key player strategies to tackle negative impact
3.7.6.Opportunity window
CHAPTER 4:GLOBAL SMART SPACE MARKET, BY COMPONENT
4.1.OVERVIEW
4.2.HARDWARE
4.2.1.Key market trends, growth factors, and opportunities
4.2.2.Market size and forecast, by region
4.2.3.Market analysis, by country
4.3.SOFTWARE
4.3.1.Key market trends, growth factors, and opportunities
4.3.2.Market size and forecast, by region
4.3.3.Market analysis, by country
4.4.SERVICES
4.4.1.Key market trends, growth factors, and opportunities
4.4.2.Market size and forecast, by region
4.4.3.Market analysis, by country
CHAPTER 5:GLOBAL SMART SPACE MARKET, BY SPACE TYPE
5.1.OVERVIEW
5.2.SMART INDOOR SPACE
5.2.1.Key market trends, growth factors, and opportunities
5.2.2.Market size and forecast, by region
5.2.3.Market analysis, by country
5.3.SMART OUTDOOR SPACE
5.3.1.Key market trends, growth factors, and opportunities
5.3.2.Market size and forecast, by region
5.3.3.Market analysis, by country
CHAPTER 6:GLOBAL SMART SPACE MARKET, BY APPLICATION
6.1.OVERVIEW
6.2.ENERGY MANAGEMENT AND OPTIMIZATION
6.2.1.Key market trends, growth factors, and opportunities
6.2.2.Market size and forecast, by region
6.2.3.Market analysis, by country
6.3.LAYOUT & SPACE MANAGEMENT
6.3.1.Key market trends, growth factors, and opportunities
6.3.2.Market size and forecast, by region
6.3.3.Market analysis, by country
6.4.EMERGENCY & DISASTER MANAGEMENT
6.4.1.Key market trends, growth factors, and opportunities
6.4.2.Market size and forecast, by region
6.4.3.Market analysis, by country
6.5.SECURITY MANAGEMENT
6.5.1.Key market trends, growth factors, and opportunities
6.5.2.Market size and forecast, by region
6.5.3.Market analysis, by country
6.6.OTHER
6.6.1.Key market trends, growth factors, and opportunities
6.6.2.Market size and forecast, by region
6.6.3.Market analysis, by country
CHAPTER 7:GLOBAL SMART SPACE MARKET, BY END-USER
7.1.OVERVIEW
7.2.RESIDENTIAL
7.2.1.Key market trends, growth factors, and opportunities
7.2.2.Market size and forecast, by region
7.2.3.Market analysis, by country
7.3.COMMERCIAL
7.3.1.Key market trends, growth factors, and opportunities
7.3.2.Energy and utility
7.3.3.Transportation and logistics
7.3.4.Healthcare
7.3.5.Education
7.3.6.Retail
7.3.7.Manufacturing
7.3.8.Government
7.3.9.Others
7.3.10.Market size and forecast, by region
7.3.11.Market analysis, by country
CHAPTER 8:SMART SPACE MARKET, BY REGION
8.1.OVERVIEW
8.2.NORTH AMERICA
8.2.1.Key market trends, growth factors, and opportunities
8.2.2.Market size and forecast, by component
8.2.3.Market size and forecast, by space type
8.2.4.Market size and forecast, by application
8.2.5.Market size and forecast, by end user
8.2.6.Market analysis by country
8.2.6.1.U.S.
8.2.6.1.1.Market size and forecast, by component
8.2.6.1.2.Market size and forecast, by space type
8.2.6.1.3.Market size and forecast, by application
8.2.6.1.4.Market size and forecast, by end user
8.2.6.2.Canada
8.2.6.2.1.Market size and forecast, by component
8.2.6.2.2.Market size and forecast, by space type
8.2.6.2.3.Market size and forecast, by application
8.2.6.2.4.Market size and forecast, by end user
8.3.EUROPE
8.3.1.Key market trends, growth factors, and opportunities
8.3.2.Market size and forecast, by component
8.3.3.Market size and forecast, by space type
8.3.4.Market size and forecast, by application
8.3.5.Market size and forecast, by end user
8.3.6.Market analysis by country
8.3.6.1.UK
8.3.6.1.1.Market size and forecast, by component
8.3.6.1.2.Market size and forecast, by space type
8.3.6.1.3.Market size and forecast, by application
8.3.6.1.4.Market size and forecast, by end user
8.3.6.2.Germany
8.3.6.2.1.Market size and forecast, by component
8.3.6.2.2.Market size and forecast, by space type
8.3.6.2.3.Market size and forecast, by application
8.3.6.2.4.Market size and forecast, by end user
8.3.6.3.France
8.3.6.3.1.Market size and forecast, by component
8.3.6.3.2.Market size and forecast, by space type
8.3.6.3.3.Market size and forecast, by application
8.3.6.3.4.Market size and forecast, by end user
8.3.6.4.Italy
8.3.6.4.1.Market size and forecast, by component
8.3.6.4.2.Market size and forecast, by space type
8.3.6.4.3.Market size and forecast, by application
8.3.6.4.4.Market size and forecast, by end user
8.3.6.5.Spain
8.3.6.5.1.Market size and forecast, by component
8.3.6.5.2.Market size and forecast, by space type
8.3.6.5.3.Market size and forecast, by application
8.3.6.5.4.Market size and forecast, by end user
8.3.6.6.Rest of Europe
8.3.6.6.1.Market size and forecast, by component
8.3.6.6.2.Market size and forecast, by space type
8.3.6.6.3.Market size and forecast, by application
8.3.6.6.4.Market size and forecast, by end user
8.4.ASIA-PACIFIC
8.4.1.Key market trends, growth factors, and opportunities
8.4.2.Market size and forecast, by component
8.4.3.Market size and forecast, by space type
8.4.4.Market size and forecast, by application
8.4.5.Market size and forecast, by end user
8.4.6.Market analysis by country
8.4.6.1.China
8.4.6.1.1.Market size and forecast, by component
8.4.6.1.2.Market size and forecast, by space type
8.4.6.1.3.Market size and forecast, by application
8.4.6.1.4.Market size and forecast, by end user
8.4.6.2.Japan
8.4.6.2.1.Market size and forecast, by component
8.4.6.2.2.Market size and forecast, by space type
8.4.6.2.3.Market size and forecast, by application
8.4.6.2.4.Market size and forecast, by end user
8.4.6.3.India
8.4.6.3.1.Market size and forecast, by component
8.4.6.3.2.Market size and forecast, by space type
8.4.6.3.3.Market size and forecast, by application
8.4.6.3.4.Market size and forecast, by end user
8.4.6.4.South Korea
8.4.6.4.1.Market size and forecast, by component
8.4.6.4.2.Market size and forecast, by space type
8.4.6.4.3.Market size and forecast, by application
8.4.6.4.4.Market size and forecast, by end user
8.4.6.5.Australia
8.4.6.5.1.Market size and forecast, by component
8.4.6.5.2.Market size and forecast, by space type
8.4.6.5.3.Market size and forecast, by application
8.4.6.5.4.Market size and forecast, by end user
8.4.6.6.Rest of Asia-Pacific
8.4.6.6.1.Market size and forecast, by component
8.4.6.6.2.Market size and forecast, by space type
8.4.6.6.3.Market size and forecast, by application
8.4.6.6.4.Market size and forecast, by end user
8.5.LAMEA
8.5.1.Key market trends, growth factors, and opportunities
8.5.2.Market size and forecast, by component
8.5.3.Market size and forecast, by space type
8.5.4.Market size and forecast, by application
8.5.5.Market size and forecast, by end user
8.5.6.Market analysis by country
8.5.6.1.Latin America
8.5.6.1.1.Market size and forecast, by component
8.5.6.1.2.Market size and forecast, by space type
8.5.6.1.3.Market size and forecast, by application
8.5.6.1.4.Market size and forecast, by end user
8.5.6.2.Middle East
8.5.6.2.1.Market size and forecast, by component
8.5.6.2.2.Market size and forecast, by space type
8.5.6.2.3.Market size and forecast, by application
8.5.6.2.4.Market size and forecast, by end user
8.5.6.3.Africa
8.5.6.3.1.Market size and forecast, by component
8.5.6.3.2.Market size and forecast, by space type
8.5.6.3.3.Market size and forecast, by application
8.5.6.3.4.Market size and forecast, by end user
CHAPTER 9:COMPETITIVE LANDSCAPE
9.1.INTRODUCTION
9.1.1.Market player positioning, 2020
9.2.TOP WINNING STRATEGIES
9.3.COMPETITIVE DASHBOARD
9.4.COMPETITIVE HEATMAP
CHAPTER 10:COMPANY PROFILES
10.1.CISCO SYSTEMS, INC.
10.1.1.Company overview
10.1.2.Key Executives
10.1.3.Company snapshot
10.1.4.Product portfolio
10.1.5.R&D Expenditure
10.1.6.Business performance
10.1.7.Key strategic moves and developments
10.2.COOR
10.2.1.Company overview
10.2.2.Key Executives
10.2.3.Company snapshot
10.2.4.Product portfolio
10.2.5.Business performance
10.2.6.Key strategic moves and developments
10.3.EUTECH CYBERNETIC PTE. LTD.
10.3.1.Company overview
10.3.2.Key Executives
10.3.3.Company snapshot
10.3.4.Product portfolio
10.3.5.Key strategic moves and developments
10.4.HITACHI VANTARA CORPORATION
10.4.1.Company overview
10.4.2.Key Executives
10.4.3.Company snapshot
10.4.4.Operating business segments
10.4.5.Product portfolio
10.4.6.R&D Expenditure
10.4.7.Business performance
10.4.8.Key strategic moves and developments
10.5.HUAWEI TECHNOLOGIES CO., LTD.
10.5.1.Company overview
10.5.2.Key Executives
10.5.3.Company snapshot
10.5.4.Operating business segments
10.5.5.Product portfolio
10.5.6.R&D Expenditure
10.5.7.Business performance
10.5.8.Key strategic moves and developments
10.6.INTERNATIONAL BUSINESS MACHINES CORPORATION
10.6.1.Company overview
10.6.2.Key Executives
10.6.3.Company snapshot
10.6.4.Operating business segments
10.6.5.Product portfolio
10.6.6.R&D Expenditure
10.6.7.Business performance
10.6.8.Key strategic moves and developments
10.7.SCHNEIDER ELECTRIC SE
10.7.1.Company overview
10.7.2.Key Executives
10.7.3.Company snapshot
10.7.4.Operating business segments
10.7.5.Product portfolio
10.7.6.R&D Expenditure
10.7.7.Business performance
10.7.8.Key strategic moves and developments
10.8.SIEMENS AG
10.8.1.Company overview
10.8.2.Key Executives
10.8.3.Company snapshot
10.8.4.Operating business segments
10.8.5.Product portfolio
10.8.6.R&D Expenditure
10.8.7.Business performance
10.8.8.Key strategic moves and developments
10.9.SMARTSPACE SOFTWARE PLC
10.9.1.Company overview
10.9.2.Key Executives
10.9.3.Company snapshot
10.9.4.Operating business segments
10.9.5.Product portfolio
10.9.6.R&D Expenditure
10.9.7.Business performance
10.9.8.Key strategic moves and developments
10.10.SPACEWELL
10.10.1.Company overview
10.10.2.Key Executives
10.10.3.Company snapshot
10.10.4.Product portfolio
10.10.5.Key strategic moves and developments
Table 01.Global Smart Space Market, By Component, 2020-2030 ($Billion)
Table 02.Smart Space Market For Hardware, By Region, 2020-2030 ($Billion)
Table 03.Smart Space Market For Software, By Region, 2020-2030 ($Billion)
Table 04.Smart Space Market For Services, By Region, 2020-2030 ($Billion)
Table 05.Global Smart Space Market, By Space Type, 2020-2030 ($Billion)
Table 06.Smart Space Market For Smart Indoor Space, By Region, 2020-2030 ($Billion)
Table 07.Smart Space Market For Smart Outdoor Space, By Region, 2020-2030 ($Billion)
Table 08.Global Smart Space Market, By Application, 2020-2030 ($Billion)
Table 09.Smart Space Market For Energy Management And Optimization, By Region, 2020-2030 ($Billion)
Table 10.Smart Space Market For Layout & Space Management, By Region, 2020-2030 ($Billion)
Table 11.Smart Space Market For Emergency & Disaster Management, By Region, 2020-2030 ($Billion)
Table 12.Smart Space Market For Security Management, By Region, 2020-2030 ($Billion)
Table 13.Smart Space Market For Other, By Region, 2020-2030 ($Billion)
Table 14.Global Smart Space Market, By End User, 2020-2030 ($Billion)
Table 15.Smart Space Market For Abc, By Region, 2020-2030 ($Billion)
Table 16.Smart Space Market For Commercial, By Region, 2020-2030 ($Billion)
Table 17.Smart Space Market Revenue, By Region, 2020–2030 ($Billion)
Table 18.North America Smart Space Market, By Component, 2020–2030 ($Billion)
Table 19.North America Smart Space Market, By Space Type, 2020–2030 ($Billion)
Table 20.North America Smart Space Market, By Application, 2020–2030 ($Billion)
Table 21.North America Smart Space Market, By End User, 2020–2030 ($Billion)
Table 22.North America Smart Space Market, By Country, 2020-2030 ($Billion)
Table 23.U.S. Smart Space Market, By Component, 2020–2030 ($Billion)
Table 24.U.S. Smart Space Market, By Space Type, 2020–2030 ($Billion)
Table 25.U.S. Smart Space Market, By Application, 2020–2030 ($Billion)
Table 26.U.S. Smart Space Market, By End User, 2020–2030 ($Billion)
Table 27.Canada Smart Space Market, By Component, 2020–2030 ($Billion)
Table 28.Canada Smart Space Market, By Space Type, 2020–2030 ($Billion)
Table 29.Canada Smart Space Market, By Application, 2020–2030 ($Billion)
Table 30.Canada Smart Space Market, By End User, 2020–2030 ($Billion)
Table 31.Europe Smart Space Market, By Component, 2020–2030 ($Billion)
Table 32.Europe Smart Space Market, By Space Type, 2020–2030 ($Billion)
Table 33.Europe Smart Space Market, By Application, 2020–2030 ($Billion)
Table 34.Europe Smart Space Market, By End User, 2020–2030 ($Billion)
Table 35.Europe Smart Space Market, By Country, 2020-2030 ($Billion)
Table 36.Uk Smart Space Market, By Component, 2020–2030 ($Billion)
Table 37.Uk Smart Space Market, By Space Type, 2020–2030 ($Billion)
Table 38.Uk Smart Space Market, By Application, 2020–2030 ($Billion)
Table 39.Uk Smart Space Market, By End User, 2020–2030 ($Billion)
Table 40.Germany Smart Space Market, By Component, 2020–2030 ($Billion)
Table 41.Germany Smart Space Market, By Space Type, 2020–2030 ($Billion)
Table 42.Germany Smart Space Market, By Application, 2020–2030 ($Billion)
Table 43.Germany Smart Space Market, By End User, 2020–2030 ($Billion)
Table 44.France Smart Space Market, By Component, 2020–2030 ($Billion)
Table 45.France Smart Space Market, By Space Type, 2020–2030 ($Billion)
Table 46.France Smart Space Market, By Application, 2020–2030 ($Billion)
Table 47.France Smart Space Market, By End User, 2020–2030 ($Billion)
Table 48.Italy Smart Space Market, By Component, 2020–2030 ($Billion)
Table 49.Italy Smart Space Market, By Space Type, 2020–2030 ($Billion)
Table 50.Italy Smart Space Market, By Application, 2020–2030 ($Billion)
Table 51.Italy Smart Space Market, By End User, 2020–2030 ($Billion)
Table 52.Spain Smart Space Market, By Component, 2020–2030 ($Billion)
Table 53.Spain Smart Space Market, By Space Type, 2020–2030 ($Billion)
Table 54.Spain Smart Space Market, By Application, 2020–2030 ($Billion)
Table 55.Spain Smart Space Market, By End User, 2020–2030 ($Billion)
Table 56.Rest Of Europe Smart Space Market, By Component, 2020–2030 ($Billion)
Table 57.Rest Of Europe Smart Space Market, By Space Type, 2020–2030 ($Billion)
Table 58.Rest Of Europe Smart Space Market, By Application, 2020–2030 ($Billion)
Table 59.Rest Of Europe Smart Space Market, By End User, 2020–2030 ($Billion)
Table 60.Asia-Pacific Smart Space Market, By Component, 2020–2030 ($Billion)
Table 61.Asia-Pacific Smart Space Market, By Space Type, 2020–2030 ($Billion)
Table 62.Asia-Pacific Smart Space Market, By Application, 2020–2030 ($Billion)
Table 63.Asia-Pacific Smart Space Market, By End User, 2020–2030 ($Billion)
Table 64.Asia-Pacific Smart Space Market, By Country, 2020-2030 ($Billion)
Table 65.China Smart Space Market, By Component, 2020–2030 ($Billion)
Table 66.China Smart Space Market, By Space Type, 2020–2030 ($Billion)
Table 67.China Smart Space Market, By Application, 2020–2030 ($Billion)
Table 68.China Smart Space Market, By End User, 2020–2030 ($Billion)
Table 69.Japan Smart Space Market, By Component, 2020–2030 ($Billion)
Table 70.Japan Smart Space Market, By Space Type, 2020–2030 ($Billion)
Table 71.Japan Smart Space Market, By Application, 2020–2030 ($Billion)
Table 72.Japan Smart Space Market, By End User, 2020–2030 ($Billion)
Table 73.India Smart Space Market, By Component, 2020–2030 ($Billion)
Table 74.India Smart Space Market, By Space Type, 2020–2030 ($Billion)
Table 75.India Smart Space Market, By Application, 2020–2030 ($Billion)
Table 76.India Smart Space Market, By End User, 2020–2030 ($Billion)
Table 77.South Korea Smart Space Market, By Component, 2020–2030 ($Billion)
Table 78.South Korea Smart Space Market, By Space Type, 2020–2030 ($Billion)
Table 79.South Korea Smart Space Market, By Application, 2020–2030 ($Billion)
Table 80.South Korea Smart Space Market, By End User, 2020–2030 ($Billion)
Table 81.Australia Smart Space Market, By Component, 2020–2030 ($Billion)
Table 82.Australia Smart Space Market, By Space Type, 2020–2030 ($Billion)
Table 83.Australia Smart Space Market, By Application, 2020–2030 ($Billion)
Table 84.Australia Smart Space Market, By End User, 2020–2030 ($Billion)
Table 85.Rest Of Asia-Pacific Smart Space Market, By Component, 2020–2030 ($Billion)
Table 86.Rest Of Asia-Pacific Smart Space Market, By Space Type, 2020–2030 ($Billion)
Table 87.Rest Of Asia-Pacific Smart Space Market, By Application, 2020–2030 ($Billion)
Table 88.Rest Of Asia-Pacific Smart Space Market, By End User, 2020–2030 ($Billion)
Table 89.Lamea Smart Space Market, By Component, 2020–2030 ($Billion)
Table 90.Lamea Smart Space Market, By Space Type, 2020–2030 ($Billion)
Table 91.Lamea Smart Space Market, By Application, 2020–2030 ($Billion)
Table 92.Lamea Smart Space Market, By End User, 2020–2030 ($Billion)
Table 93.Lamea Smart Space Market, By Country, 2020-2030 ($Billion)
Table 94.Latin America Smart Space Market, By Component, 2020–2030 ($Billion)
Table 95.Latin America Smart Space Market, By Space Type, 2020–2030 ($Billion)
Table 96.Latin America Smart Space Market, By Application, 2020–2030 ($Billion)
Table 97.Latin America Smart Space Market, By End User, 2020–2030 ($Billion)
Table 98.Middle East Smart Space Market, By Component, 2020–2030 ($Billion)
Table 99.Middle East Smart Space Market, By Space Type, 2020–2030 ($Billion)
Table 100.Middle East Smart Space Market, By Application, 2020–2030 ($Billion)
Table 101.Middle East Smart Space Market, By End User, 2020–2030 ($Billion)
Table 102.Africa Smart Space Market, By Component, 2020–2030 ($Billion)
Table 103.Africa Smart Space Market, By Space Type, 2020–2030 ($Billion)
Table 104.Africa Smart Space Market, By Application, 2020–2030 ($Billion)
Table 105.Africa Smart Space Market, By End User, 2020–2030 ($Billion)
Table 106.Cisco Systems, Inc.: Key Executives
Table 107.Cisco Systems, Inc.: Company Snapshot
Table 108.Cisco Systems, Inc.: Product Portfolio
Table 109.Coor: Key Executives
Table 110.Coor: Company Snapshot
Table 111.Coor: Product Portfolio
Table 112.Eutech Cybernetic Pte. Ltd.: Key Executives
Table 113.Eutech Cybernetic Pte. Ltd.: Company Snapshot
Table 114.Eutech Cybernetics Pte, Ltd.: Product Portfolio
Table 115.Hitachi Vantara Corporation: Key Executives
Table 116.Hitachi Vantara Corporation: Company Snapshot
Table 117.Hitachi Ltd.: Operating Segments
Table 118.Hitachi Vantara Corporation: Product Portfolio
Table 119.Huawei Technologies Co., Ltd.: Key Executives
Table 120.Huawei Technologies Co., Ltd.: Company Snapshot
Table 121.Huawei Technologies Co., Ltd.: Operating Segments
Table 122.Huawei Technologies Co., Ltd.: Product Portfolio
Table 123.International Business Machines Corporation: Key Executives
Table 124.International Business Machines Corporation: Company Snapshot
Table 125.International Business Machines Corporation: Operating Segments
Table 126.International Business Machines Corporation: Product Portfolio
Table 127.Schneider Electric Se: Key Executives
Table 128.Schneider Electric Se: Company Snapshot
Table 129.Schneider Electric Se: Operating Segments
Table 130.Schneider Electric Se: Product Portfolio
Table 131.Siemens Ag: Key Executives
Table 132.Siemens Ag: Company Snapshot
Table 133.Siemens Ag: Operating Segments
Table 134.Siemens Ag: Product Portfolio
Table 135.Smartspace Software Plc: Key Executives
Table 136.Smartspace Software Plc: Company Snapshot
Table 137.Smartspace Software Plc: Operating Segments
Table 138.Smartspace Software Plc: Product Portfolio
Table 139.Spacewell: Key Executives
Table 140.Spacewell: Company Snapshot
Table 141.Spacewell: Product Portfolio
List Of Figures
Figure 01.Key Market Segments
Figure 02.Smart Space Market Snapshot, By Segmentation
Figure 03.Smart Space Market Snapshot, By Region
Figure 04.Top Impacting Factors
Figure 05.Top Investment Pockets
Figure 06.Moderate-To-High Bargaining Power Of Suppliers
Figure 07.Moderate Bargaining Power Of Buyers
Figure 08.Moderate-To-High Threat Of Substitutes
Figure 09.Moderate Threat Of New Entrants
Figure 10.High Intensity Of Rivalry
Figure 11.Value Chain Analysis: Smart Space Market
Figure 12.Market Dynamics: Smart Space Market
Figure 13.Global Smart Space Market, By Component, 2020-2030
Figure 14.Comparative Share Analysis Of Smart Space Market For Hardware, By Country, 2020 & 2030(%)
Figure 15.Comparative Share Analysis Of Smart Space Market For Software, By Country, 2020 & 2030(%)
Figure 16.Comparative Share Analysis Of Smart Space Market For Services, By Country, 2020 & 2030(%)
Figure 17.Global Smart Space Market, By Space Type, 2020-2030
Figure 18.Comparative Share Analysis Of Smart Space Market For Smart Indoor Space, By Country, 2020 & 2030(%)
Figure 19.Comparative Share Analysis Of Smart Space Market For Smart Outdoor Space, By Country, 2020 & 2030(%)
Figure 20.Global Smart Space Market, By Application, 2020-2030
Figure 21.Comparative Share Analysis Of Smart Space Market For Energy Management And Optimization, By Country, 2020 & 2030(%)
Figure 22.Comparative Share Analysis Of Smart Space Market For Layout & Space Management, By Country, 2020 & 2030(%)
Figure 23.Comparative Share Analysis Of Smart Space Market For Emergency & Disaster Management, By Country, 2020 & 2030(%)
Figure 24.Comparative Share Analysis Of Smart Space Market For Security Management, By Country, 2020 & 2030(%)
Figure 25.Comparative Share Analysis Of Smart Space Market For Other, By Country, 2020 & 2030(%)
Figure 26.Global Smart Space Market, By End User, 2020-2030
Figure 27.Comparative Share Analysis Of Smart Space Market For Residential, By Country, 2020 & 2030(%)
Figure 28.Comparative Share Analysis Of Smart Space Market For Commercial, By Country, 2020 & 2030(%)
Figure 29.U.S. Smart Space Market, 2020–2030 ($Billion)
Figure 30.Canada Smart Space Market, 2020–2030 ($Billion)
Figure 31.Uk Smart Space Market, 2020–2030 ($Billion)
Figure 32.Germany Smart Space Market, 2020–2030 ($Billion)
Figure 33.France Smart Space Market, 2020–2030 ($Billion)
Figure 34.Italy Smart Space Market, 2020–2030 ($Billion)
Figure 35.Spain Smart Space Market, 2020–2030 ($Billion)
Figure 36.Rest Of Europe Smart Space Market, 2020–2030 ($Billion)
Figure 37.China Smart Space Market, 2020–2030 ($Billion)
Figure 38.Japan Smart Space Market, 2020–2030 ($Billion)
Figure 39.India Smart Space Market, 2020–2030 ($Billion)
Figure 40.South Korea Smart Space Market, 2020–2030 ($Billion)
Figure 41.Australia Smart Space Market, 2020–2030 ($Billion)
Figure 42.Rest Of Asia-Pacific Smart Space Market, 2020–2030 ($Billion)
Figure 43.Latin America Smart Space Market, 2020–2030 ($Billion)
Figure 44.Middle East Smart Space Market, 2020–2030 ($Billion)
Figure 45.Africa Smart Space Market, 2020–2030 ($Billion)
Figure 46.Market Player Positioning, 2020
Figure 47.Top Winning Strategies, By Year, 2017-2021
Figure 48.Top Winning Strategies, By Development, 2017-2021
Figure 49.Top Winning Strategies, By Company, 2017-2021
Figure 50.Competitive Dashboard
Figure 51.Competitive Dashboard
Figure 52.Competitive Heatmap Of Key Players
Figure 53.R&D Expenditure, 2018-2020 ($Million)
Figure 54.Cisco Systems, Inc.: Revenue, 2018-2020 ($Million)
Figure 55.Cisco Systems, Inc.: Revenue Share By Region, 2020 (%)
Figure 56.Coor: Revenue, 2018–2020 ($Million)
Figure 57.Coor: Revenue Share By Region, 2020 (%)
Figure 58.R&D Expenditure, 2018-2020 ($Million)
Figure 59.Hitachi Vantara Corporation: Revenue, 2018-2020 ($Million)
Figure 60.Hitachi Vantara Corporation: Revenue Share By Segment, 2020 (%)
Figure 61.R&D Expenditure, 2018–2020 ($Million)
Figure 62.Huawei Technologies Co., Ltd.: Revenue, 2018–2020 ($Million)
Figure 63.Huawei Technologies Co., Ltd.: Revenue Share By Segment, 2020 (%)
Figure 64.Huawei Technologies Co., Ltd.: Revenue Share By Region, 2020 (%)
Figure 65.R&D Expenditure, 2018–2020 ($Million)
Figure 66.International Business Machines Corporation: Revenue, 2018–2020 ($Million)
Figure 67.International Business Machines Corporation: Revenue Share By Segment, 2020 (%)
Figure 68.International Business Machines Corporation: Revenue Share By Region, 2020 (%)
Figure 69.R&D Expenditure, 2018–2020 ($Million)
Figure 70.Schneider Electric Se: Revenue, 2018–2020 ($Million)
Figure 71.Schneider Electric Se: Revenue Share By Segment, 2020 (%)
Figure 72.Schneider Electric Se: Revenue Share By Region, 2020 (%)
Figure 73.R&D Expenditure, 2018–2020 ($Million)
Figure 74.Siemens Ag: Revenue, 2018–2020 ($Million)
Figure 75.Siemens Ag: Revenue Share By Segment, 2020 (%)
Figure 76.Siemens Ag: Revenue Share By Region, 2020 (%)
Figure 77.R&D Expenditure, 2019–2021 ($Million)
Figure 78.Smartspace Software Plc: Revenue, 2019–2021 ($Million)
Figure 79.Smartspace Software Plc: Revenue Share By Segment, 2021 (%)
Figure 80.Smartspace Software Plc: Revenue Share By Region, 2021 (%)
$6169
$10665
HAVE A QUERY?
OUR CUSTOMER
SIMILAR REPORTS
Add to Cart
Add to Cart
Add to Cart
Add to Cart