
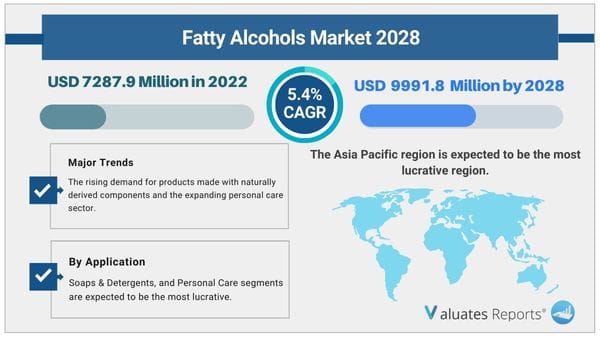
Due to the COVID-19 pandemic, the global Fatty Alcohols market size is estimated to be worth US$ 7287.9 million in 2022 and is forecast to be a readjusted size of US$ 9991.8 million by 2028 with a CAGR of 5.4% during the review period. The Fatty Alcohols market is being driven in part by the rising demand for products made with naturally derived components and the expanding personal care sector.
Detergents and soaps, personal care and cosmetics, plasticizers, tastes and scents, and metalworking fluids are the main applications of fatty alcohols. In the coming years, the fatty alcohols market is expected to be primarily driven by growth in the personal care products and detergents & soaps industries.
In the formulations of personal care and home care products, fatty alcohols are among the most often utilized components. Numerous items, including shampoo, conditioner, shower gel, antiperspirant, and lipstick, include them. Many plants and animals contain fatty alcohols, mainly in the form of esters. Thus, the increasing use in personal care is expected to drive the growth of the Fatty Alcohols market
Fatty alcohols made from oleo-based feedstock are preferable to alternatives based on petrochemicals since they are not only recyclable but also less harmful to human health. As a result, they are used to make cosmetics and other personal care products. The demand for fatty alcohols is anticipated to rise over the course of the next term as a result of this trend toward biodegradable and ecologically friendly cosmetic goods. This factor is expected to further drive the fatty alcohol market growth.
It is widely known that a key element that has the potential to significantly increase the market in the near future is the growing need for surfactants in personal care products like conditioners, lipsticks, shower gel, and antiperspirants. Over the course of the research year, it is projected that the cost-effectiveness and intrinsic biodegradability of these products will fuel expansion in the natural fatty alcohol market.
Based on application, Soaps & Detergents, and Personal Care segments are expected to be the most lucrative. This is due to the increase in consumer awareness as well as an increase in the demand for hygiene goods on a global scale. It is projected that a shift in consumer preference toward the demand for bio-ingredient-based goods will drive the market for personal care products. The growing understanding of the possible toxicity produced by petrochemical products is the source of this preference change.
Based on region, Asia Pacific is expected to be the most lucrative region. This is due to an increase in per capita income in developing nations like China, India, and other Asian nations. People are searching for high-quality, user-friendly items as a result of the change in their lifestyles.
The authors of this study have enlightened the readers on the rise and effect of the Covid-19 outbreak on the development. They have investigated the changes brought about in the demand/supply side, consumption, supply chain, and production/manufacturing. The readers will get familiar with the measures that have helped the key players to bring the Fatty Alcohols market back to the pre-covid levels.
In this segment of the report, the specialists have delved into the key growth opportunities that are likely to emerge. This will aid the key players to simplify complex issues related to business and framing future strategies to compete in this competitive environment. This section will certainly assist the players in boldly positioning their business.
In this section of the report, the researchers have done a comprehensive analysis of the prominent players operating and the strategies they are focusing on to combat the intense competition. Company profiles and share analysis of the prominent players are also provided in this section. They have also provided reliable sales and revenue data of the manufacturers for the period 2017-2022. With the assistance of this report, key players, stakeholders, and other participants will be able to stay abreast of the recent and upcoming developments in the business, further enabling them to make efficient choices.
| Report Metric | Details |
| Report Name | Fatty Alcohols Market |
| The market size in 2022 | USD 7287.9 Million |
| The revenue forecast in 2028 | USD 9991.8 Million |
| Growth Rate | Compound Annual Growth Rate (CAGR) of 5.4% from 2022 to 2028 |
| Market size available for years | 2022-2028 |
| Forecast units | Value (USD) |
| Segments covered | By Type, Application & Regions |
| Report coverage | Revenue & volume forecast, company share, competitive landscape, growth factors, and trends |
| Geographic regions covered | North America, Europe, Asia Pacific, Latin America, Middle East & Africa |
Ans. The global Fatty Alcohols market size is estimated to be worth US$ 7287.9 million in 2022 and is forecast to a readjusted size of US$ 9991.8 million by 2028.
Ans. The global Fatty Alcohols market is expected to grow at a compound annual growth rate of 5.4% from 2022 to 2028.
Ans. Some of the major companies are Sasol, Wilmar International, Musim Mas, KLK OLEO, VVF, Godrej Industries, Emery Oleochemicals, Procter & Gamble, Royal Dutch Shell, Oxiteno, Timur Oleochemicals, Teck Guan, Berg + Schmidt, Oleon, Global Green Chemicals Public, Jarchem, Cremer Oleo, Kh Neochem, Sabic, Arkema, New Japan Chemical, Zhejiang Jiahua Energy Chemical, BASF.
List of Tables
Table 1. Global Fatty Alcohols Market Size Growth Rate by Type, 2017 VS 2021 VS 2028 (US$ Million)
Table 2. Major Manufacturers of C6-C10 Fatty Alcohols
Table 3. Major Manufacturers of C11-C14 Fatty Alcohols
Table 4. Major Manufacturers of C15-C22 Fatty Alcohols
Table 5. Major Manufacturers of C23 Fatty Alcohols
Table 6. Global Fatty Alcohols Market Size Growth Rate by Application, 2017 VS 2021 2028 (US$ Million)
Table 7. Global Fatty Alcohols Production by Region: 2017 VS 2021 VS 2028 (MT)
Table 8. Global Fatty Alcohols Production by Region (2017-2022) & (MT)
Table 9. Global Fatty Alcohols Production Market Share by Region (2017-2022)
Table 10. Global Fatty Alcohols Production by Region (2023-2028) & (MT)
Table 11. Global Fatty Alcohols Production Market Share by Region (2023-2028)
Table 12. Global Fatty Alcohols Revenue by Region: 2017 VS 2021 VS 2028 (US$ Million)
Table 13. Global Fatty Alcohols Sales by Region (2017-2022) & (MT)
Table 14. Global Fatty Alcohols Sales Market Share by Region (2017-2022)
Table 15. Global Fatty Alcohols Sales by Region (2023-2028) & (MT)
Table 16. Global Fatty Alcohols Sales Market Share by Region (2023-2028)
Table 17. Global Fatty Alcohols Revenue by Region (2017-2022) & (US$ Million)
Table 18. Global Fatty Alcohols Revenue Market Share by Region (2017-2022)
Table 19. Global Fatty Alcohols Revenue by Region (2023-2028) & (US$ Million)
Table 20. Global Fatty Alcohols Revenue Market Share by Region (2023-2028)
Table 21. Global Fatty Alcohols Production Capacity by Manufacturers (2017-2022) & (MT)
Table 22. Global Fatty Alcohols Capacity Market Share by Manufacturers (2017-2022)
Table 23. Global Fatty Alcohols Sales by Manufacturers (2017-2022) & (MT)
Table 24. Global Fatty Alcohols Sales Market Share by Manufacturers (2017-2022)
Table 25. Global Fatty Alcohols Revenue by Manufacturers (2017-2022) & (US$ Million)
Table 26. Global Fatty Alcohols Revenue Share by Manufacturers (2017-2022)
Table 27. Fatty Alcohols Price by Manufacturers 2017-2022 (USD/MT)
Table 28. Global Fatty Alcohols Manufacturers Market Concentration Ratio (CR5 and HHI)
Table 29. Global Fatty Alcohols by Company Type (Tier 1, Tier 2, and Tier 3) & (based on the Revenue in Fatty Alcohols as of 2021)
Table 30. Fatty Alcohols Manufacturing Base Distribution and Headquarters
Table 31. Manufacturers Fatty Alcohols Product Offered
Table 32. Date of Manufacturers Enter into Fatty Alcohols Market
Table 33. Mergers & Acquisitions, Expansion Plans
Table 34. Global Fatty Alcohols Sales by Type (2017-2022) & (MT)
Table 35. Global Fatty Alcohols Sales by Type (2023-2028) & (MT)
Table 36. Global Fatty Alcohols Sales Share by Type (2017-2022)
Table 37. Global Fatty Alcohols Sales Share by Type (2023-2028)
Table 38. Global Fatty Alcohols Revenue by Type (2017-2022) & (US$ Million)
Table 39. Global Fatty Alcohols Revenue by Type (2023-2028) & (US$ Million)
Table 40. Global Fatty Alcohols Revenue Share by Type (2017-2022)
Table 41. Global Fatty Alcohols Revenue Share by Type (2023-2028)
Table 42. Fatty Alcohols Price by Type (2017-2022) & (USD/MT)
Table 43. Global Fatty Alcohols Price Forecast by Type (2023-2028) & (USD/MT)
Table 44. Global Fatty Alcohols Sales by Application (2017-2022) & (MT)
Table 45. Global Fatty Alcohols Sales by Application (2023-2028) & (MT)
Table 46. Global Fatty Alcohols Sales Share by Application (2017-2022)
Table 47. Global Fatty Alcohols Sales Share by Application (2023-2028)
Table 48. Global Fatty Alcohols Revenue by Application (2017-2022) & (US$ Million)
Table 49. Global Fatty Alcohols Revenue by Application (2023-2028) & (US$ Million)
Table 50. Global Fatty Alcohols Revenue Share by Application (2017-2022)
Table 51. Global Fatty Alcohols Revenue Share by Application (2023-2028)
Table 52. Fatty Alcohols Price by Application (2017-2022) & (USD/MT)
Table 53. Global Fatty Alcohols Price Forecast by Application (2023-2028) & (USD/MT)
Table 54. North America Fatty Alcohols Sales by Type (2017-2022) & (MT)
Table 55. North America Fatty Alcohols Sales by Type (2023-2028) & (MT)
Table 56. North America Fatty Alcohols Revenue by Type (2017-2022) & (US$ Million)
Table 57. North America Fatty Alcohols Revenue by Type (2023-2028) & (US$ Million)
Table 58. North America Fatty Alcohols Sales by Application (2017-2022) & (MT)
Table 59. North America Fatty Alcohols Sales by Application (2023-2028) & (MT)
Table 60. North America Fatty Alcohols Revenue by Application (2017-2022) & (US$ Million)
Table 61. North America Fatty Alcohols Revenue by Application (2023-2028) & (US$ Million)
Table 62. North America Fatty Alcohols Sales by Country (2017-2022) & (MT)
Table 63. North America Fatty Alcohols Sales by Country (2023-2028) & (MT)
Table 64. North America Fatty Alcohols Revenue by Country (2017-2022) & (US$ Million)
Table 65. North America Fatty Alcohols Revenue by Country (2023-2028) & (US$ Million)
Table 66. Europe Fatty Alcohols Sales by Type (2017-2022) & (MT)
Table 67. Europe Fatty Alcohols Sales by Type (2023-2028) & (MT)
Table 68. Europe Fatty Alcohols Revenue by Type (2017-2022) & (US$ Million)
Table 69. Europe Fatty Alcohols Revenue by Type (2023-2028) & (US$ Million)
Table 70. Europe Fatty Alcohols Sales by Application (2017-2022) & (MT)
Table 71. Europe Fatty Alcohols Sales by Application (2023-2028) & (MT)
Table 72. Europe Fatty Alcohols Revenue by Application (2017-2022) & (US$ Million)
Table 73. Europe Fatty Alcohols Revenue by Application (2023-2028) & (US$ Million)
Table 74. Europe Fatty Alcohols Sales by Country (2017-2022) & (MT)
Table 75. Europe Fatty Alcohols Sales by Country (2023-2028) & (MT)
Table 76. Europe Fatty Alcohols Revenue by Country (2017-2022) & (US$ Million)
Table 77. Europe Fatty Alcohols Revenue by Country (2023-2028) & (US$ Million)
Table 78. Asia Pacific Fatty Alcohols Sales by Type (2017-2022) & (MT)
Table 79. Asia Pacific Fatty Alcohols Sales by Type (2023-2028) & (MT)
Table 80. Asia Pacific Fatty Alcohols Revenue by Type (2017-2022) & (US$ Million)
Table 81. Asia Pacific Fatty Alcohols Revenue by Type (2023-2028) & (US$ Million)
Table 82. Asia Pacific Fatty Alcohols Sales by Application (2017-2022) & (MT)
Table 83. Asia Pacific Fatty Alcohols Sales by Application (2023-2028) & (MT)
Table 84. Asia Pacific Fatty Alcohols Revenue by Application (2017-2022) & (US$ Million)
Table 85. Asia Pacific Fatty Alcohols Revenue by Application (2023-2028) & (US$ Million)
Table 86. Asia Pacific Fatty Alcohols Sales by Region (2017-2022) & (MT)
Table 87. Asia Pacific Fatty Alcohols Sales by Region (2023-2028) & (MT)
Table 88. Asia Pacific Fatty Alcohols Revenue by Region (2017-2022) & (US$ Million)
Table 89. Asia Pacific Fatty Alcohols Revenue by Region (2023-2028) & (US$ Million)
Table 90. Latin America Fatty Alcohols Sales by Type (2017-2022) & (MT)
Table 91. Latin America Fatty Alcohols Sales by Type (2023-2028) & (MT)
Table 92. Latin America Fatty Alcohols Revenue by Type (2017-2022) & (US$ Million)
Table 93. Latin America Fatty Alcohols Revenue by Type (2023-2028) & (US$ Million)
Table 94. Latin America Fatty Alcohols Sales by Application (2017-2022) & (MT)
Table 95. Latin America Fatty Alcohols Sales by Application (2023-2028) & (MT)
Table 96. Latin America Fatty Alcohols Revenue by Application (2017-2022) & (US$ Million)
Table 97. Latin America Fatty Alcohols Revenue by Application (2023-2028) & (US$ Million)
Table 98. Latin America Fatty Alcohols Sales by Country (2017-2022) & (MT)
Table 99. Latin America Fatty Alcohols Sales by Country (2023-2028) & (MT)
Table 100. Latin America Fatty Alcohols Revenue by Country (2017-2022) & (US$ Million)
Table 101. Latin America Fatty Alcohols Revenue by Country (2023-2028) & (US$ Million)
Table 102. Middle East and Africa Fatty Alcohols Sales by Type (2017-2022) & (MT)
Table 103. Middle East and Africa Fatty Alcohols Sales by Type (2023-2028) & (MT)
Table 104. Middle East and Africa Fatty Alcohols Revenue by Type (2017-2022) & (US$ Million)
Table 105. Middle East and Africa Fatty Alcohols Revenue by Type (2023-2028) & (US$ Million)
Table 106. Middle East and Africa Fatty Alcohols Sales by Application (2017-2022) & (MT)
Table 107. Middle East and Africa Fatty Alcohols Sales by Application (2023-2028) & (MT)
Table 108. Middle East and Africa Fatty Alcohols Revenue by Application (2017-2022) & (US$ Million)
Table 109. Middle East and Africa Fatty Alcohols Revenue by Application (2023-2028) & (US$ Million)
Table 110. Middle East and Africa Fatty Alcohols Sales by Country (2017-2022) & (MT)
Table 111. Middle East and Africa Fatty Alcohols Sales by Country (2023-2028) & (MT)
Table 112. Middle East and Africa Fatty Alcohols Revenue by Country (2017-2022) & (US$ Million)
Table 113. Middle East and Africa Fatty Alcohols Revenue by Country (2023-2028) & (US$ Million)
Table 114. Sasol Corporation Information
Table 115. Sasol Description and Major Businesses
Table 116. Sasol Fatty Alcohols Sales (MT), Revenue (US$ Million), Price (USD/MT) and Gross Margin (2017-2022)
Table 117. Sasol Fatty Alcohols Product Model Numbers, Pictures, Descriptions and Specifications
Table 118. Sasol Recent Development
Table 119. Wilmar International Corporation Information
Table 120. Wilmar International Description and Major Businesses
Table 121. Wilmar International Fatty Alcohols Sales (MT), Revenue (US$ Million), Price (USD/MT) and Gross Margin (2017-2022)
Table 122. Wilmar International Fatty Alcohols Product Model Numbers, Pictures, Descriptions and Specifications
Table 123. Wilmar International Recent Development
Table 124. Musim Mas Corporation Information
Table 125. Musim Mas Description and Major Businesses
Table 126. Musim Mas Fatty Alcohols Sales (MT), Revenue (US$ Million), Price (USD/MT) and Gross Margin (2017-2022)
Table 127. Musim Mas Fatty Alcohols Product Model Numbers, Pictures, Descriptions and Specifications
Table 128. Musim Mas Recent Development
Table 129. KLK OLEO Corporation Information
Table 130. KLK OLEO Description and Major Businesses
Table 131. KLK OLEO Fatty Alcohols Sales (MT), Revenue (US$ Million), Price (USD/MT) and Gross Margin (2017-2022)
Table 132. KLK OLEO Fatty Alcohols Product Model Numbers, Pictures, Descriptions and Specifications
Table 133. KLK OLEO Recent Development
Table 134. VVF Corporation Information
Table 135. VVF Description and Major Businesses
Table 136. VVF Fatty Alcohols Sales (MT), Revenue (US$ Million), Price (USD/MT) and Gross Margin (2017-2022)
Table 137. VVF Fatty Alcohols Product Model Numbers, Pictures, Descriptions and Specifications
Table 138. VVF Recent Development
Table 139. Godrej Industries Corporation Information
Table 140. Godrej Industries Description and Major Businesses
Table 141. Godrej Industries Fatty Alcohols Sales (MT), Revenue (US$ Million), Price (USD/MT) and Gross Margin (2017-2022)
Table 142. Godrej Industries Fatty Alcohols Product Model Numbers, Pictures, Descriptions and Specifications
Table 143. Godrej Industries Recent Development
Table 144. Emery Oleochemicals Corporation Information
Table 145. Emery Oleochemicals Description and Major Businesses
Table 146. Emery Oleochemicals Fatty Alcohols Sales (MT), Revenue (US$ Million), Price (USD/MT) and Gross Margin (2017-2022)
Table 147. Emery Oleochemicals Fatty Alcohols Product Model Numbers, Pictures, Descriptions and Specifications
Table 148. Emery Oleochemicals Recent Development
Table 149. Procter & Gamble Corporation Information
Table 150. Procter & Gamble Description and Major Businesses
Table 151. Procter & Gamble Fatty Alcohols Sales (MT), Revenue (US$ Million), Price (USD/MT) and Gross Margin (2017-2022)
Table 152. Procter & Gamble Fatty Alcohols Product Model Numbers, Pictures, Descriptions and Specifications
Table 153. Procter & Gamble Recent Development
Table 154. Royal Dutch Shell Corporation Information
Table 155. Royal Dutch Shell Description and Major Businesses
Table 156. Royal Dutch Shell Fatty Alcohols Sales (MT), Revenue (US$ Million), Price (USD/MT) and Gross Margin (2017-2022)
Table 157. Royal Dutch Shell Fatty Alcohols Product Model Numbers, Pictures, Descriptions and Specifications
Table 158. Royal Dutch Shell Recent Development
Table 159. Oxiteno Corporation Information
Table 160. Oxiteno Description and Major Businesses
Table 161. Oxiteno Fatty Alcohols Sales (MT), Revenue (US$ Million), Price (USD/MT) and Gross Margin (2017-2022)
Table 162. Oxiteno Fatty Alcohols Product Model Numbers, Pictures, Descriptions and Specifications
Table 163. Oxiteno Recent Development
Table 164. Timur Oleochemicals Corporation Information
Table 165. Timur Oleochemicals Description and Major Businesses
Table 166. Timur Oleochemicals Fatty Alcohols Sales (MT), Revenue (US$ Million), Price (USD/MT) and Gross Margin (2017-2022)
Table 167. Timur Oleochemicals Fatty Alcohols Product Model Numbers, Pictures, Descriptions and Specifications
Table 168. Timur Oleochemicals Recent Development
Table 169. Teck Guan Corporation Information
Table 170. Teck Guan Description and Major Businesses
Table 171. Teck Guan Fatty Alcohols Sales (MT), Revenue (US$ Million), Price (USD/MT) and Gross Margin (2017-2022)
Table 172. Teck Guan Fatty Alcohols Product Model Numbers, Pictures, Descriptions and Specifications
Table 173. Teck Guan Recent Development
Table 174. Berg + Schmidt Corporation Information
Table 175. Berg + Schmidt Description and Major Businesses
Table 176. Berg + Schmidt Fatty Alcohols Sales (MT), Revenue (US$ Million), Price (USD/MT) and Gross Margin (2017-2022)
Table 177. Berg + Schmidt Fatty Alcohols Product Model Numbers, Pictures, Descriptions and Specifications
Table 178. Berg + Schmidt Recent Development
Table 179. Oleon Corporation Information
Table 180. Oleon Description and Major Businesses
Table 181. Oleon Fatty Alcohols Sales (MT), Revenue (US$ Million), Price (USD/MT) and Gross Margin (2017-2022)
Table 182. Oleon Fatty Alcohols Product Model Numbers, Pictures, Descriptions and Specifications
Table 183. Oleon Recent Development
Table 184. Global Green Chemicals Public Corporation Information
Table 185. Global Green Chemicals Public Description and Major Businesses
Table 186. Global Green Chemicals Public Fatty Alcohols Sales (MT), Revenue (US$ Million), Price (USD/MT) and Gross Margin (2017-2022)
Table 187. Global Green Chemicals Public Fatty Alcohols Product Model Numbers, Pictures, Descriptions and Specifications
Table 188. Global Green Chemicals Public Recent Development
Table 189. Jarchem Corporation Information
Table 190. Jarchem Description and Major Businesses
Table 191. Jarchem Fatty Alcohols Sales (MT), Revenue (US$ Million), Price (USD/MT) and Gross Margin (2017-2022)
Table 192. Jarchem Fatty Alcohols Product Model Numbers, Pictures, Descriptions and Specifications
Table 193. Jarchem Recent Development
Table 194. Cremer Oleo Corporation Information
Table 195. Cremer Oleo Description and Major Businesses
Table 196. Cremer Oleo Fatty Alcohols Sales (MT), Revenue (US$ Million), Price (USD/MT) and Gross Margin (2017-2022)
Table 197. Cremer Oleo Fatty Alcohols Product Model Numbers, Pictures, Descriptions and Specifications
Table 198. Cremer Oleo Recent Development
Table 199. Kh Neochem Corporation Information
Table 200. Kh Neochem Description and Major Businesses
Table 201. Kh Neochem Fatty Alcohols Sales (MT), Revenue (US$ Million), Price (USD/MT) and Gross Margin (2017-2022)
Table 202. Kh Neochem Fatty Alcohols Product Model Numbers, Pictures, Descriptions and Specifications
Table 203. Kh Neochem Recent Development
Table 204. Sabic Corporation Information
Table 205. Sabic Description and Major Businesses
Table 206. Sabic Fatty Alcohols Sales (MT), Revenue (US$ Million), Price (USD/MT) and Gross Margin (2017-2022)
Table 207. Sabic Fatty Alcohols Product Model Numbers, Pictures, Descriptions and Specifications
Table 208. Sabic Recent Development
Table 209. Arkema Corporation Information
Table 210. Arkema Description and Major Businesses
Table 211. Arkema Fatty Alcohols Sales (MT), Revenue (US$ Million), Price (USD/MT) and Gross Margin (2017-2022)
Table 212. Arkema Fatty Alcohols Product Model Numbers, Pictures, Descriptions and Specifications
Table 213. Arkema Recent Development
Table 214. New Japan Chemical Corporation Information
Table 215. New Japan Chemical Description and Major Businesses
Table 216. New Japan Chemical Fatty Alcohols Sales (MT), Revenue (US$ Million), Price (USD/MT) and Gross Margin (2017-2022)
Table 217. New Japan Chemical Fatty Alcohols Product Model Numbers, Pictures, Descriptions and Specifications
Table 218. New Japan Chemical Recent Development
Table 219. Zhejiang Jiahua Energy Chemical Corporation Information
Table 220. Zhejiang Jiahua Energy Chemical Description and Major Businesses
Table 221. Zhejiang Jiahua Energy Chemical Fatty Alcohols Sales (MT), Revenue (US$ Million), Price (USD/MT) and Gross Margin (2017-2022)
Table 222. Zhejiang Jiahua Energy Chemical Fatty Alcohols Product Model Numbers, Pictures, Descriptions and Specifications
Table 223. Zhejiang Jiahua Energy Chemical Recent Development
Table 224. BASF Corporation Information
Table 225. BASF Description and Major Businesses
Table 226. BASF Fatty Alcohols Sales (MT), Revenue (US$ Million), Price (USD/MT) and Gross Margin (2017-2022)
Table 227. BASF Fatty Alcohols Product Model Numbers, Pictures, Descriptions and Specifications
Table 228. BASF Recent Development
Table 229. Key Raw Materials Lists
Table 230. Raw Materials Key Suppliers Lists
Table 231. Fatty Alcohols Distributors List
Table 232. Fatty Alcohols Customers List
Table 233. Fatty Alcohols Market Trends
Table 234. Fatty Alcohols Market Drivers
Table 235. Fatty Alcohols Market Challenges
Table 236. Fatty Alcohols Market Restraints
Table 237. Research Programs/Design for This Report
Table 238. Key Data Information from Secondary Sources
Table 239. Key Data Information from Primary Sources
List of Figures
Figure 1. Fatty Alcohols Product Picture
Figure 2. Global Fatty Alcohols Market Share by Type in 2021 & 2028
Figure 3. C6-C10 Fatty Alcohols Product Picture
Figure 4. C11-C14 Fatty Alcohols Product Picture
Figure 5. C15-C22 Fatty Alcohols Product Picture
Figure 6. C23 Fatty Alcohols Product Picture
Figure 7. Global Fatty Alcohols Market Share by Application in 2021 & 2028
Figure 8. Soaps & Detergents
Figure 9. Personal Care
Figure 10. Lubricants
Figure 11. Amines
Figure 12. Others
Figure 13. Fatty Alcohols Report Years Considered
Figure 14. Global Fatty Alcohols Capacity, Production and Utilization (2017-2028) & (MT)
Figure 15. Global Fatty Alcohols Production Market Share by Region in Percentage: 2021 Versus 2028
Figure 16. Global Fatty Alcohols Production Market Share by Region (2017-2022)
Figure 17. Global Fatty Alcohols Production Market Share by Region (2023-2028)
Figure 18. Fatty Alcohols Production Growth Rate in North America (2017-2028) & (MT)
Figure 19. Fatty Alcohols Production Growth Rate in Europe (2017-2028) & (MT)
Figure 20. Fatty Alcohols Production Growth Rate in China (2017-2028) & (MT)
Figure 21. Fatty Alcohols Production Growth Rate in Japan (2017-2028) & (MT)
Figure 22. Global Fatty Alcohols Sales 2017-2028 (MT)
Figure 23. Global Fatty Alcohols Revenue, (US$ Million), 2017 VS 2021 VS 2028
Figure 24. Global Fatty Alcohols Revenue 2017-2028 (US$ Million)
Figure 25. Global Fatty Alcohols Revenue Market Share by Region in Percentage: 2021 Versus 2028
Figure 26. Global Fatty Alcohols Sales Market Share by Region (2017-2022)
Figure 27. Global Fatty Alcohols Sales Market Share by Region (2023-2028)
Figure 28. North America Fatty Alcohols Sales YoY (2017-2028) & (MT)
Figure 29. North America Fatty Alcohols Revenue YoY (2017-2028) & (US$ Million)
Figure 30. Europe Fatty Alcohols Sales YoY (2017-2028) & (MT)
Figure 31. Europe Fatty Alcohols Revenue YoY (2017-2028) & (US$ Million)
Figure 32. Asia-Pacific Fatty Alcohols Sales YoY (2017-2028) & (MT)
Figure 33. Asia-Pacific Fatty Alcohols Revenue YoY (2017-2028) & (US$ Million)
Figure 34. Latin America Fatty Alcohols Sales YoY (2017-2028) & (MT)
Figure 35. Latin America Fatty Alcohols Revenue YoY (2017-2028) & (US$ Million)
Figure 36. Middle East & Africa Fatty Alcohols Sales YoY (2017-2028) & (MT)
Figure 37. Middle East & Africa Fatty Alcohols Revenue YoY (2017-2028) & (US$ Million)
Figure 38. The Fatty Alcohols Market Share of Top 10 and Top 5 Largest Manufacturers Around the World in 2021
Figure 39. The Top 5 and 10 Largest Manufacturers of Fatty Alcohols in the World: Market Share by Fatty Alcohols Revenue in 2021
Figure 40. Fatty Alcohols Market Share by Company Type (Tier 1, Tier 2, and Tier 3): 2017 VS 2021
Figure 41. Global Fatty Alcohols Sales Market Share by Type (2017-2028)
Figure 42. Global Fatty Alcohols Revenue Market Share by Type (2017-2028)
Figure 43. Global Fatty Alcohols Sales Market Share by Application (2017-2028)
Figure 44. Global Fatty Alcohols Revenue Market Share by Application (2017-2028)
Figure 45. North America Fatty Alcohols Sales Market Share by Type (2017-2028)
Figure 46. North America Fatty Alcohols Revenue Market Share by Type (2017-2028)
Figure 47. North America Fatty Alcohols Sales Market Share by Application (2017-2028)
Figure 48. North America Fatty Alcohols Revenue Market Share by Application (2017-2028)
Figure 49. North America Fatty Alcohols Sales Share by Country (2017-2028)
Figure 50. North America Fatty Alcohols Revenue Share by Country (2017-2028)
Figure 51. U.S. Fatty Alcohols Revenue (2017-2028) & (US$ Million)
Figure 52. Canada Fatty Alcohols Revenue (2017-2028) & (US$ Million)
Figure 53. Europe Fatty Alcohols Sales Market Share by Type (2017-2028)
Figure 54. Europe Fatty Alcohols Revenue Market Share by Type (2017-2028)
Figure 55. Europe Fatty Alcohols Sales Market Share by Application (2017-2028)
Figure 56. Europe Fatty Alcohols Revenue Market Share by Application (2017-2028)
Figure 57. Europe Fatty Alcohols Sales Share by Country (2017-2028)
Figure 58. Europe Fatty Alcohols Revenue Share by Country (2017-2028)
Figure 59. Germany Fatty Alcohols Revenue (2017-2028) & (US$ Million)
Figure 60. France Fatty Alcohols Revenue (2017-2028) & (US$ Million)
Figure 61. U.K. Fatty Alcohols Revenue (2017-2028) & (US$ Million)
Figure 62. Italy Fatty Alcohols Revenue (2017-2028) & (US$ Million)
Figure 63. Russia Fatty Alcohols Revenue (2017-2028) & (US$ Million)
Figure 64. Asia Pacific Fatty Alcohols Sales Market Share by Type (2017-2028)
Figure 65. Asia Pacific Fatty Alcohols Revenue Market Share by Type (2017-2028)
Figure 66. Asia Pacific Fatty Alcohols Sales Market Share by Application (2017-2028)
Figure 67. Asia Pacific Fatty Alcohols Revenue Market Share by Application (2017-2028)
Figure 68. Asia Pacific Fatty Alcohols Sales Share by Region (2017-2028)
Figure 69. Asia Pacific Fatty Alcohols Revenue Share by Region (2017-2028)
Figure 70. China Fatty Alcohols Revenue (2017-2028) & (US$ Million)
Figure 71. Japan Fatty Alcohols Revenue (2017-2028) & (US$ Million)
Figure 72. South Korea Fatty Alcohols Revenue (2017-2028) & (US$ Million)
Figure 73. India Fatty Alcohols Revenue (2017-2028) & (US$ Million)
Figure 74. Australia Fatty Alcohols Revenue (2017-2028) & (US$ Million)
Figure 75. Taiwan Fatty Alcohols Revenue (2017-2028) & (US$ Million)
Figure 76. Indonesia Fatty Alcohols Revenue (2017-2028) & (US$ Million)
Figure 77. Thailand Fatty Alcohols Revenue (2017-2028) & (US$ Million)
Figure 78. Malaysia Fatty Alcohols Revenue (2017-2028) & (US$ Million)
Figure 79. Philippines Fatty Alcohols Revenue (2017-2028) & (US$ Million)
Figure 80. Latin America Fatty Alcohols Sales Market Share by Type (2017-2028)
Figure 81. Latin America Fatty Alcohols Revenue Market Share by Type (2017-2028)
Figure 82. Latin America Fatty Alcohols Sales Market Share by Application (2017-2028)
Figure 83. Latin America Fatty Alcohols Revenue Market Share by Application (2017-2028)
Figure 84. Latin America Fatty Alcohols Sales Share by Country (2017-2028)
Figure 85. Latin America Fatty Alcohols Revenue Share by Country (2017-2028)
Figure 86. Mexico Fatty Alcohols Revenue (2017-2028) & (US$ Million)
Figure 87. Brazil Fatty Alcohols Revenue (2017-2028) & (US$ Million)
Figure 88. Argentina Fatty Alcohols Revenue (2017-2028) & (US$ Million)
Figure 89. Middle East and Africa Fatty Alcohols Sales Market Share by Type (2017-2028)
Figure 90. Middle East and Africa Fatty Alcohols Revenue Market Share by Type (2017-2028)
Figure 91. Middle East and Africa Fatty Alcohols Sales Market Share by Application (2017-2028)
Figure 92. Middle East and Africa Fatty Alcohols Revenue Market Share by Application (2017-2028)
Figure 93. Middle East and Africa Fatty Alcohols Sales Share by Country (2017-2028)
Figure 94. Middle East and Africa Fatty Alcohols Revenue Share by Country (2017-2028)
Figure 95. Turkey Fatty Alcohols Revenue (2017-2028) & (US$ Million)
Figure 96. Saudi Arabia Fatty Alcohols Revenue (2017-2028) & (US$ Million)
Figure 97. U.A.E Fatty Alcohols Revenue (2017-2028) & (US$ Million)
Figure 98. Fatty Alcohols Value Chain
Figure 99. Fatty Alcohols Production Process
Figure 100. Channels of Distribution
Figure 101. Distributors Profiles
Figure 102. Bottom-up and Top-down Approaches for This Report
Figure 103. Data Triangulation
Figure 104. Key Executives Interviewed
$4900
$9800
HAVE A QUERY?
OUR CUSTOMER

SIMILAR REPORTS