
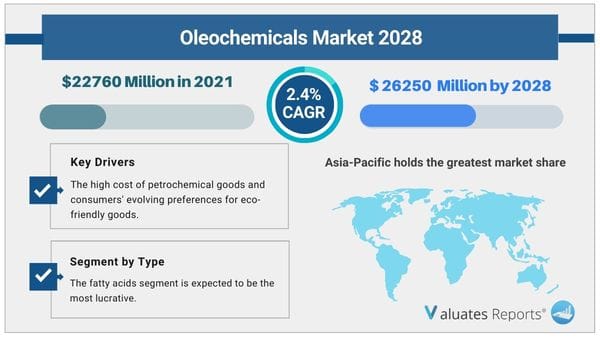
Due to the COVID-19 pandemic and Russia-Ukraine War Influence, the global Oleochemicals Market estimated at US$ 22760 million in the year 2022, is projected to reach a revised size of US$ 26250 million by 2028, growing at a CAGR of 2.4% during the forecast period 2022-2028.
The demand for renewable, sustainable, and bio-based chemicals is expected to increase throughout the forecast period in the personal care & cosmetics, food & beverage, pharmaceutical, and other industries. The high price of petrochemical products and consumers' shifting preferences for environmentally friendly products will both contribute to the Oleochemicals Market expansion.
The Oleochemicals Market is anticipated to expand as a result of the growing use of oleo chemicals in personal care and cosmetics. Oleochemicals are important ingredients in personal care products for maintaining healthy skin and hair. Due to their potential to be free of allergies and carcinogens, they have increased in popularity. The cosmetics industry uses oleochemicals to create goods that are secure for their clients. While octyl stearate, a palm derivative, is utilized as an emollient in lipstick and eyeshadow, polyhexanide is a water-based preservative and antibacterial component found in many cosmetics.
Oleochemicals are used to create sanitizers for surfaces that come into touch with food as well as FDA-approved food packaging. Calcium stearate is a food emulsifier and flow agent that is used in the production of sweets. In the food and beverage business, triple-pressed stearic acid is used as a hardening additive as well as a mold-release agent for creating candy. Consequently, it is anticipated that the growing use of oleochemicals in the food and beverage industry will propel the expansion of the oleochemicals market.
The market for oleochemicals is anticipated to develop as a result of the increasing use of these substances in pharmaceuticals. In the pharmaceutical and nutraceutical industries, oleochemicals can be used as emollients, thickeners, and preservatives. Isopropyl myristate is used in topical medicinal treatments as a moisturizer in addition to serving as an emollient or thickening agent in other pharmaceutical uses. Glycerine 99.7% is a humectant that is used in the creation of mouthwash and cough medicine.
Tightening environmental regulations and the depletion of nonrenewable resources allow oleochemicals to enter the market and replace the currently used petroleum-based products. Manufacturers are also converting from chemical-based products to bio-based eco-friendly ones in order to meet the demand for biobased products. This should help the environment, save money, and save time.
The fatty acids segment is anticipated to be the most profitable by kind. Due to increased demand for bio-based fatty acids from end-use sectors such as pharmaceuticals, personal care, cosmetics, food & beverages, chemicals, and others, the segment is anticipated to expand. Meanwhile, the pharmaceutical and cosmetics industries are the ones driving the increase in demand for fatty alcohol.
According to the region, the Oleochemicals Market is anticipated to be led by the Asia-Pacific region. Recent improvements and modernization made to Asian oleochemical production facilities, which offer exceptional raw material integration and give companies a competitive edge over rivals from abroad. The region's market growth is further aided by a solid base of raw materials, a shift in consumer preferences toward sustainable products, and low manufacturing costs.
| Report Metric | Details |
| Report Name | Oleochemicals Market |
| The market size in 2022 | USD 22760 Million |
| The revenue forecast in 2028 | USD 26250 Million |
| Growth Rate | Compound Annual Growth Rate (CAGR) of 2.4% from 2022 to 2028 |
| Market size available for years | 2022-2028 |
| Forecast units | Value (USD) |
| Segments covered | By Type, Application & Regions |
| Report coverage | Revenue & volume forecast, company share, competitive landscape, growth factors, and trends |
| Geographic regions covered | North America, Europe, Asia Pacific, Latin America, Middle East & Africa |
Ans. The global market for Oleochemicals estimated at US$ 22760 million in the year 2022, is projected to reach a revised size of US$ 26250 million by 2028.
Ans. The global market for Oleochemicals is expected to grow at a compound annual growth rate of 2.4% from 2022 to 2028.
Ans. Wilmar International, BASF, Eastman Chemical, P&G Chemicals, Cargill, Evonik Industries, Godrej Industries, PTT Global Chemical, Kraton Corporation, Emery Oleochemicals, Alnor Oil, Berg + Schmidt, IsoSciences.
Ans. Yes, ChapterWise report available for the Oleochemicals market.
Table of Figures:
List of Tables
Table 1. Major Company of Fatty acid
Table 2. Major Company of Fatty alcohol
Table 3. Major Company of Glycerin
Table 4. Major Company of Others
Table 5. Global Oleochemicals Sales by Type 2017 VS 2021 VS 2028 (US$ Million)
Table 6. Global Oleochemicals Sales by Type (2017-2022) & (K MT)
Table 7. Global Oleochemicals Sales Market Share in Volume by Type (2017-2022)
Table 8. Global Oleochemicals Sales by Type (2017-2022) & (US& Million)
Table 9. Global Oleochemicals Market Share in Value by Type (2017-2022)
Table 10. Global Oleochemicals Price by Type (2017-2022) & (USD/MT)
Table 11. Global Oleochemicals Sales by Type (2023-2028) & (K MT)
Table 12. Global Oleochemicals Sales Market Share in Volume by Type (2023-2028)
Table 13. Global Oleochemicals Sales by Type (2023-2028) & (US$ Million)
Table 14. Global Oleochemicals Sales Market Share in Value by Type (2023-2028)
Table 15. Global Oleochemicals Price by Type (2023-2028) & (USD/MT)
Table 16. North America Oleochemicals Sales by Type (2017-2022) & (K MT)
Table 17. North America Oleochemicals Sales by Type (2017-2022) & (US$ Million)
Table 18. Europe Oleochemicals Sales (K MT) by Type (2017-2022)
Table 19. Europe Oleochemicals Sales by Type (2017-2022) & (US$ Million)
Table 20. Asia-Pacific Oleochemicals Sales (K MT) by Type (2017-2022)
Table 21. Asia-Pacific Oleochemicals Sales by Type (2017-2022) & (US$ Million)
Table 22. Latin America Oleochemicals Sales (K MT) by Type (2017-2022)
Table 23. Latin America Oleochemicals Sales by Type (2017-2022) & (US$ Million)
Table 24. Middle East and Africa Oleochemicals Sales (K MT) by Type (2017-2022)
Table 25. Middle East and Africa Oleochemicals Sales by Type (2017-2022) & (US$ Million)
Table 26. Global Oleochemicals Sales by Company (2017-2022) & (K MT)
Table 27. Global Oleochemicals Sales Share by Company (2017-2022)
Table 28. Global Oleochemicals Revenue by Company (2017-2022) & (US$ Million)
Table 29. Global Oleochemicals Revenue Share by Company (2017-2022)
Table 30. Global Market Oleochemicals Price by Company (2017-2022) & (USD/MT)
Table 31. Global Oleochemicals Top Manufacturers Manufacturing Base Distribution and Sales Area
Table 32. Global Oleochemicals Manufacturers Market Concentration Ratio (CR5 and HHI)
Table 33. Global Top Manufacturers Market Share by Company Type (Tier 1, Tier 2 and Tier 3) & (based on the Revenue in Oleochemicals as of 2021)
Table 34. Date of Key Manufacturers Enter into Oleochemicals Market
Table 35. Key Manufacturers Oleochemicals Product Type
Table 36. Mergers & Acquisitions, Expansion Plans
Table 37. Global Oleochemicals Market Size Comparison by Region (US$ Million): 2017 VS 2021 VS 2028
Table 38. Global Oleochemicals Sales by Region (2017-2022) & (K MT)
Table 39. Global Oleochemicals Sales Market Share in Volume by Region (2017-2022)
Table 40. Global Oleochemicals Sales by Region (2017-2022) & (US$ Million)
Table 41. Global Oleochemicals Sales Market Share in Value by Region (2017-2022)
Table 42. Global Oleochemicals Sales (K MT), Revenue (US$ Million), Price (USD/MT) and Gross Margin (2017-2022)
Table 43. Global Oleochemicals Sales by Region (2023-2028) & (K MT)
Table 44. Global Oleochemicals Sales Market Share in Volume by Region (2023-2028)
Table 45. Global Oleochemicals Sales by Region (2023-2028) & (US$ Million)
Table 46. Global Oleochemicals Sales Market Share in Value by Region (2023-2028)
Table 47. Global Oleochemicals Sales (K MT), Revenue (US$ Million), Price (USD/MT) and Gross Margin (2023-2028)
Table 48. Global Oleochemicals Sales by Application: 2017 VS 2021 VS 2028 (US$ Million)
Table 49. Global Oleochemicals Sales by Application (2017-2022) & (K MT)
Table 50. Global Oleochemicals Sales Market Share in Volume by Application (2017-2022)
Table 51. Global Oleochemicals Sales by Application (2017-2022) & (US$ Million)
Table 52. Global Oleochemicals Sales Market Share in Value by Application (2017-2022)
Table 53. Global Oleochemicals Price by Application (2017-2022) & (USD/MT)
Table 54. Global Oleochemicals Sales by Application (2023-2028) & (K MT)
Table 55. Global Oleochemicals Sales Market Share in Volume by Application (2023-2028)
Table 56. Global Oleochemicals Sales by Application (2023-2028) & (US$ Million)
Table 57. Global Oleochemicals Sales Market Share in Value by Application (2023-2028)
Table 58. Global Oleochemicals Price by Application (2023-2028) & (USD/MT)
Table 59. North America Oleochemicals Sales by Application (2017-2022) (K MT)
Table 60. North America Oleochemicals Sales by Application (2017-2022) & (US$ Million)
Table 61. North America Oleochemicals Sales Market Share in Value by Application in 2021
Table 62. Europe Oleochemicals Sales by Application (2017-2022) (K MT)
Table 63. Europe Oleochemicals Sales by Application (2017-2022) & (US$ Million)
Table 64. Europe Oleochemicals Sales Market Share in Value by Application in 2021
Table 65. Asia-Pacific Oleochemicals Sales by Application (2017-2022) (K MT)
Table 66. Asia-Pacific Oleochemicals Sales by Application (2017-2022) & (US$ Million)
Table 67. Asia-Pacific Oleochemicals Sales Market Share in Value by Application in 2021
Table 68. Latin America Oleochemicals Sales by Application (2017-2022) (K MT)
Table 69. Latin America Oleochemicals Sales by Application (2017-2022) & (US$ Million)
Table 70. Latin America Oleochemicals Sales Market Share in Value by Application in 2021
Table 71. Middle East and Africa Oleochemicals Sales by Application (2017-2022) (K MT)
Table 72. Middle East and Africa Oleochemicals Sales by Application (2017-2022) & (US$ Million)
Table 73. Middle East and Africa Oleochemicals Sales Market Share in Value by Application in 2021
Table 74. North America Oleochemicals Sales by Country (2017-2022) & (K MT)
Table 75. North America Oleochemicals Sales Market Share in Volume by Country (2017-2022)
Table 76. North America Oleochemicals Sales by Country (2017-2022) & (US$ Million)
Table 77. North America Oleochemicals Sales Market Share in Value by Country (2017-2022)
Table 78. North America Oleochemicals Sales by Country (2023-2028) & (K MT)
Table 79. North America Oleochemicals Sales Market Share in Volume by Country (2023-2028)
Table 80. North America Oleochemicals Sales by Country (2023-2028) & (US$ Million)
Table 81. North America Oleochemicals Sales Market Share in Value by Country (2023-2028)
Table 82. Europe Oleochemicals Sales by Country (2017-2022) & (K MT)
Table 83. Europe Oleochemicals Sales Market Share in Volume by Country (2017-2022)
Table 84. Europe Oleochemicals Sales by Country (2017-2022) & (US$ Million)
Table 85. Europe Oleochemicals Sales Market Share in Value by Country (2017-2022)
Table 86. Europe Oleochemicals Sales by Country (2023-2028) & (K MT)
Table 87. Europe Oleochemicals Sales Market Share in Volume by Country (2023-2028)
Table 88. Europe Oleochemicals Sales by Country (2023-2028) & (US$ Million)
Table 89. Europe Oleochemicals Sales Market Share in Value by Country (2023-2028)
Table 90. Asia-Pacific Oleochemicals Sales by Region (2017-2022) & (K MT)
Table 91. Asia-Pacific Oleochemicals Sales Market Share in Volume by Region (2017-2022)
Table 92. Asia-Pacific Oleochemicals Sales by Region (2017-2022) & (US$ Million)
Table 93. Asia-Pacific Oleochemicals Sales Market Share in Value by Region (2017-2022)
Table 94. Asia-Pacific Oleochemicals Sales by Region (2023-2028) & (K MT)
Table 95. Asia-Pacific Oleochemicals Sales Market Share in Volume by Region (2023-2028)
Table 96. Asia-Pacific Oleochemicals Sales by Region (2023-2028) & (US$ Million)
Table 97. Asia-Pacific Oleochemicals Sales Market Share in Value by Region (2023-2028)
Table 98. Latin America Oleochemicals Sales by Country (2017-2022) & (K MT)
Table 99. Latin America Oleochemicals Sales Market Share in Volume by Country (2017-2022)
Table 100. Latin America Oleochemicals Sales by Country (2017-2022) & (US$ Million)
Table 101. Latin America Oleochemicals Sales Market Share in Value by Country (2017-2022)
Table 102. Latin America Oleochemicals Sales by Country (2023-2028) & (K MT)
Table 103. Latin America Oleochemicals Sales Market Share in Volume by Country (2023-2028)
Table 104. Latin America Oleochemicals Sales by Country (2023-2028) & (US$ Million)
Table 105. Latin America Oleochemicals Sales Market Share in Value by Country (2023-2028)
Table 106. Middle East and Africa Oleochemicals Sales by Country (2017-2022) & (K MT)
Table 107. Middle East and Africa Oleochemicals Sales Market Share in Volume by Country (2017-2022)
Table 108. Middle East and Africa Oleochemicals Sales by Country (2017-2022) & (US$ Million)
Table 109. Middle East and Africa Oleochemicals Sales Market Share in Value by Country (2017-2022)
Table 110. Middle East and Africa Oleochemicals Sales by Country (2023-2028) & (K MT)
Table 111. Middle East and Africa Oleochemicals Sales Market Share in Volume by Country (2023-2028)
Table 112. Middle East and Africa Oleochemicals Sales by Country (2023-2028) & (US$ Million)
Table 113. Middle East and Africa Oleochemicals Sales Market Share in Value by Country (2023-2028)
Table 114. Wilmar International Corporation Information
Table 115. Wilmar International Introduction and Business Overview
Table 116. Wilmar International Oleochemicals Sales (K MT), Revenue (Million USD), Price (USD/MT) and Gross Margin (2017-2022)
Table 117. Wilmar International Oleochemicals Product
Table 118. Wilmar International Recent Development
Table 119. BASF Corporation Information
Table 120. BASF Introduction and Business Overview
Table 121. BASF Oleochemicals Sales (K MT), Revenue (Million USD), Price (USD/MT) and Gross Margin (2017-2022)
Table 122. BASF Oleochemicals Product
Table 123. BASF Recent Development
Table 124. Eastman Chemical Corporation Information
Table 125. Eastman Chemical Introduction and Business Overview
Table 126. Eastman Chemical Oleochemicals Sales (K MT), Revenue (Million USD), Price (USD/MT) and Gross Margin (2017-2022)
Table 127. Eastman Chemical Oleochemicals Product
Table 128. Eastman Chemical Recent Development
Table 129. P&G Chemicals Corporation Information
Table 130. P&G Chemicals Introduction and Business Overview
Table 131. P&G Chemicals Oleochemicals Sales (K MT), Revenue (Million USD), Price (USD/MT) and Gross Margin (2017-2022)
Table 132. P&G Chemicals Oleochemicals Product
Table 133. P&G Chemicals Recent Development
Table 134. Cargill Corporation Information
Table 135. Cargill Introduction and Business Overview
Table 136. Cargill Oleochemicals Sales (K MT), Revenue (Million USD), Price (USD/MT) and Gross Margin (2017-2022)
Table 137. Cargill Oleochemicals Product
Table 138. Cargill Recent Development
Table 139. Evonik Industries Corporation Information
Table 140. Evonik Industries Introduction and Business Overview
Table 141. Evonik Industries Oleochemicals Sales (K MT), Revenue (Million USD), Price (USD/MT) and Gross Margin (2017-2022)
Table 142. Evonik Industries Oleochemicals Product
Table 143. Evonik Industries Recent Development
Table 144. Godrej Industries Corporation Information
Table 145. Godrej Industries Introduction and Business Overview
Table 146. Godrej Industries Oleochemicals Sales (K MT), Revenue (Million USD), Price (USD/MT) and Gross Margin (2017-2022)
Table 147. Godrej Industries Oleochemicals Product
Table 148. Godrej Industries Recent Development
Table 149. PTT Global Chemical Corporation Information
Table 150. PTT Global Chemical Introduction and Business Overview
Table 151. PTT Global Chemical Oleochemicals Sales (K MT), Revenue (Million USD), Price (USD/MT) and Gross Margin (2017-2022)
Table 152. PTT Global Chemical Oleochemicals Product
Table 153. PTT Global Chemical Recent Development
Table 154. Kraton Corporation Corporation Information
Table 155. Kraton Corporation Introduction and Business Overview
Table 156. Kraton Corporation Oleochemicals Sales (K MT), Revenue (Million USD), Price (USD/MT) and Gross Margin (2017-2022)
Table 157. Kraton Corporation Oleochemicals Product
Table 158. Kraton Corporation Recent Development
Table 159. Emery Oleochemicals Corporation Information
Table 160. Emery Oleochemicals Introduction and Business Overview
Table 161. Emery Oleochemicals Oleochemicals Sales (K MT), Revenue (Million USD), Price (USD/MT) and Gross Margin (2017-2022)
Table 162. Emery Oleochemicals Oleochemicals Product
Table 163. Emery Oleochemicals Recent Development
Table 164. Alnor Oil Corporation Information
Table 165. Alnor Oil Introduction and Business Overview
Table 166. Alnor Oil Oleochemicals Sales (K MT), Revenue (Million USD), Price (USD/MT) and Gross Margin (2017-2022)
Table 167. Alnor Oil Oleochemicals Product
Table 168. Alnor Oil Recent Development
Table 169. Berg + Schmidt Corporation Information
Table 170. Berg + Schmidt Introduction and Business Overview
Table 171. Berg + Schmidt Oleochemicals Sales (K MT), Revenue (Million USD), Price (USD/MT) and Gross Margin (2017-2022)
Table 172. Berg + Schmidt Oleochemicals Product
Table 173. Berg + Schmidt Recent Development
Table 174. IsoSciences Corporation Information
Table 175. IsoSciences Introduction and Business Overview
Table 176. IsoSciences Oleochemicals Sales (K MT), Revenue (Million USD), Price (USD/MT) and Gross Margin (2017-2022)
Table 177. IsoSciences Oleochemicals Product
Table 178. IsoSciences Recent Development
Table 179. Vegetable Vitamin Foods Company Corporation Information
Table 180. Vegetable Vitamin Foods Company Introduction and Business Overview
Table 181. Vegetable Vitamin Foods Company Oleochemicals Sales (K MT), Revenue (Million USD), Price (USD/MT) and Gross Margin (2017-2022)
Table 182. Vegetable Vitamin Foods Company Oleochemicals Product
Table 183. Vegetable Vitamin Foods Company Recent Development
Table 184. MYRIANT Corporation Information
Table 185. MYRIANT Introduction and Business Overview
Table 186. MYRIANT Oleochemicals Sales (K MT), Revenue (Million USD), Price (USD/MT) and Gross Margin (2017-2022)
Table 187. MYRIANT Oleochemicals Product
Table 188. MYRIANT Recent Development
Table 189. Key Raw Materials Lists
Table 190. Raw Materials Key Suppliers Lists
Table 191. Oleochemicals Market Trends
Table 192. Oleochemicals Market Drivers
Table 193. Oleochemicals Market Challenges
Table 194. Oleochemicals Market Restraints
Table 195. Oleochemicals Distributors List
Table 196. Oleochemicals Downstream Customers
Table 197. Research Programs/Design for This Report
Table 198. Key Data Information from Secondary Sources
Table 199. Key Data Information from Primary Sources
List of Figures
Figure 1. Oleochemicals Product Picture
Figure 2. Global Oleochemicals Market Size, 2017 VS 2021 VS 2028 (US$ Million)
Figure 3. Global Oleochemicals Market Size Status and Outlook (2017-2028) & (US$ Million)
Figure 4. Global Oleochemicals Sales Status and Outlook (2017-2028) & (K MT)
Figure 5. Product Picture of Fatty acid
Figure 6. Global Fatty acid Sales YoY Growth (2017-2028) & (K MT)
Figure 7. Product Picture of Fatty alcohol
Figure 8. Global Fatty alcohol Sales YoY Growth (2017-2028) & (K MT)
Figure 9. Product Picture of Glycerin
Figure 10. Global Glycerin Sales YoY Growth (2017-2028) & (K MT)
Figure 11. Product Picture of Others
Figure 12. Global Others Sales YoY Growth (2017-2028) & (K MT)
Figure 13. Global Oleochemicals Sales by Type (2017-2028) & (US$ Million)
Figure 14. Global Oleochemicals Sales Market Share in Volume by Type (2017-2022)
Figure 15. Global Oleochemicals Sales Market Share in Value by Type (2017-2022)
Figure 16. Global Oleochemicals Sales Market Share in Volume by Type (2023-2028)
Figure 17. Global Oleochemicals Sales Market Share in Value by Type (2023-2028)
Figure 18. North America Oleochemicals Sales Market Share in Volume by Type in 2021
Figure 19. North America Oleochemicals Sales Market Share in Value by Type in 2021
Figure 20. Europe Oleochemicals Sales Market Share in Volume by Type in 2021
Figure 21. Europe Oleochemicals Sales Market Share in Value by Type in 2021
Figure 22. Asia-Pacific Oleochemicals Sales Market Share in Volume by Type in 2021
Figure 23. Asia-Pacific Oleochemicals Sales Market Share in Value by Type in 2021
Figure 24. Latin America Oleochemicals Sales Market Share in Volume by Type in 2021
Figure 25. Latin America Oleochemicals Sales Market Share in Value by Type in 2021
Figure 26. Middle East and Africa Oleochemicals Sales Market Share in Volume by Type in 2021
Figure 27. Middle East and Africa Oleochemicals Sales Market Share in Value by Type in 2021
Figure 28. The 5 and 10 Largest Manufacturers in the World: Market Share by Oleochemicals Sales in 2021
Figure 29. The 5 and 10 Largest Manufacturers in the World: Market Share by Oleochemicals Revenue in 2021
Figure 30. Oleochemicals Market Share by Company Type (Tier 1, Tier 2, and Tier 3): 2017 VS 2021
Figure 31. Product Picture of Cosmetic & Personal Care
Figure 32. Global Cosmetic & Personal Care Sales YoY Growth (2017-2028) & (K MT)
Figure 33. Product Picture of Food & Beverages
Figure 34. Global Food & Beverages Sales YoY Growth (2017-2028) & (K MT)
Figure 35. Product Picture of Pharmaceutical
Figure 36. Global Pharmaceutical Sales YoY Growth (2017-2028) & (K MT)
Figure 37. Product Picture of Polymers & Plastics Additives
Figure 38. Global Polymers & Plastics Additives Sales YoY Growth (2017-2028) & (K MT)
Figure 39. Product Picture of Others
Figure 40. Global Others Sales YoY Growth (2017-2028) & (K MT)
Figure 41. Global Oleochemicals Sales by Application (2017-2028) & (US$ Million)
Figure 42. Global Oleochemicals Sales Market Share by Application in 2021 & 2028
Figure 43. North America Oleochemicals Sales Market Share in Volume by Application in 2021
Figure 44. Latin America Oleochemicals Sales Market Share in Value by Application in 2021
Figure 45. Middle East and Africa Oleochemicals Sales Market Share in Value by Application in 2021
Figure 46. Key Raw Materials Price
Figure 47. Oleochemicals Manufacturing Cost Structure
Figure 48. Oleochemicals Industrial Chain Analysis
Figure 49. Channels of Distribution
Figure 50. Distributors Profiles
Figure 51. Bottom-up and Top-down Approaches for This Report
Figure 52. Data Triangulation
Figure 53. Key Executives Interviewed
$3350
$6700
HAVE A QUERY?
OUR CUSTOMER

SIMILAR REPORTS