List of Tables
Table 1. Global Anime Derivatives Market Size Growth Rate by Type (US$ Million): 2020 VS 2024 VS 2031
Table 2. Key Players of Toy
Table 3. Key Players of Apparel
Table 4. Key Players of Publication
Table 5. Key Players of Other
Table 6. Global Anime Derivatives Market Size Growth by Application (US$ Million): 2020 VS 2024 VS 2031
Table 7. Global Anime Derivatives Market Size by Region (US$ Million): 2020 VS 2024 VS 2031
Table 8. Global Anime Derivatives Market Size by Region (2020-2025) & (US$ Million)
Table 9. Global Anime Derivatives Market Share by Region (2020-2025)
Table 10. Global Anime Derivatives Forecasted Market Size by Region (2026-2031) & (US$ Million)
Table 11. Global Anime Derivatives Market Share by Region (2026-2031)
Table 12. Anime Derivatives Market Trends
Table 13. Anime Derivatives Market Drivers
Table 14. Anime Derivatives Market Challenges
Table 15. Anime Derivatives Market Restraints
Table 16. Global Anime Derivatives Revenue by Players (2020-2025) & (US$ Million)
Table 17. Global Anime Derivatives Market Share by Players (2020-2025)
Table 18. Global Top Anime Derivatives Players by Company Type (Tier 1, Tier 2, and Tier 3) & (based on the Revenue in Anime Derivatives as of 2024)
Table 19. Ranking of Global Top Anime Derivatives Companies by Revenue (US$ Million) in 2024
Table 20. Global 5 Largest Players Market Share by Anime Derivatives Revenue (CR5 and HHI) & (2020-2025)
Table 21. Global Key Players of Anime Derivatives, Headquarters and Area Served
Table 22. Global Key Players of Anime Derivatives, Product and Application
Table 23. Global Key Players of Anime Derivatives, Date of Enter into This Industry
Table 24. Mergers & Acquisitions, Expansion Plans
Table 25. Global Anime Derivatives Market Size by Type (2020-2025) & (US$ Million)
Table 26. Global Anime Derivatives Revenue Market Share by Type (2020-2025)
Table 27. Global Anime Derivatives Forecasted Market Size by Type (2026-2031) & (US$ Million)
Table 28. Global Anime Derivatives Revenue Market Share by Type (2026-2031)
Table 29. Global Anime Derivatives Market Size by Application (2020-2025) & (US$ Million)
Table 30. Global Anime Derivatives Revenue Market Share by Application (2020-2025)
Table 31. Global Anime Derivatives Forecasted Market Size by Application (2026-2031) & (US$ Million)
Table 32. Global Anime Derivatives Revenue Market Share by Application (2026-2031)
Table 33. North America Anime Derivatives Market Size Growth Rate by Country (US$ Million): 2020 VS 2024 VS 2031
Table 34. North America Anime Derivatives Market Size by Country (2020-2025) & (US$ Million)
Table 35. North America Anime Derivatives Market Size by Country (2026-2031) & (US$ Million)
Table 36. Europe Anime Derivatives Market Size Growth Rate by Country (US$ Million): 2020 VS 2024 VS 2031
Table 37. Europe Anime Derivatives Market Size by Country (2020-2025) & (US$ Million)
Table 38. Europe Anime Derivatives Market Size by Country (2026-2031) & (US$ Million)
Table 39. Asia-Pacific Anime Derivatives Market Size Growth Rate by Region (US$ Million): 2020 VS 2024 VS 2031
Table 40. Asia-Pacific Anime Derivatives Market Size by Region (2020-2025) & (US$ Million)
Table 41. Asia-Pacific Anime Derivatives Market Size by Region (2026-2031) & (US$ Million)
Table 42. Latin America Anime Derivatives Market Size Growth Rate by Country (US$ Million): 2020 VS 2024 VS 2031
Table 43. Latin America Anime Derivatives Market Size by Country (2020-2025) & (US$ Million)
Table 44. Latin America Anime Derivatives Market Size by Country (2026-2031) & (US$ Million)
Table 45. Middle East & Africa Anime Derivatives Market Size Growth Rate by Country (US$ Million): 2020 VS 2024 VS 2031
Table 46. Middle East & Africa Anime Derivatives Market Size by Country (2020-2025) & (US$ Million)
Table 47. Middle East & Africa Anime Derivatives Market Size by Country (2026-2031) & (US$ Million)
Table 48. The Walt Disney Company Company Details
Table 49. The Walt Disney Company Business Overview
Table 50. The Walt Disney Company Anime Derivatives Product
Table 51. The Walt Disney Company Revenue in Anime Derivatives Business (2020-2025) & (US$ Million)
Table 52. The Walt Disney Company Recent Development
Table 53. Bandai Namco Holdings Company Details
Table 54. Bandai Namco Holdings Business Overview
Table 55. Bandai Namco Holdings Anime Derivatives Product
Table 56. Bandai Namco Holdings Revenue in Anime Derivatives Business (2020-2025) & (US$ Million)
Table 57. Bandai Namco Holdings Recent Development
Table 58. Hasbro Company Details
Table 59. Hasbro Business Overview
Table 60. Hasbro Anime Derivatives Product
Table 61. Hasbro Revenue in Anime Derivatives Business (2020-2025) & (US$ Million)
Table 62. Hasbro Recent Development
Table 63. Toei Animation Company Details
Table 64. Toei Animation Business Overview
Table 65. Toei Animation Anime Derivatives Product
Table 66. Toei Animation Revenue in Anime Derivatives Business (2020-2025) & (US$ Million)
Table 67. Toei Animation Recent Development
Table 68. Good Smile Company Company Details
Table 69. Good Smile Company Business Overview
Table 70. Good Smile Company Anime Derivatives Product
Table 71. Good Smile Company Revenue in Anime Derivatives Business (2020-2025) & (US$ Million)
Table 72. Good Smile Company Recent Development
Table 73. Funko Company Details
Table 74. Funko Business Overview
Table 75. Funko Anime Derivatives Product
Table 76. Funko Revenue in Anime Derivatives Business (2020-2025) & (US$ Million)
Table 77. Funko Recent Development
Table 78. Hot Toys Company Details
Table 79. Hot Toys Business Overview
Table 80. Hot Toys Anime Derivatives Product
Table 81. Hot Toys Revenue in Anime Derivatives Business (2020-2025) & (US$ Million)
Table 82. Hot Toys Recent Development
Table 83. Medicom Toy Company Details
Table 84. Medicom Toy Business Overview
Table 85. Medicom Toy Anime Derivatives Product
Table 86. Medicom Toy Revenue in Anime Derivatives Business (2020-2025) & (US$ Million)
Table 87. Medicom Toy Recent Development
Table 88. Kotobukiya Company Details
Table 89. Kotobukiya Business Overview
Table 90. Kotobukiya Anime Derivatives Product
Table 91. Kotobukiya Revenue in Anime Derivatives Business (2020-2025) & (US$ Million)
Table 92. Kotobukiya Recent Development
Table 93. Guangdong Aofei Animation Culture Company Details
Table 94. Guangdong Aofei Animation Culture Business Overview
Table 95. Guangdong Aofei Animation Culture Anime Derivatives Product
Table 96. Guangdong Aofei Animation Culture Revenue in Anime Derivatives Business (2020-2025) & (US$ Million)
Table 97. Guangdong Aofei Animation Culture Recent Development
Table 98. Huaqiang Fangte Culture Technology Group Company Details
Table 99. Huaqiang Fangte Culture Technology Group Business Overview
Table 100. Huaqiang Fangte Culture Technology Group Anime Derivatives Product
Table 101. Huaqiang Fangte Culture Technology Group Revenue in Anime Derivatives Business (2020-2025) & (US$ Million)
Table 102. Huaqiang Fangte Culture Technology Group Recent Development
Table 103. Guangdong Yongsheng Animation Company Details
Table 104. Guangdong Yongsheng Animation Business Overview
Table 105. Guangdong Yongsheng Animation Anime Derivatives Product
Table 106. Guangdong Yongsheng Animation Revenue in Anime Derivatives Business (2020-2025) & (US$ Million)
Table 107. Guangdong Yongsheng Animation Recent Development
Table 108. Shenzhen Jiahong Animation Toys Company Details
Table 109. Shenzhen Jiahong Animation Toys Business Overview
Table 110. Shenzhen Jiahong Animation Toys Anime Derivatives Product
Table 111. Shenzhen Jiahong Animation Toys Revenue in Anime Derivatives Business (2020-2025) & (US$ Million)
Table 112. Shenzhen Jiahong Animation Toys Recent Development
Table 113. Guangdong Woma Animation Toys Company Details
Table 114. Guangdong Woma Animation Toys Business Overview
Table 115. Guangdong Woma Animation Toys Anime Derivatives Product
Table 116. Guangdong Woma Animation Toys Revenue in Anime Derivatives Business (2020-2025) & (US$ Million)
Table 117. Guangdong Woma Animation Toys Recent Development
Table 118. Aoguang Animation Company Details
Table 119. Aoguang Animation Business Overview
Table 120. Aoguang Animation Anime Derivatives Product
Table 121. Aoguang Animation Revenue in Anime Derivatives Business (2020-2025) & (US$ Million)
Table 122. Aoguang Animation Recent Development
Table 123. Fun Nest Creative Culture (Shenzhen) Company Details
Table 124. Fun Nest Creative Culture (Shenzhen) Business Overview
Table 125. Fun Nest Creative Culture (Shenzhen) Anime Derivatives Product
Table 126. Fun Nest Creative Culture (Shenzhen) Revenue in Anime Derivatives Business (2020-2025) & (US$ Million)
Table 127. Fun Nest Creative Culture (Shenzhen) Recent Development
Table 128. Guangzhou Chaosheng Animation Technology Company Details
Table 129. Guangzhou Chaosheng Animation Technology Business Overview
Table 130. Guangzhou Chaosheng Animation Technology Anime Derivatives Product
Table 131. Guangzhou Chaosheng Animation Technology Revenue in Anime Derivatives Business (2020-2025) & (US$ Million)
Table 132. Guangzhou Chaosheng Animation Technology Recent Development
Table 133. Jinan Aidong Animation Technology Company Details
Table 134. Jinan Aidong Animation Technology Business Overview
Table 135. Jinan Aidong Animation Technology Anime Derivatives Product
Table 136. Jinan Aidong Animation Technology Revenue in Anime Derivatives Business (2020-2025) & (US$ Million)
Table 137. Jinan Aidong Animation Technology Recent Development
Table 138. Guangdong Xiaobailong Animation Culture Company Details
Table 139. Guangdong Xiaobailong Animation Culture Business Overview
Table 140. Guangdong Xiaobailong Animation Culture Anime Derivatives Product
Table 141. Guangdong Xiaobailong Animation Culture Revenue in Anime Derivatives Business (2020-2025) & (US$ Million)
Table 142. Guangdong Xiaobailong Animation Culture Recent Development
Table 143. Guangzhou Hongmao Lantu Technology Company Details
Table 144. Guangzhou Hongmao Lantu Technology Business Overview
Table 145. Guangzhou Hongmao Lantu Technology Anime Derivatives Product
Table 146. Guangzhou Hongmao Lantu Technology Revenue in Anime Derivatives Business (2020-2025) & (US$ Million)
Table 147. Guangzhou Hongmao Lantu Technology Recent Development
Table 148. Shandong Zhongdong Culture Media Company Details
Table 149. Shandong Zhongdong Culture Media Business Overview
Table 150. Shandong Zhongdong Culture Media Anime Derivatives Product
Table 151. Shandong Zhongdong Culture Media Revenue in Anime Derivatives Business (2020-2025) & (US$ Million)
Table 152. Shandong Zhongdong Culture Media Recent Development
Table 153. Hangzhou Animation Continuous Clothing Company Details
Table 154. Hangzhou Animation Continuous Clothing Business Overview
Table 155. Hangzhou Animation Continuous Clothing Anime Derivatives Product
Table 156. Hangzhou Animation Continuous Clothing Revenue in Anime Derivatives Business (2020-2025) & (US$ Million)
Table 157. Hangzhou Animation Continuous Clothing Recent Development
Table 158. Research Programs/Design for This Report
Table 159. Key Data Information from Secondary Sources
Table 160. Key Data Information from Primary Sources
Table 161. Authors List of This Report
List of Figures
Figure 1. Anime Derivatives Picture
Figure 2. Global Anime Derivatives Market Size Comparison by Type (2020-2031) & (US$ Million)
Figure 3. Global Anime Derivatives Market Share by Type: 2024 VS 2031
Figure 4. Toy Features
Figure 5. Apparel Features
Figure 6. Publication Features
Figure 7. Other Features
Figure 8. Global Anime Derivatives Market Size by Application (2020-2031) & (US$ Million)
Figure 9. Global Anime Derivatives Market Share by Application: 2024 VS 2031
Figure 10. Teenagers Case Studies
Figure 11. Adult Group Case Studies
Figure 12. Anime Derivatives Report Years Considered
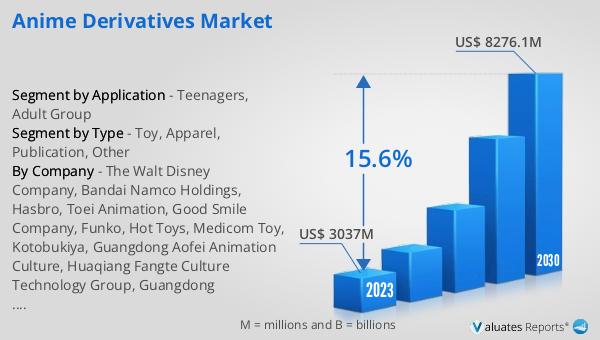
Figure 13. Global Anime Derivatives Market Size (US$ Million), Year-over-Year: 2020-2031
Figure 14. Global Anime Derivatives Market Size, (US$ Million), 2020 VS 2024 VS 2031
Figure 15. Global Anime Derivatives Market Share by Region: 2024 VS 2031
Figure 16. Global Anime Derivatives Market Share by Players in 2024
Figure 17. Global Top Anime Derivatives Players by Company Type (Tier 1, Tier 2, and Tier 3) & (based on the Revenue in Anime Derivatives as of 2024)
Figure 18. The Top 10 and 5 Players Market Share by Anime Derivatives Revenue in 2024
Figure 19. North America Anime Derivatives Market Size YoY Growth (2020-2031) & (US$ Million)
Figure 20. North America Anime Derivatives Market Share by Country (2020-2031)
Figure 21. United States Anime Derivatives Market Size YoY Growth (2020-2031) & (US$ Million)
Figure 22. Canada Anime Derivatives Market Size YoY Growth (2020-2031) & (US$ Million)
Figure 23. Europe Anime Derivatives Market Size YoY Growth (2020-2031) & (US$ Million)
Figure 24. Europe Anime Derivatives Market Share by Country (2020-2031)
Figure 25. Germany Anime Derivatives Market Size YoY Growth (2020-2031) & (US$ Million)
Figure 26. France Anime Derivatives Market Size YoY Growth (2020-2031) & (US$ Million)
Figure 27. U.K. Anime Derivatives Market Size YoY Growth (2020-2031) & (US$ Million)
Figure 28. Italy Anime Derivatives Market Size YoY Growth (2020-2031) & (US$ Million)
Figure 29. Russia Anime Derivatives Market Size YoY Growth (2020-2031) & (US$ Million)
Figure 30. Nordic Countries Anime Derivatives Market Size YoY Growth (2020-2031) & (US$ Million)
Figure 31. Asia-Pacific Anime Derivatives Market Size YoY Growth (2020-2031) & (US$ Million)
Figure 32. Asia-Pacific Anime Derivatives Market Share by Region (2020-2031)
Figure 33. China Anime Derivatives Market Size YoY Growth (2020-2031) & (US$ Million)
Figure 34. Japan Anime Derivatives Market Size YoY Growth (2020-2031) & (US$ Million)
Figure 35. South Korea Anime Derivatives Market Size YoY Growth (2020-2031) & (US$ Million)
Figure 36. Southeast Asia Anime Derivatives Market Size YoY Growth (2020-2031) & (US$ Million)
Figure 37. India Anime Derivatives Market Size YoY Growth (2020-2031) & (US$ Million)
Figure 38. Australia Anime Derivatives Market Size YoY Growth (2020-2031) & (US$ Million)
Figure 39. Latin America Anime Derivatives Market Size YoY Growth (2020-2031) & (US$ Million)
Figure 40. Latin America Anime Derivatives Market Share by Country (2020-2031)
Figure 41. Mexico Anime Derivatives Market Size YoY Growth (2020-2031) & (US$ Million)
Figure 42. Brazil Anime Derivatives Market Size YoY Growth (2020-2031) & (US$ Million)
Figure 43. Middle East & Africa Anime Derivatives Market Size YoY Growth (2020-2031) & (US$ Million)
Figure 44. Middle East & Africa Anime Derivatives Market Share by Country (2020-2031)
Figure 45. Turkey Anime Derivatives Market Size YoY Growth (2020-2031) & (US$ Million)
Figure 46. Saudi Arabia Anime Derivatives Market Size YoY Growth (2020-2031) & (US$ Million)
Figure 47. UAE Anime Derivatives Market Size YoY Growth (2020-2031) & (US$ Million)
Figure 48. The Walt Disney Company Revenue Growth Rate in Anime Derivatives Business (2020-2025)
Figure 49. Bandai Namco Holdings Revenue Growth Rate in Anime Derivatives Business (2020-2025)
Figure 50. Hasbro Revenue Growth Rate in Anime Derivatives Business (2020-2025)
Figure 51. Toei Animation Revenue Growth Rate in Anime Derivatives Business (2020-2025)
Figure 52. Good Smile Company Revenue Growth Rate in Anime Derivatives Business (2020-2025)
Figure 53. Funko Revenue Growth Rate in Anime Derivatives Business (2020-2025)
Figure 54. Hot Toys Revenue Growth Rate in Anime Derivatives Business (2020-2025)
Figure 55. Medicom Toy Revenue Growth Rate in Anime Derivatives Business (2020-2025)
Figure 56. Kotobukiya Revenue Growth Rate in Anime Derivatives Business (2020-2025)
Figure 57. Guangdong Aofei Animation Culture Revenue Growth Rate in Anime Derivatives Business (2020-2025)
Figure 58. Huaqiang Fangte Culture Technology Group Revenue Growth Rate in Anime Derivatives Business (2020-2025)
Figure 59. Guangdong Yongsheng Animation Revenue Growth Rate in Anime Derivatives Business (2020-2025)
Figure 60. Shenzhen Jiahong Animation Toys Revenue Growth Rate in Anime Derivatives Business (2020-2025)
Figure 61. Guangdong Woma Animation Toys Revenue Growth Rate in Anime Derivatives Business (2020-2025)
Figure 62. Aoguang Animation Revenue Growth Rate in Anime Derivatives Business (2020-2025)
Figure 63. Fun Nest Creative Culture (Shenzhen) Revenue Growth Rate in Anime Derivatives Business (2020-2025)
Figure 64. Guangzhou Chaosheng Animation Technology Revenue Growth Rate in Anime Derivatives Business (2020-2025)
Figure 65. Jinan Aidong Animation Technology Revenue Growth Rate in Anime Derivatives Business (2020-2025)
Figure 66. Guangdong Xiaobailong Animation Culture Revenue Growth Rate in Anime Derivatives Business (2020-2025)
Figure 67. Guangzhou Hongmao Lantu Technology Revenue Growth Rate in Anime Derivatives Business (2020-2025)
Figure 68. Shandong Zhongdong Culture Media Revenue Growth Rate in Anime Derivatives Business (2020-2025)
Figure 69. Hangzhou Animation Continuous Clothing Revenue Growth Rate in Anime Derivatives Business (2020-2025)
Figure 70. Bottom-up and Top-down Approaches for This Report
Figure 71. Data Triangulation
Figure 72. Key Executives Interviewed