
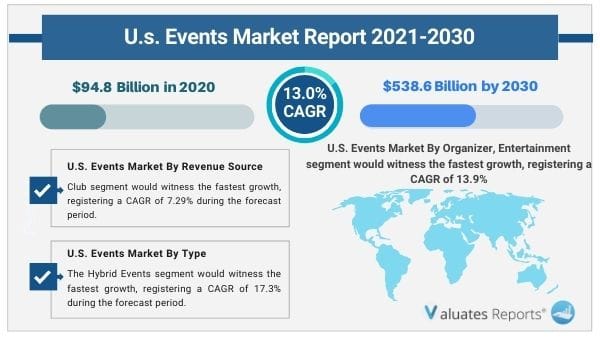
The U.S. events market size was valued at $94.8 billion in 2020 and is expected to reach $538.6 billion by 2030, registering a pound Annual Growth Rate (CAGR) of 13.0% from 2021 to 2030.
Events refer to public gathering of populace art at a determined time and place. The purpose for staging an event can be increase in business profitability, celebratory, entertainment, and community causes among others. The most popular events include conference & exhibition, corporate events & seminars, promotion & fundraising, music & art performance, sports, festival, trade shows, and product launch. The key stakeholders within the events market are corporate organizations, public organizations & NGOs.
The initial stage of a major event involves understanding the audience and their behavior that excites and emotionally engages them. The final stage involves conducting events, such as music concerts, sports, exhibitions & conferences, seminars, and others, appropriately. It has been witnessed that events such as music concerts attract majority of the population, especially the youth and middle-aged individuals, which boost the growth of the U.S. events industry size. Although the album sales have drastically reduced, shift in preference of artists and performers toward touring and conducting music concerts at various places across the world has further driven the U.S. events market growth. In addition, rock and pop music dominates most of the markets, globally while the U.S. population prefers rap and hip-hop. Thus, increase in such music concerts and events offers valuable opportunities for promoters and brands to align themselves with people attending concerts. Furthermore, sports events have become more commercialized in the recent years. Thus, sports serve as a significant marketing advertisement opportunity for event management companies, which sponsor these events. In addition, sponsorships from various brands such as Redbull, Monster Energy, Nike, Cocoa Cola for major global three-day festival as well as small gig or act in a social club or arena boost the growth of the events industry. Moreover, deployment of best-in-class technology that can handle the entire event propels the industry growth. However, higher entry barriers and presence of alternatives are some of the major challenges of the market. On the contrary, increase in infrastructural investment and technological upgradation, such as projection mapping that creates an augmented reality of experience created through projectors as well as branded multi-use apps that are used to bool tickets, survey attendees, and polling crowds in real time accelerate the market growth. These factors are anticipated to offer ample opportunities for the players in the U.S. events industry.
The U.S. Events market is segmented into segmented based on type, revenue source, organizer, age group, and income group. Depending on type, the industry is divided into music concert, festivals, sports, exhibitions & conferences, corporate events & seminar, webinar, hybrid events, and others. On the basis of revenue source, it is segregated into ticket sale, sponsorship, and others. As per organizer, it is categorized into corporate, sports, education, entertainment, and others. By age group, it is fragmented into below 20 years, 21–40years, and above 40 years. Based on income group, it is segmented into upper class, upper middle class, lower middle class, and lower class.
According to the U.S. Events market analysis on the basis of type, the corporate events & seminar type segment accounted for the maximum share in the 2020. This is attributed to to rise in number of corporate companies coupled with frequent seminars and events conducted by them. In addition, seminars and events involve interaction between speaker and audience, thereby increasing the number of attendees.
By revenue source, the sponsorship segment dominated the market, which accounted for 48% U.S. Events market share in 2020, and is expected to continue this trend throughout the U.S. Events market forecast period. Moreover, sponsoring an event increases reach among potential buyers and customers, which drives the sales.
On the basis of age group, the 21–40 years segment contributed to the maximum share in 2019, owing to rise in interest toward entrepreneurs & business seminars along with music concerts and festive gatherings.
The major players analyzed in U.S. Events market report are Access Destination Services, LLC, Anschutz Entertainment Group, BCD Meeting & Events, BI Worldwide, Creative Group, Inc., Cvent, Inc., ITA Group, Maritz Holdings, Inc., The ATPI Group, and 360 Destination Group.
| Report Metric |
Details |
| Report Name |
U.s. Events Market |
| The market size in 2020 |
USD 94.8 Billion |
| The revenue forecast in 2030 |
USD 538.6 Billion |
| Growth Rate |
Compound Annual Growth Rate (CAGR) of 13.0% from 2021 to 2030 |
| Market size available for years |
2021-2030 |
| Forecast units |
Value (USD) |
| Segments covered |
Type, End-User, and Region |
| Report coverage |
Revenue & volume forecast, company share, competitive landscape, growth factors, and trends |
| Geographic regions covered |
North America, Europe, Asia Pacific, Latin America, Middle East & Africa |
Ans. Increase in infrastructural investment and technological upgradation, such as projection mapping that creates an augmented reality of experience created through projectors as well as branded multi-use apps that are used to bool tickets, survey attendees, and polling crowds in real time accelerate the market growth
Ans. The U.S. Events market is segmented into segmented based on type, revenue source, organizer, age group, and income group.
Ans. The major players analyzed in U.S. Events market report are Access Destination Services, LLC, Anschutz Entertainment Group, BCD Meeting & Events, BI Worldwide, Creative Group, Inc., Cvent, Inc., ITA Group, Maritz Holdings, Inc., The ATPI Group, and 360 Destination Group.
Ans. The forecast period in the market report is 2021-2030.
Ans. The U.S. Event industry is likely to recover the covid impact by the end of 2023.
CHAPTER 1:INTRODUCTION
1.1.Report description
1.2.Key benefits for stakeholders
1.3.Key market segments
1.4.Research methodology
1.4.1.Secondary research
1.4.2.Primary research
1.5.Analyst tools and models
CHAPTER 2:EXECUTIVE SUMMARY
2.1.Key findings of the study
2.1.2.Top investment pocket
2.2.CXO perspective
CHAPTER 3:MARKET OVERVIEW
3.1.Market definition and scope
3.2.Porter's five forces analysis
3.4.Market dynamics
3.4.1.Drivers
3.4.1.1.Increase in sponsorship for events
3.4.1.2.Rise in interest among youth in entrepreneur & business seminars
3.4.1.3.Rise in disposable income
3.4.2.Restraints
3.4.2.1.High operational cost involved in organizing events
3.4.2.2.Entry barriers due to presence of existing giant players
3.4.3.Opportunities
3.4.3.1.Technological advancements
3.5.Covid-19 Impact on U.S. Events Industry
CHAPTER 4:U.S. EVENTS INDUSTRY, BY TYPE
4.1.Overview
4.1.1.Market size and forecast
4.2.Music Concert
4.2.1.Key market trends, growth factors, and opportunities
4.2.2.Market size and forecast
4.3.Festivals
4.3.1.Key market trends, growth factors, and opportunities
4.3.2.Market size and forecast
4.4.Sports
4.4.1.Key market trends, growth factors, and opportunities
4.4.2.Market size and forecast
4.5.Exhibitions and Conferences
4.5.1.Key market trends, growth factors, and opportunities
4.5.2.Market size and forecast
4.6.Corporate events and seminars
4.6.1.Key market trends, growth factors, and opportunities
4.6.2.Market size and forecast
4.7.Webinar
4.7.1.Key market trends, growth factors, and opportunities
4.7.2.Market size and forecast
4.8.Hybrid Events
4.8.1.Key market trends, growth factors, and opportunities
4.8.2.Market size and forecast
4.9.Others
4.9.1.Key market trends, growth factors, and opportunities
4.9.2.Market size and forecast
CHAPTER 5:U.S. EVENTS INDUSTRY, BY REVENUE SOURCE
5.1.Overview
5.1.1.Market size and forecast
5.2.Ticket sale
5.2.1.Key market trends, growth factors, and opportunities
5.2.2.Market size and forecast
5.3.Sponsorship
5.3.1.Key market trends, growth factors, and opportunities
5.3.2.Market size and forecast
5.4.Others
5.4.1.Key market trends, growth factors, and opportunities
5.4.2.Market size and forecast
CHAPTER 6:U.S. EVENTS INDUSTRY, BY ORGANIZER
6.1.Overview
6.1.1.Market size and forecast
6.2.Corporate
6.2.1.Key market trends, growth factors, and opportunities
6.2.2.Market size and forecast
6.3.Sports
6.3.1.Key market trends, growth factors, and opportunities
6.3.2.Market size and forecast
6.4.Education
6.4.1.Key market trends, growth factors, and opportunities
6.4.2.Market size and forecast
6.5.Entertainment
6.5.1.Key market trends, growth factors, and opportunities
6.5.2.Market size and forecast
6.6.Others
6.6.1.Key market trends, growth factors, and opportunities
6.6.2.Market size and forecast
CHAPTER 7:U.S. EVENTS INDUSTRY, BY AGE GROUP
7.1.Overview
7.1.1.Market size and forecast
7.2.Below 20 years
7.2.1.Key market trends, growth factors, and opportunities
7.2.2.Market size and forecast
7.3.21-40 Years
7.3.1.Key market trends, growth factors, and opportunities
7.3.2.Market size and forecast
7.4.Above 41 years
7.4.1.Key market trends, growth factors, and opportunities
7.4.2.Market size and forecast
CHAPTER 8:U.S. EVENTS INDUSTRY, BY INCOME GROUP
8.1.Overview
8.1.1.Market size and forecast
8.2.Upper class
8.2.1.Key market trends, growth factors, and opportunities
8.2.2.Market size and forecast
8.3.Upper middle class
8.3.1.Key market trends, growth factors, and opportunities
8.3.2.Market size and forecast
8.4.Lower middle class
8.4.1.Key market trends, growth factors, and opportunities
8.4.2.Market size and forecast
8.5.Lower class
8.5.1.Key market trends, growth factors, and opportunities
8.5.2.Market size and forecast
CHAPTER 9:COMPETITION LANDSCAPE
9.1.Top winning strategies
9.2.Product mapping
9.3.Competitive dashboard
9.4.Competitive heat map
9.5.Key developments
9.5.1.Acquisition
9.5.2.Business Expansion
9.5.3.Partnership
CHAPTER 10:COMPANY PROFILES
10.1.ACCESS DESTINATION SERVICES
10.1.1.Company overview
10.1.2.Key Executives
10.1.3.Company snapshot
10.1.4.Service portfolio
10.1.5.Key strategic moves and developments
10.2.ANSCHUTZ ENTERTAINMENT GROUP
10.2.1.Company overview
10.2.2.Key Executive
10.2.3.Company snapshot
10.2.4.Service portfolio
10.2.5.Key strategic moves and developments
10.3.BCD MEETING & EVENTS
10.3.1.Company overview
10.3.2.Key Executives
10.3.3.Company snapshot
10.3.4.Operating business segments
10.3.5.Service portfolio
10.3.6.Key strategic moves and developments
10.4.BI WORLDWIDE
10.4.1.Company overview
10.4.2.Key Executives
10.4.3.Company snapshot
10.4.4.Service portfolio
10.5.CREATIVE GROUP, INC.
10.5.1.Company overview
10.5.2.Key Executives
10.5.3.Company snapshot
10.5.4.Service portfolio
10.5.5.Key strategic moves and developments
10.6.CVENT, INC.
10.6.1.Company overview
10.6.2.Key Executives
10.6.3.Company snapshot
10.6.4.Service portfolio
10.6.5.Key strategic moves and developments
10.7.ITA GROUP
10.7.1.Company overview
10.7.2.Key Executives
10.7.3.Company snapshot
10.7.4.Service portfolio
10.7.5.Key strategic moves and developments
10.8.MARITZ HOLDINGS INC.
10.8.1.Company overview
10.8.2.Key Executives
10.8.3.Company snapshot
10.8.4.Service portfolio
10.9.THE ATPI GROUP
10.9.1.Company overview
10.9.2.Key Executives
10.9.3.Company snapshot
10.9.4.Service portfolio
10.9.5.Key strategic moves and developments
10.10.360 DESTINATION GROUP
10.10.1.Company overview
10.10.2.Key Executives
10.10.3.Company snapshot
10.10.4.Service portfolio
10.10.5.Key strategic moves and developments
Table 01.U.S. Events Industry, By Type, 2020-2030 ($Billion)
Table 02.U.S. Events Industry, By Revenue Source, 2020-2030 ($Billion)
Table 03.U.S. Events Industry, By Organizer, 2020-2030 ($Billion)
Table 04.U.S. Events Industry, By Age Group, 2020-2030 ($Billion)
Table 05.U.S. Events Industry, By Income Group, 2020-2030 ($Billion)
Table 06.Access Destination Services: Key Executives
Table 07.Access Destination Services: Company Snapshot
Table 08.Access Destination Services: Service Portfolio
Table 09.Anschutz Entertainment Group: Key Executive
Table 10.Anschutz Entertainment Group: Company Snapshot
Table 11.Anschutz Entertainment Group: Service Portfolio
Table 12.Bcd Meeting & Events: Key Executives
Table 13.Bcd Meeting & Events: Company Snapshot
Table 14.Bcd Meeting & Events: Operating Segments
Table 15.Bcd Meeting & Events: Service Portfolio
Table 16.Bi Worldwide: Key Executives
Table 17.Bi Worldwide: Company Snapshot
Table 18.Bi Worldwide: Service Portfolio
Table 19.Creative Group, Inc.: Key Executives
Table 20.Creative Group, Inc.: Company Snapshot
Table 21.Creative Group, Inc.: Service Portfolio
Table 22.Cvent, Inc.: Key Executives
Table 23.Cvent, Inc.: Company Snapshot
Table 24.Cvent, Inc.: Service Portfolio
Table 25.Ita Group: Key Executives
Table 26.Ita Group: Company Snapshot
Table 27.Ita Group: Service Portfolio
Table 28.Maritz Holdings, Inc.: Key Executives
Table 29.Maritz Holdings, Inc.: Company Snapshot
Table 30.Maritz Holdings, Inc.: Service Portfolio
Table 31.The Atpi Group: Key Executives
Table 32.The Atpi Group: Company Snapshot
Table 33.The Atpi Group: Service Portfolio
Table 34.360 Destination Group: Key Executives
Table 35.360 Destination Group: Company Snapshot
Table 36.360 Destination Group: Service Portfolio
List Of Figures
Figure 01.U.S. Events Industry Segmentation
Figure 02.Executive Summary
Figure 03.Top Investment Pocket
Figure 04.Moderate Bargaining Power Of Suppliers
Figure 05.Low Bargaining Power Of Buyers
Figure 06.Moderate Threat Of New Entrants
Figure 07.Moderate Threat Of Substitutes
Figure 08.High Intensity Of Competitive Rivalry
Figure 09.U.S. Events Industry: Drivers, Restraints, And Opportunities
Figure 10.U.S. Events Industry, By Type, 2020 (%)
Figure 11.U.S. Events Industry, By Revenue Source, 2020 (%)
Figure 12.U.S. Events Industry, By Organizer, 2020 (%)
Figure 13.U.S. Events Industry, By Age Group, 2020 (%)
Figure 14.U.S. Events Industry, By Income Group, 2020 (%)
Figure 15.Top Winning Strategies, By Year, 2018–2021*
Figure 16.Top Winning Strategies, By Development, 2018–2021* (%)
Figure 17.Product Mapping Of Top 10 Key Players
Figure 18.Competitive Dashboard Of Top 10 Key Players
Figure 19.Competitive Heatmap Of Top 10 Key Players
$3314
$5147
HAVE A QUERY?
OUR CUSTOMER

SIMILAR REPORTS
Add to Cart
Add to Cart
Add to Cart
Add to Cart