
Healthcare business process outsourcing (BPO) is a practice in which healthcare organizations outsource business operations to outside vendors.
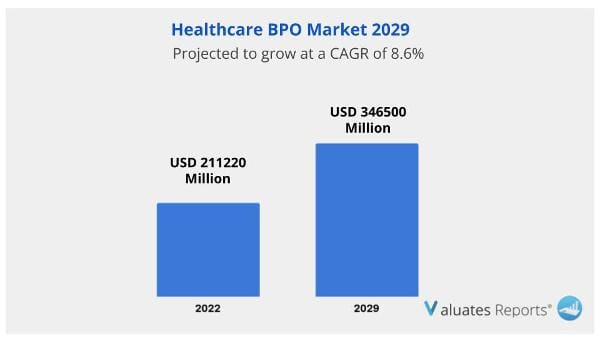
The global Healthcare BPO market was valued at USD 211220 million in 2022 and is anticipated to reach USD 346500 million by 2029, witnessing a CAGR of 8.6% during the forecast period 2023-2029. The influence of COVID-19 and the Russia-Ukraine War were considered while estimating market sizes.
Outsourcing business operations to external suppliers is a practice known as healthcare business process outsourcing (BPO).
Healthcare business process outsourcing is the assignment of a task to a third party. The government can lower healthcare costs by enacting favorable legislation to promote the expansion of the healthcare business process point market and raise industry consolidation. To secure the privacy of patient information that is secret, to identify and manage network security fraud, and to guarantee that significant errors are avoided, hospitals and the healthcare system mostly outsource their commercial operations in the healthcare sector. Patient care has improved and workflow efficiency has increased as a result of the development of business process outsourcing in the healthcare industry. This factor is expected to drive the growth of the Healthcare BPO market.
Medical care has, in fact, been changing continuously as a result of the need to strike a balance among the numerous aspects of cost-controlling operations, business profits, and legislation intended to improve outcomes. The constant need to enhance patient and consumer services within the framework of financial as well as bottom-line constraints has given rise to new firm concepts. The ongoing initiatives to enhance care coordination and develop healthier healthcare consumers are what is driving the expansion of the Healthcare BPO market.
The financial model for important suppliers to the nursing service activity has been strengthened by their greater contribution to improving patient care and population health, and aiding healthcare providers in cost-optimization. Additionally, information security would be at risk. Information security is a concern because contracting exposes a lot of sensitive information to any third party. Additionally, there are questions concerning the quality of the services given because it's possible that a service provider isn't really concerned or interested in offering alternatives or therapies to the parties involved as much as their primary business is. These substances are expected to act as growth inhibitors.
A variety of temporary tasks are typically transferred using outsourcing, which lowers operating costs. Among the key end, customers are manufacturing, drug development, marketing, and statistics. In the hospital BPO sector, clinical coding and accounting, expenditure reports, and information processing procedures are becoming more and more in demand.
Global Healthcare BPO key players include Quintiles, HCL, Cognizant, Inventiv, Lonza, etc.
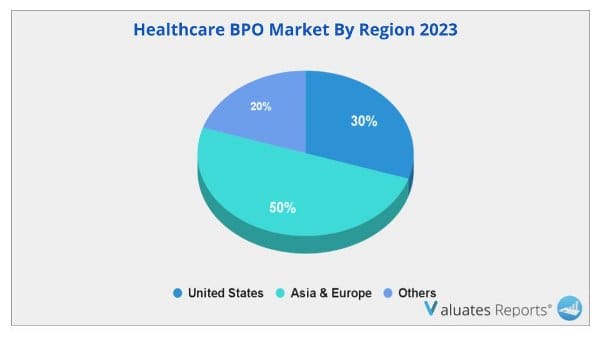
The United States is the largest market, with a share of about 30%, followed by Asia, and Europe, both having a share of about 50 percent.
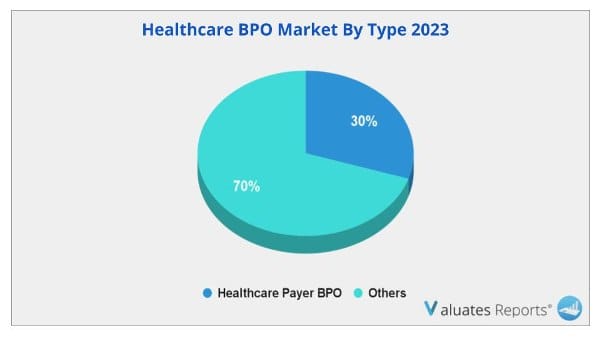
In terms of product, Healthcare Provider BPO is the largest segment, with a share of over 30%.
| Report Metric | Details |
| Report Name | Healthcare BPO Market |
| The market size in 2022 | USD 211220 Million |
| The revenue forecast in 2029 | USD 346500 Million |
| Growth Rate | Compound Annual Growth Rate (CAGR) of 8.6% from 2023 to 2029 |
| Market size available for years | 2023-2029 |
| Forecast units | Value (USD) |
| Segments covered | Type, Application & Regions |
| Report coverage | Revenue & volume forecast, company share, competitive landscape, growth factors, and trends |
| Geographic regions covered | North America, Europe, Asia Pacific, Latin America, Middle East & Africa |
Ans. The global Healthcare BPO market was valued at US$ 211220 million in 2022 and is anticipated to reach US$ 346500 million by 2029, witnessing a CAGR of 8.6% during the forecast period 2023-2029.
Ans. The global Healthcare BPO market is expected to grow at a compound annual growth rate of 8.6% from 2023 to 2029.
Ans. Some of the major companies are Quintiles, HCL, Cognizant, Covance, Accenture, Inventiv, Catalent, Parexel, Lonza, Boehringer Ingelheim, Charles Rivers, Genpact, Sutherland, PremierBPO, Firstsource, PPD, GeBBS Healthcare, Indian Healthcare BPO.
1 Report Overview
1.1 Study Scope
1.2 Market Analysis by Type
1.2.1 Global Healthcare BPO Market Size Growth Rate by Type: 2018 VS 2022 VS 2029
1.2.2 Healthcare Payer BPO
1.2.3 Healthcare Provider BPO
1.2.4 Healthcare Pharmaceutical BPO
1.3 Market by Application
1.3.1 Global Healthcare BPO Market Growth by Application: 2018 VS 2022 VS 2029
1.3.2 Research and Development
1.3.3 Manufacturing
1.3.4 Non-Clinical Services
1.4 Study Objectives
1.5 Years Considered
1.6 Years Considered
2 Global Growth Trends
2.1 Global Healthcare BPO Market Perspective (2018-2029)
2.2 Healthcare BPO Growth Trends by Region
2.2.1 Global Healthcare BPO Market Size by Region: 2018 VS 2022 VS 2029
2.2.2 Healthcare BPO Historic Market Size by Region (2018-2023)
2.2.3 Healthcare BPO Forecasted Market Size by Region (2024-2029)
2.3 Healthcare BPO Market Dynamics
2.3.1 Healthcare BPO Industry Trends
2.3.2 Healthcare BPO Market Drivers
2.3.3 Healthcare BPO Market Challenges
2.3.4 Healthcare BPO Market Restraints
3 Competition Landscape by Key Players
3.1 Global Top Healthcare BPO Players by Revenue
3.1.1 Global Top Healthcare BPO Players by Revenue (2018-2023)
3.1.2 Global Healthcare BPO Revenue Market Share by Players (2018-2023)
3.2 Global Healthcare BPO Market Share by Company Type (Tier 1, Tier 2, and Tier 3)
3.3 Players Covered: Ranking by Healthcare BPO Revenue
3.4 Global Healthcare BPO Market Concentration Ratio
3.4.1 Global Healthcare BPO Market Concentration Ratio (CR5 and HHI)
3.4.2 Global Top 10 and Top 5 Companies by Healthcare BPO Revenue in 2022
3.5 Healthcare BPO Key Players Head office and Area Served
3.6 Key Players Healthcare BPO Product Solution and Service
3.7 Date of Enter into Healthcare BPO Market
3.8 Mergers & Acquisitions, Expansion Plans
4 Healthcare BPO Breakdown Data by Type
4.1 Global Healthcare BPO Historic Market Size by Type (2018-2023)
4.2 Global Healthcare BPO Forecasted Market Size by Type (2024-2029)
5 Healthcare BPO Breakdown Data by Application
5.1 Global Healthcare BPO Historic Market Size by Application (2018-2023)
5.2 Global Healthcare BPO Forecasted Market Size by Application (2024-2029)
6 North America
6.1 North America Healthcare BPO Market Size (2018-2029)
6.2 North America Healthcare BPO Market Growth Rate by Country: 2018 VS 2022 VS 2029
6.3 North America Healthcare BPO Market Size by Country (2018-2023)
6.4 North America Healthcare BPO Market Size by Country (2024-2029)
6.5 United States
6.6 Canada
7 Europe
7.1 Europe Healthcare BPO Market Size (2018-2029)
7.2 Europe Healthcare BPO Market Growth Rate by Country: 2018 VS 2022 VS 2029
7.3 Europe Healthcare BPO Market Size by Country (2018-2023)
7.4 Europe Healthcare BPO Market Size by Country (2024-2029)
7.5 Germany
7.6 France
7.7 U.K.
7.8 Italy
7.9 Russia
7.10 Nordic Countries
8 Asia-Pacific
8.1 Asia-Pacific Healthcare BPO Market Size (2018-2029)
8.2 Asia-Pacific Healthcare BPO Market Growth Rate by Region: 2018 VS 2022 VS 2029
8.3 Asia-Pacific Healthcare BPO Market Size by Region (2018-2023)
8.4 Asia-Pacific Healthcare BPO Market Size by Region (2024-2029)
8.5 China
8.6 Japan
8.7 South Korea
8.8 Southeast Asia
8.9 India
8.10 Australia
9 Latin America
9.1 Latin America Healthcare BPO Market Size (2018-2029)
9.2 Latin America Healthcare BPO Market Growth Rate by Country: 2018 VS 2022 VS 2029
9.3 Latin America Healthcare BPO Market Size by Country (2018-2023)
9.4 Latin America Healthcare BPO Market Size by Country (2024-2029)
9.5 Mexico
9.6 Brazil
10 Middle East & Africa
10.1 Middle East & Africa Healthcare BPO Market Size (2018-2029)
10.2 Middle East & Africa Healthcare BPO Market Growth Rate by Country: 2018 VS 2022 VS 2029
10.3 Middle East & Africa Healthcare BPO Market Size by Country (2018-2023)
10.4 Middle East & Africa Healthcare BPO Market Size by Country (2024-2029)
10.5 Turkey
10.6 Saudi Arabia
10.7 UAE
11 Key Players Profiles
11.1 Quintiles
11.1.1 Quintiles Company Detail
11.1.2 Quintiles Business Overview
11.1.3 Quintiles Healthcare BPO Introduction
11.1.4 Quintiles Revenue in Healthcare BPO Business (2018-2023)
11.1.5 Quintiles Recent Development
11.2 HCL
11.2.1 HCL Company Detail
11.2.2 HCL Business Overview
11.2.3 HCL Healthcare BPO Introduction
11.2.4 HCL Revenue in Healthcare BPO Business (2018-2023)
11.2.5 HCL Recent Development
11.3 Cognizant
11.3.1 Cognizant Company Detail
11.3.2 Cognizant Business Overview
11.3.3 Cognizant Healthcare BPO Introduction
11.3.4 Cognizant Revenue in Healthcare BPO Business (2018-2023)
11.3.5 Cognizant Recent Development
11.4 Covance
11.4.1 Covance Company Detail
11.4.2 Covance Business Overview
11.4.3 Covance Healthcare BPO Introduction
11.4.4 Covance Revenue in Healthcare BPO Business (2018-2023)
11.4.5 Covance Recent Development
11.5 Accenture
11.5.1 Accenture Company Detail
11.5.2 Accenture Business Overview
11.5.3 Accenture Healthcare BPO Introduction
11.5.4 Accenture Revenue in Healthcare BPO Business (2018-2023)
11.5.5 Accenture Recent Development
11.6 Inventiv
11.6.1 Inventiv Company Detail
11.6.2 Inventiv Business Overview
11.6.3 Inventiv Healthcare BPO Introduction
11.6.4 Inventiv Revenue in Healthcare BPO Business (2018-2023)
11.6.5 Inventiv Recent Development
11.7 Catalent
11.7.1 Catalent Company Detail
11.7.2 Catalent Business Overview
11.7.3 Catalent Healthcare BPO Introduction
11.7.4 Catalent Revenue in Healthcare BPO Business (2018-2023)
11.7.5 Catalent Recent Development
11.8 Parexel
11.8.1 Parexel Company Detail
11.8.2 Parexel Business Overview
11.8.3 Parexel Healthcare BPO Introduction
11.8.4 Parexel Revenue in Healthcare BPO Business (2018-2023)
11.8.5 Parexel Recent Development
11.9 Lonza
11.9.1 Lonza Company Detail
11.9.2 Lonza Business Overview
11.9.3 Lonza Healthcare BPO Introduction
11.9.4 Lonza Revenue in Healthcare BPO Business (2018-2023)
11.9.5 Lonza Recent Development
11.10 Boehringer Ingelheim
11.10.1 Boehringer Ingelheim Company Detail
11.10.2 Boehringer Ingelheim Business Overview
11.10.3 Boehringer Ingelheim Healthcare BPO Introduction
11.10.4 Boehringer Ingelheim Revenue in Healthcare BPO Business (2018-2023)
11.10.5 Boehringer Ingelheim Recent Development
11.11 Charles Rivers
11.11.1 Charles Rivers Company Detail
11.11.2 Charles Rivers Business Overview
11.11.3 Charles Rivers Healthcare BPO Introduction
11.11.4 Charles Rivers Revenue in Healthcare BPO Business (2018-2023)
11.11.5 Charles Rivers Recent Development
11.12 Genpact
11.12.1 Genpact Company Detail
11.12.2 Genpact Business Overview
11.12.3 Genpact Healthcare BPO Introduction
11.12.4 Genpact Revenue in Healthcare BPO Business (2018-2023)
11.12.5 Genpact Recent Development
11.13 Sutherland
11.13.1 Sutherland Company Detail
11.13.2 Sutherland Business Overview
11.13.3 Sutherland Healthcare BPO Introduction
11.13.4 Sutherland Revenue in Healthcare BPO Business (2018-2023)
11.13.5 Sutherland Recent Development
11.14 PremierBPO
11.14.1 PremierBPO Company Detail
11.14.2 PremierBPO Business Overview
11.14.3 PremierBPO Healthcare BPO Introduction
11.14.4 PremierBPO Revenue in Healthcare BPO Business (2018-2023)
11.14.5 PremierBPO Recent Development
11.15 Firstsource
11.15.1 Firstsource Company Detail
11.15.2 Firstsource Business Overview
11.15.3 Firstsource Healthcare BPO Introduction
11.15.4 Firstsource Revenue in Healthcare BPO Business (2018-2023)
11.15.5 Firstsource Recent Development
11.16 PPD
11.16.1 PPD Company Detail
11.16.2 PPD Business Overview
11.16.3 PPD Healthcare BPO Introduction
11.16.4 PPD Revenue in Healthcare BPO Business (2018-2023)
11.16.5 PPD Recent Development
11.17 GeBBS Healthcare
11.17.1 GeBBS Healthcare Company Detail
11.17.2 GeBBS Healthcare Business Overview
11.17.3 GeBBS Healthcare Healthcare BPO Introduction
11.17.4 GeBBS Healthcare Revenue in Healthcare BPO Business (2018-2023)
11.17.5 GeBBS Healthcare Recent Development
11.18 Indian Healthcare BPO
11.18.1 Indian Healthcare BPO Company Detail
11.18.2 Indian Healthcare BPO Business Overview
11.18.3 Indian Healthcare BPO Healthcare BPO Introduction
11.18.4 Indian Healthcare BPO Revenue in Healthcare BPO Business (2018-2023)
11.18.5 Indian Healthcare BPO Recent Development
12 Analyst's Viewpoints/Conclusions
13 Appendix
13.1 Research Methodology
13.1.1 Methodology/Research Approach
13.1.2 Data Source
13.2 Disclaimer
List of Tables
Table 1. Global Healthcare BPO Market Size Growth Rate by Type (US$ Million): 2018 VS 2022 VS 2029
Table 2. Key Players of Healthcare Payer BPO
Table 3. Key Players of Healthcare Provider BPO
Table 4. Key Players of Healthcare Pharmaceutical BPO
Table 5. Global Healthcare BPO Market Size Growth by Application (US$ Million): 2018 VS 2022 VS 2029
Table 6. Global Healthcare BPO Market Size by Region (US$ Million): 2018 VS 2022 VS 2029
Table 7. Global Healthcare BPO Market Size by Region (2018-2023) & (US$ Million)
Table 8. Global Healthcare BPO Market Share by Region (2018-2023)
Table 9. Global Healthcare BPO Forecasted Market Size by Region (2024-2029) & (US$ Million)
Table 10. Global Healthcare BPO Market Share by Region (2024-2029)
Table 11. Healthcare BPO Market Trends
Table 12. Healthcare BPO Market Drivers
Table 13. Healthcare BPO Market Challenges
Table 14. Healthcare BPO Market Restraints
Table 15. Global Healthcare BPO Revenue by Players (2018-2023) & (US$ Million)
Table 16. Global Healthcare BPO Market Share by Players (2018-2023)
Table 17. Global Top Healthcare BPO Players by Company Type (Tier 1, Tier 2, and Tier 3) & (based on the Revenue in Healthcare BPO as of 2022)
Table 18. Ranking of Global Top Healthcare BPO Companies by Revenue (US$ Million) in 2022
Table 19. Global 5 Largest Players Market Share by Healthcare BPO Revenue (CR5 and HHI) & (2018-2023)
Table 20. Key Players Headquarters and Area Served
Table 21. Key Players Healthcare BPO Product Solution and Service
Table 22. Date of Enter into Healthcare BPO Market
Table 23. Mergers & Acquisitions, Expansion Plans
Table 24. Global Healthcare BPO Market Size by Type (2018-2023) & (US$ Million)
Table 25. Global Healthcare BPO Revenue Market Share by Type (2018-2023)
Table 26. Global Healthcare BPO Forecasted Market Size by Type (2024-2029) & (US$ Million)
Table 27. Global Healthcare BPO Revenue Market Share by Type (2024-2029)
Table 28. Global Healthcare BPO Market Size by Application (2018-2023) & (US$ Million)
Table 29. Global Healthcare BPO Revenue Market Share by Application (2018-2023)
Table 30. Global Healthcare BPO Forecasted Market Size by Application (2024-2029) & (US$ Million)
Table 31. Global Healthcare BPO Revenue Market Share by Application (2024-2029)
Table 32. North America Healthcare BPO Market Size Growth Rate by Country (US$ Million): 2018 VS 2022 VS 2029
Table 33. North America Healthcare BPO Market Size by Country (2018-2023) & (US$ Million)
Table 34. North America Healthcare BPO Market Size by Country (2024-2029) & (US$ Million)
Table 35. Europe Healthcare BPO Market Size Growth Rate by Country (US$ Million): 2018 VS 2022 VS 2029
Table 36. Europe Healthcare BPO Market Size by Country (2018-2023) & (US$ Million)
Table 37. Europe Healthcare BPO Market Size by Country (2024-2029) & (US$ Million)
Table 38. Asia-Pacific Healthcare BPO Market Size Growth Rate by Region (US$ Million): 2018 VS 2022 VS 2029
Table 39. Asia-Pacific Healthcare BPO Market Size by Region (2018-2023) & (US$ Million)
Table 40. Asia-Pacific Healthcare BPO Market Size by Region (2024-2029) & (US$ Million)
Table 41. Latin America Healthcare BPO Market Size Growth Rate by Country (US$ Million): 2018 VS 2022 VS 2029
Table 42. Latin America Healthcare BPO Market Size by Country (2018-2023) & (US$ Million)
Table 43. Latin America Healthcare BPO Market Size by Country (2024-2029) & (US$ Million)
Table 44. Middle East & Africa Healthcare BPO Market Size Growth Rate by Country (US$ Million): 2018 VS 2022 VS 2029
Table 45. Middle East & Africa Healthcare BPO Market Size by Country (2018-2023) & (US$ Million)
Table 46. Middle East & Africa Healthcare BPO Market Size by Country (2024-2029) & (US$ Million)
Table 47. Quintiles Company Detail
Table 48. Quintiles Business Overview
Table 49. Quintiles Healthcare BPO Product
Table 50. Quintiles Revenue in Healthcare BPO Business (2018-2023) & (US$ Million)
Table 51. Quintiles Recent Development
Table 52. HCL Company Detail
Table 53. HCL Business Overview
Table 54. HCL Healthcare BPO Product
Table 55. HCL Revenue in Healthcare BPO Business (2018-2023) & (US$ Million)
Table 56. HCL Recent Development
Table 57. Cognizant Company Detail
Table 58. Cognizant Business Overview
Table 59. Cognizant Healthcare BPO Product
Table 60. Cognizant Revenue in Healthcare BPO Business (2018-2023) & (US$ Million)
Table 61. Cognizant Recent Development
Table 62. Covance Company Detail
Table 63. Covance Business Overview
Table 64. Covance Healthcare BPO Product
Table 65. Covance Revenue in Healthcare BPO Business (2018-2023) & (US$ Million)
Table 66. Covance Recent Development
Table 67. Accenture Company Detail
Table 68. Accenture Business Overview
Table 69. Accenture Healthcare BPO Product
Table 70. Accenture Revenue in Healthcare BPO Business (2018-2023) & (US$ Million)
Table 71. Accenture Recent Development
Table 72. Inventiv Company Detail
Table 73. Inventiv Business Overview
Table 74. Inventiv Healthcare BPO Product
Table 75. Inventiv Revenue in Healthcare BPO Business (2018-2023) & (US$ Million)
Table 76. Inventiv Recent Development
Table 77. Catalent Company Detail
Table 78. Catalent Business Overview
Table 79. Catalent Healthcare BPO Product
Table 80. Catalent Revenue in Healthcare BPO Business (2018-2023) & (US$ Million)
Table 81. Catalent Recent Development
Table 82. Parexel Company Detail
Table 83. Parexel Business Overview
Table 84. Parexel Healthcare BPO Product
Table 85. Parexel Revenue in Healthcare BPO Business (2018-2023) & (US$ Million)
Table 86. Parexel Recent Development
Table 87. Lonza Company Detail
Table 88. Lonza Business Overview
Table 89. Lonza Healthcare BPO Product
Table 90. Lonza Revenue in Healthcare BPO Business (2018-2023) & (US$ Million)
Table 91. Lonza Recent Development
Table 92. Boehringer Ingelheim Company Detail
Table 93. Boehringer Ingelheim Business Overview
Table 94. Boehringer Ingelheim Healthcare BPO Product
Table 95. Boehringer Ingelheim Revenue in Healthcare BPO Business (2018-2023) & (US$ Million)
Table 96. Boehringer Ingelheim Recent Development
Table 97. Charles Rivers Company Detail
Table 98. Charles Rivers Business Overview
Table 99. Charles Rivers Healthcare BPO Product
Table 100. Charles Rivers Revenue in Healthcare BPO Business (2018-2023) & (US$ Million)
Table 101. Charles Rivers Recent Development
Table 102. Genpact Company Detail
Table 103. Genpact Business Overview
Table 104. Genpact Healthcare BPO Product
Table 105. Genpact Revenue in Healthcare BPO Business (2018-2023) & (US$ Million)
Table 106. Genpact Recent Development
Table 107. Sutherland Company Detail
Table 108. Sutherland Business Overview
Table 109. Sutherland Healthcare BPO Product
Table 110. Sutherland Revenue in Healthcare BPO Business (2018-2023) & (US$ Million)
Table 111. Sutherland Recent Development
Table 112. PremierBPO Company Detail
Table 113. PremierBPO Business Overview
Table 114. PremierBPO Healthcare BPO Product
Table 115. PremierBPO Revenue in Healthcare BPO Business (2018-2023) & (US$ Million)
Table 116. PremierBPO Recent Development
Table 117. Firstsource Company Detail
Table 118. Firstsource Business Overview
Table 119. Firstsource Healthcare BPO Product
Table 120. Firstsource Revenue in Healthcare BPO Business (2018-2023) & (US$ Million)
Table 121. Firstsource Recent Development
Table 122. PPD Company Detail
Table 123. PPD Business Overview
Table 124. PPD Healthcare BPO Product
Table 125. PPD Revenue in Healthcare BPO Business (2018-2023) & (US$ Million)
Table 126. PPD Recent Development
Table 127. GeBBS Healthcare Company Detail
Table 128. GeBBS Healthcare Business Overview
Table 129. GeBBS Healthcare Healthcare BPO Product
Table 130. GeBBS Healthcare Revenue in Healthcare BPO Business (2018-2023) & (US$ Million)
Table 131. GeBBS Healthcare Recent Development
Table 132. Indian Healthcare BPO Company Detail
Table 133. Indian Healthcare BPO Business Overview
Table 134. Indian Healthcare BPO Healthcare BPO Product
Table 135. Indian Healthcare BPO Revenue in Healthcare BPO Business (2018-2023) & (US$ Million)
Table 136. Indian Healthcare BPO Recent Development
Table 137. Research Programs/Design for This Report
Table 138. Key Data Information from Secondary Sources
Table 139. Key Data Information from Primary Sources
List of Figures
Figure 1. Global Healthcare BPO Market Size Comparison by Type (2023-2029) & (US$ Million)
Figure 2. Global Healthcare BPO Market Share by Type: 2022 VS 2029
Figure 3. Healthcare Payer BPO Features
Figure 4. Healthcare Provider BPO Features
Figure 5. Healthcare Pharmaceutical BPO Features
Figure 6. Global Healthcare BPO Market Size Comparison by Application (2023-2029) & (US$ Million)
Figure 7. Global Healthcare BPO Market Share by Application: 2022 VS 2029
Figure 8. Research and Development Case Studies
Figure 9. Manufacturing Case Studies
Figure 10. Non-Clinical Services Case Studies
Figure 11. Healthcare BPO Report Years Considered
Figure 12. Global Healthcare BPO Market Size (US$ Million), Year-over-Year: 2018-2029
Figure 13. Global Healthcare BPO Market Size, (US$ Million), 2018 VS 2022 VS 2029
Figure 14. Global Healthcare BPO Market Share by Region: 2022 VS 2029
Figure 15. Global Healthcare BPO Market Share by Players in 2022
Figure 16. Global Top Healthcare BPO Players by Company Type (Tier 1, Tier 2, and Tier 3) & (based on the Revenue in Healthcare BPO as of 2022)
Figure 17. The Top 10 and 5 Players Market Share by Healthcare BPO Revenue in 2022
Figure 18. North America Healthcare BPO Market Size YoY Growth (2018-2029) & (US$ Million)
Figure 19. North America Healthcare BPO Market Share by Country (2018-2029)
Figure 20. United States Healthcare BPO Market Size YoY Growth (2018-2029) & (US$ Million)
Figure 21. Canada Healthcare BPO Market Size YoY Growth (2018-2029) & (US$ Million)
Figure 22. Europe Healthcare BPO Market Size YoY Growth (2018-2029) & (US$ Million)
Figure 23. Europe Healthcare BPO Market Share by Country (2018-2029)
Figure 24. Germany Healthcare BPO Market Size YoY Growth (2018-2029) & (US$ Million)
Figure 25. France Healthcare BPO Market Size YoY Growth (2018-2029) & (US$ Million)
Figure 26. U.K. Healthcare BPO Market Size YoY Growth (2018-2029) & (US$ Million)
Figure 27. Italy Healthcare BPO Market Size YoY Growth (2018-2029) & (US$ Million)
Figure 28. Russia Healthcare BPO Market Size YoY Growth (2018-2029) & (US$ Million)
Figure 29. Nordic Countries Healthcare BPO Market Size YoY Growth (2018-2029) & (US$ Million)
Figure 30. Asia-Pacific Healthcare BPO Market Size YoY Growth (2018-2029) & (US$ Million)
Figure 31. Asia-Pacific Healthcare BPO Market Share by Region (2018-2029)
Figure 32. China Healthcare BPO Market Size YoY Growth (2018-2029) & (US$ Million)
Figure 33. Japan Healthcare BPO Market Size YoY Growth (2018-2029) & (US$ Million)
Figure 34. South Korea Healthcare BPO Market Size YoY Growth (2018-2029) & (US$ Million)
Figure 35. Southeast Asia Healthcare BPO Market Size YoY Growth (2018-2029) & (US$ Million)
Figure 36. India Healthcare BPO Market Size YoY Growth (2018-2029) & (US$ Million)
Figure 37. Australia Healthcare BPO Market Size YoY Growth (2018-2029) & (US$ Million)
Figure 38. Latin America Healthcare BPO Market Size YoY Growth (2018-2029) & (US$ Million)
Figure 39. Latin America Healthcare BPO Market Share by Country (2018-2029)
Figure 40. Mexico Healthcare BPO Market Size YoY Growth (2018-2029) & (US$ Million)
Figure 41. Brazil Healthcare BPO Market Size YoY Growth (2018-2029) & (US$ Million)
Figure 42. Middle East & Africa Healthcare BPO Market Size YoY Growth (2018-2029) & (US$ Million)
Figure 43. Middle East & Africa Healthcare BPO Market Share by Country (2018-2029)
Figure 44. Turkey Healthcare BPO Market Size YoY Growth (2018-2029) & (US$ Million)
Figure 45. Saudi Arabia Healthcare BPO Market Size YoY Growth (2018-2029) & (US$ Million)
Figure 46. Quintiles Revenue Growth Rate in Healthcare BPO Business (2018-2023)
Figure 47. HCL Revenue Growth Rate in Healthcare BPO Business (2018-2023)
Figure 48. Cognizant Revenue Growth Rate in Healthcare BPO Business (2018-2023)
Figure 49. Covance Revenue Growth Rate in Healthcare BPO Business (2018-2023)
Figure 50. Accenture Revenue Growth Rate in Healthcare BPO Business (2018-2023)
Figure 51. Inventiv Revenue Growth Rate in Healthcare BPO Business (2018-2023)
Figure 52. Catalent Revenue Growth Rate in Healthcare BPO Business (2018-2023)
Figure 53. Parexel Revenue Growth Rate in Healthcare BPO Business (2018-2023)
Figure 54. Lonza Revenue Growth Rate in Healthcare BPO Business (2018-2023)
Figure 55. Boehringer Ingelheim Revenue Growth Rate in Healthcare BPO Business (2018-2023)
Figure 56. Charles Rivers Revenue Growth Rate in Healthcare BPO Business (2018-2023)
Figure 57. Genpact Revenue Growth Rate in Healthcare BPO Business (2018-2023)
Figure 58. Sutherland Revenue Growth Rate in Healthcare BPO Business (2018-2023)
Figure 59. PremierBPO Revenue Growth Rate in Healthcare BPO Business (2018-2023)
Figure 60. Firstsource Revenue Growth Rate in Healthcare BPO Business (2018-2023)
Figure 61. PPD Revenue Growth Rate in Healthcare BPO Business (2018-2023)
Figure 62. GeBBS Healthcare Revenue Growth Rate in Healthcare BPO Business (2018-2023)
Figure 63. Indian Healthcare BPO Revenue Growth Rate in Healthcare BPO Business (2018-2023)
Figure 64. Bottom-up and Top-down Approaches for This Report
Figure 65. Data Triangulation
Figure 66. Key Executives Interviewed
$2900
HAVE A QUERY?
OUR CUSTOMER
SIMILAR REPORTS