List of Tables
Table 1. MMO Games Market Trends
Table 2. MMO Games Market Drivers & Opportunity
Table 3. MMO Games Market Challenges
Table 4. MMO Games Market Restraints
Table 5. Global MMO Games Revenue by Company (2019-2024) & (US$ Million)
Table 6. Global MMO Games Revenue Market Share by Company (2019-2024)
Table 7. Key Companies MMO Games Manufacturing Base Distribution and Headquarters
Table 8. Key Companies MMO Games Product Type
Table 9. Key Companies Time to Begin Mass Production of MMO Games
Table 10. Global MMO Games Companies Market Concentration Ratio (CR5 and HHI)
Table 11. Global Top Companies Market Share by Company Type (Tier 1, Tier 2, and Tier 3) & (based on the Revenue in MMO Games as of 2023)
Table 12. Mergers & Acquisitions, Expansion Plans
Table 13. Global MMO Games Sales Value by Type: 2019 VS 2023 VS 2030 (US$ Million)
Table 14. Global MMO Games Sales Value by Type (2019-2024) & (US$ Million)
Table 15. Global MMO Games Sales Value by Type (2025-2030) & (US$ Million)
Table 16. Global MMO Games Sales Market Share in Value by Type (2019-2024) & (%)
Table 17. Global MMO Games Sales Market Share in Value by Type (2025-2030) & (%)
Table 18. Global MMO Games Sales Value by Application: 2019 VS 2023 VS 2030 (US$ Million)
Table 19. Global MMO Games Sales Value by Application (2019-2024) & (US$ Million)
Table 20. Global MMO Games Sales Value by Application (2025-2030) & (US$ Million)
Table 21. Global MMO Games Sales Market Share in Value by Application (2019-2024) & (%)
Table 22. Global MMO Games Sales Market Share in Value by Application (2025-2030) & (%)
Table 23. Global MMO Games Sales Value by Region: 2019 VS 2023 VS 2030 (US$ Million)
Table 24. Global MMO Games Sales Value by Region (2019-2024) & (US$ Million)
Table 25. Global MMO Games Sales Value by Region (2025-2030) & (US$ Million)
Table 26. Global MMO Games Sales Value by Region (2019-2024) & (%)
Table 27. Global MMO Games Sales Value by Region (2025-2030) & (%)
Table 28. Key Countries/Regions MMO Games Sales Value Growth Trends, (US$ Million): 2019 VS 2023 VS 2030
Table 29. Key Countries/Regions MMO Games Sales Value, (2019-2024) & (US$ Million)
Table 30. Key Countries/Regions MMO Games Sales Value, (2025-2030) & (US$ Million)
Table 31. Tencent Basic Information List
Table 32. Tencent Description and Business Overview
Table 33. Tencent MMO Games Products, Services and Solutions
Table 34. Revenue (US$ Million) in MMO Games Business of Tencent (2019-2024)
Table 35. Tencent Recent Developments
Table 36. NetEase Basic Information List
Table 37. NetEase Description and Business Overview
Table 38. NetEase MMO Games Products, Services and Solutions
Table 39. Revenue (US$ Million) in MMO Games Business of NetEase (2019-2024)
Table 40. NetEase Recent Developments
Table 41. Activision Blizzard(Microsoft) Basic Information List
Table 42. Activision Blizzard(Microsoft) Description and Business Overview
Table 43. Activision Blizzard(Microsoft) MMO Games Products, Services and Solutions
Table 44. Revenue (US$ Million) in MMO Games Business of Activision Blizzard(Microsoft) (2019-2024)
Table 45. Activision Blizzard(Microsoft) Recent Developments
Table 46. Supercell Basic Information List
Table 47. Supercell Description and Business Overview
Table 48. Supercell MMO Games Products, Services and Solutions
Table 49. Revenue (US$ Million) in MMO Games Business of Supercell (2019-2024)
Table 50. Supercell Recent Developments
Table 51. NEXON Basic Information List
Table 52. NEXON Description and Business Overview
Table 53. NEXON MMO Games Products, Services and Solutions
Table 54. Revenue (US$ Million) in MMO Games Business of NEXON (2019-2024)
Table 55. NEXON Recent Developments
Table 56. NCSoft Basic Information List
Table 57. NCSoft Description and Business Overview
Table 58. NCSoft MMO Games Products, Services and Solutions
Table 59. Revenue (US$ Million) in MMO Games Business of NCSoft (2019-2024)
Table 60. NCSoft Recent Developments
Table 61. Electronic Arts Basic Information List
Table 62. Electronic Arts Description and Business Overview
Table 63. Electronic Arts MMO Games Products, Services and Solutions
Table 64. Revenue (US$ Million) in MMO Games Business of Electronic Arts (2019-2024)
Table 65. Electronic Arts Recent Developments
Table 66. Bluehole Basic Information List
Table 67. Bluehole Description and Business Overview
Table 68. Bluehole MMO Games Products, Services and Solutions
Table 69. Revenue (US$ Million) in MMO Games Business of Bluehole (2019-2024)
Table 70. Bluehole Recent Developments
Table 71. Mixi Inc. Basic Information List
Table 72. Mixi Inc. Description and Business Overview
Table 73. Mixi Inc. MMO Games Products, Services and Solutions
Table 74. Revenue (US$ Million) in MMO Games Business of Mixi Inc. (2019-2024)
Table 75. Mixi Inc. Recent Developments
Table 76. SQUARE ENIX Basic Information List
Table 77. SQUARE ENIX Description and Business Overview
Table 78. SQUARE ENIX MMO Games Products, Services and Solutions
Table 79. Revenue (US$ Million) in MMO Games Business of SQUARE ENIX (2019-2024)
Table 80. SQUARE ENIX Recent Developments
Table 81. ChangYou Basic Information List
Table 82. ChangYou Description and Business Overview
Table 83. ChangYou MMO Games Products, Services and Solutions
Table 84. Revenue (US$ Million) in MMO Games Business of ChangYou (2019-2024)
Table 85. ChangYou Recent Developments
Table 86. Shanda Interactive Entertainment Basic Information List
Table 87. Shanda Interactive Entertainment Description and Business Overview
Table 88. Shanda Interactive Entertainment MMO Games Products, Services and Solutions
Table 89. Revenue (US$ Million) in MMO Games Business of Shanda Interactive Entertainment (2019-2024)
Table 90. Shanda Interactive Entertainment Recent Developments
Table 91. GungHo Online Entertainment Basic Information List
Table 92. GungHo Online Entertainment Description and Business Overview
Table 93. GungHo Online Entertainment MMO Games Products, Services and Solutions
Table 94. Revenue (US$ Million) in MMO Games Business of GungHo Online Entertainment (2019-2024)
Table 95. GungHo Online Entertainment Recent Developments
Table 96. Daybreak Game Company Basic Information List
Table 97. Daybreak Game Company Description and Business Overview
Table 98. Daybreak Game Company MMO Games Products, Services and Solutions
Table 99. Revenue (US$ Million) in MMO Games Business of Daybreak Game Company (2019-2024)
Table 100. Daybreak Game Company Recent Developments
Table 101. Gamigo Basic Information List
Table 102. Gamigo Description and Business Overview
Table 103. Gamigo MMO Games Products, Services and Solutions
Table 104. Revenue (US$ Million) in MMO Games Business of Gamigo (2019-2024)
Table 105. Gamigo Recent Developments
Table 106. Jagex Games Studio Basic Information List
Table 107. Jagex Games Studio Description and Business Overview
Table 108. Jagex Games Studio MMO Games Products, Services and Solutions
Table 109. Revenue (US$ Million) in MMO Games Business of Jagex Games Studio (2019-2024)
Table 110. Jagex Games Studio Recent Developments
Table 111. Ankama Basic Information List
Table 112. Ankama Description and Business Overview
Table 113. Ankama MMO Games Products, Services and Solutions
Table 114. Revenue (US$ Million) in MMO Games Business of Ankama (2019-2024)
Table 115. Ankama Recent Developments
Table 116. Sony Online Entertainment Basic Information List
Table 117. Sony Online Entertainment Description and Business Overview
Table 118. Sony Online Entertainment MMO Games Products, Services and Solutions
Table 119. Revenue (US$ Million) in MMO Games Business of Sony Online Entertainment (2019-2024)
Table 120. Sony Online Entertainment Recent Developments
Table 121. Ubisoft Entertainment SA Basic Information List
Table 122. Ubisoft Entertainment SA Description and Business Overview
Table 123. Ubisoft Entertainment SA MMO Games Products, Services and Solutions
Table 124. Revenue (US$ Million) in MMO Games Business of Ubisoft Entertainment SA (2019-2024)
Table 125. Ubisoft Entertainment SA Recent Developments
Table 126. Riot Games Basic Information List
Table 127. Riot Games Description and Business Overview
Table 128. Riot Games MMO Games Products, Services and Solutions
Table 129. Revenue (US$ Million) in MMO Games Business of Riot Games (2019-2024)
Table 130. Riot Games Recent Developments
Table 131. Valve Corporation Basic Information List
Table 132. Valve Corporation Description and Business Overview
Table 133. Valve Corporation MMO Games Products, Services and Solutions
Table 134. Revenue (US$ Million) in MMO Games Business of Valve Corporation (2019-2024)
Table 135. Valve Corporation Recent Developments
Table 136. Wargaming.net Basic Information List
Table 137. Wargaming.net Description and Business Overview
Table 138. Wargaming.net MMO Games Products, Services and Solutions
Table 139. Revenue (US$ Million) in MMO Games Business of Wargaming.net (2019-2024)
Table 140. Wargaming.net Recent Developments
Table 141. Perfect World Entertainment Basic Information List
Table 142. Perfect World Entertainment Description and Business Overview
Table 143. Perfect World Entertainment MMO Games Products, Services and Solutions
Table 144. Revenue (US$ Million) in MMO Games Business of Perfect World Entertainment (2019-2024)
Table 145. Perfect World Entertainment Recent Developments
Table 146. Zhejiang Century Huatong Group CO.,LTD. Basic Information List
Table 147. Zhejiang Century Huatong Group CO.,LTD. Description and Business Overview
Table 148. Zhejiang Century Huatong Group CO.,LTD. MMO Games Products, Services and Solutions
Table 149. Revenue (US$ Million) in MMO Games Business of Zhejiang Century Huatong Group CO.,LTD. (2019-2024)
Table 150. Zhejiang Century Huatong Group CO.,LTD. Recent Developments
Table 151. 37 Interactive Entertainment (Shanghai)Technology Co., Ltd. Basic Information List
Table 152. 37 Interactive Entertainment (Shanghai)Technology Co., Ltd. Description and Business Overview
Table 153. 37 Interactive Entertainment (Shanghai)Technology Co., Ltd. MMO Games Products, Services and Solutions
Table 154. Revenue (US$ Million) in MMO Games Business of 37 Interactive Entertainment (Shanghai)Technology Co., Ltd. (2019-2024)
Table 155. 37 Interactive Entertainment (Shanghai)Technology Co., Ltd. Recent Developments
Table 156. HoYoverse Basic Information List
Table 157. HoYoverse Description and Business Overview
Table 158. HoYoverse MMO Games Products, Services and Solutions
Table 159. Revenue (US$ Million) in MMO Games Business of HoYoverse (2019-2024)
Table 160. HoYoverse Recent Developments
Table 161. Key Raw Materials Lists
Table 162. Raw Materials Key Suppliers Lists
Table 163. MMO Games Downstream Customers
Table 164. MMO Games Distributors List
Table 165. Research Programs/Design for This Report
Table 166. Key Data Information from Secondary Sources
Table 167. Key Data Information from Primary Sources
Table 168. Business Unit and Senior & Team Lead Analysts
List of Figures
Figure 1. MMO Games Product Picture
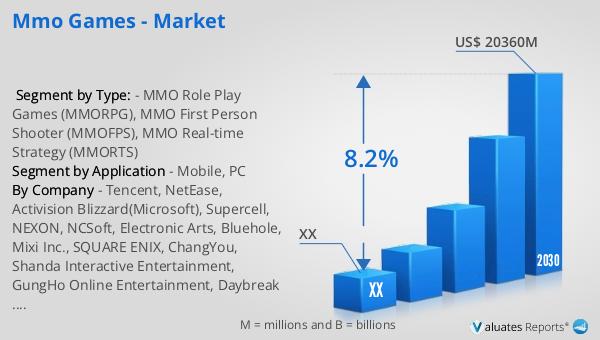
Figure 2. Global MMO Games Sales Value, 2019 VS 2023 VS 2030 (US$ Million)
Figure 3. Global MMO Games Sales Value (2019-2030) & (US$ Million)
Figure 4. MMO Games Report Years Considered
Figure 5. Global MMO Games Players Revenue Ranking (2023) & (US$ Million)
Figure 6. The 5 and 10 Largest Manufacturers in the World: Market Share by MMO Games Revenue in 2023
Figure 7. MMO Games Market Share by Company Type (Tier 1, Tier 2, and Tier 3): 2019 VS 2023
Figure 8. MMO Role Play Games (MMORPG) Picture
Figure 9. MMO First Person Shooter (MMOFPS) Picture
Figure 10. MMO Real-time Strategy (MMORTS) Picture
Figure 11. Global MMO Games Sales Value by Type (2019 VS 2023 VS 2030) & (US$ Million)
Figure 12. Global MMO Games Sales Value Market Share by Type, 2023 & 2030
Figure 13. Product Picture of Mobile
Figure 14. Product Picture of PC
Figure 15. Global MMO Games Sales Value by Application (2019 VS 2023 VS 2030) & (US$ Million)
Figure 16. Global MMO Games Sales Value Market Share by Application, 2023 & 2030
Figure 17. North America MMO Games Sales Value (2019-2030) & (US$ Million)
Figure 18. North America MMO Games Sales Value by Country (%), 2023 VS 2030
Figure 19. Europe MMO Games Sales Value (2019-2030) & (US$ Million)
Figure 20. Europe MMO Games Sales Value by Country (%), 2023 VS 2030
Figure 21. Asia Pacific MMO Games Sales Value (2019-2030) & (US$ Million)
Figure 22. Asia Pacific MMO Games Sales Value by Country (%), 2023 VS 2030
Figure 23. South America MMO Games Sales Value (2019-2030) & (US$ Million)
Figure 24. South America MMO Games Sales Value by Country (%), 2023 VS 2030
Figure 25. Middle East & Africa MMO Games Sales Value (2019-2030) & (US$ Million)
Figure 26. Middle East & Africa MMO Games Sales Value by Country (%), 2023 VS 2030
Figure 27. Key Countries/Regions MMO Games Sales Value (%), (2019-2030)
Figure 28. United States MMO Games Sales Value, (2019-2030) & (US$ Million)
Figure 29. United States MMO Games Sales Value by Type (%), 2023 VS 2030
Figure 30. United States MMO Games Sales Value by Application (%), 2023 VS 2030
Figure 31. Europe MMO Games Sales Value, (2019-2030) & (US$ Million)
Figure 32. Europe MMO Games Sales Value by Type (%), 2023 VS 2030
Figure 33. Europe MMO Games Sales Value by Application (%), 2023 VS 2030
Figure 34. China MMO Games Sales Value, (2019-2030) & (US$ Million)
Figure 35. China MMO Games Sales Value by Type (%), 2023 VS 2030
Figure 36. China MMO Games Sales Value by Application (%), 2023 VS 2030
Figure 37. Japan MMO Games Sales Value, (2019-2030) & (US$ Million)
Figure 38. Japan MMO Games Sales Value by Type (%), 2023 VS 2030
Figure 39. Japan MMO Games Sales Value by Application (%), 2023 VS 2030
Figure 40. South Korea MMO Games Sales Value, (2019-2030) & (US$ Million)
Figure 41. South Korea MMO Games Sales Value by Type (%), 2023 VS 2030
Figure 42. South Korea MMO Games Sales Value by Application (%), 2023 VS 2030
Figure 43. Southeast Asia MMO Games Sales Value, (2019-2030) & (US$ Million)
Figure 44. Southeast Asia MMO Games Sales Value by Type (%), 2023 VS 2030
Figure 45. Southeast Asia MMO Games Sales Value by Application (%), 2023 VS 2030
Figure 46. India MMO Games Sales Value, (2019-2030) & (US$ Million)
Figure 47. India MMO Games Sales Value by Type (%), 2023 VS 2030
Figure 48. India MMO Games Sales Value by Application (%), 2023 VS 2030
Figure 49. MMO Games Industrial Chain
Figure 50. MMO Games Manufacturing Cost Structure
Figure 51. Channels of Distribution (Direct Sales, and Distribution)
Figure 52. Bottom-up and Top-down Approaches for This Report
Figure 53. Data Triangulation