0
U.S. (TOLL FREE)
+1 (315) 215-3225
Automative

0
U.S. (TOLL FREE)
+1 (315) 215-3225
Global Licensed Merchandise Market Research Report 2024
Published Date: January 2024
|
Report Code: QYRE-Auto-36N9082
Home | Market Reports | Shopping
Global Licensed Merchandise Market Size Status and Forecast 2022
BUY CHAPTERS

Global Licensed Merchandise Market Research Report 2024

Code: QYRE-Auto-36N9082
Report
January 2024
Pages:105
QYResearch
Buy Now with 15% Discount
DESCRIPTION
TABLE OF CONTENT
TABLES & FIGURES

Licensed Merchandise Market Size

The global Licensed Merchandise market was valued at US$ 275940 million in 2023 and is anticipated to reach US$ 382760 million by 2030, witnessing a CAGR of 4.3% during the forecast period 2024-2030.

Licensed Merchandise Market

Licensed Merchandise Market

Licensing means renting or leasing of an intangible asset. It is a process of creating and managing contracts between the owner of a brand and a company or individual who wants to use the brand in association with a product, for an agreed period of time, within an agreed territory. Licensing is used by brand owners to extend a trademark or character onto products of a completely different nature. In a Licensed Merchandise transaction, an artist, designer, trademark owner or celebrity (the "licensor") grants a license to a manufacturer or retailer (the "licensee") to manufacture and sell articles of merchandise which use the property that is the subject of the license, in exchange for a royalty from sales of those articles of merchandise. Typical licensed properties include artwork, characters, trademarks, celebrity names and likenesses, and book and movie titles. Licensed merchandise may include clothing, greeting cards, toys, games, housewares, jewellery, dinnerware, cosmetics and collectibles.
Global key players of licensed merchandise include The Walt Disney Company, Meredith Corporation, PVH Corp., Authentic Brands Group, WarnerMedia, etc. The top five players hold a share about 46%. Service providers are mainly located in Europe, North America and Japan, they occupied for a share over 72%. North America is the largest market, has a share about 58%, followed by Europe and Asia-Pacific, with share 22% and 14%, separately.
This report aims to provide a comprehensive presentation of the global market for Licensed Merchandise, with both quantitative and qualitative analysis, to help readers develop business/growth strategies, assess the market competitive situation, analyze their position in the current marketplace, and make informed business decisions regarding Licensed Merchandise.

Report Scope

The Licensed Merchandise market size, estimations, and forecasts are provided in terms of revenue ($ millions), considering 2023 as the base year, with history and forecast data for the period from 2019 to 2030. This report segments the global Licensed Merchandise market comprehensively. Regional market sizes, concerning products by Type, by Application, and by players, are also provided.
For a more in-depth understanding of the market, the report provides profiles of the competitive landscape, key competitors, and their respective market ranks. The report also discusses technological trends and new product developments.
The report will help the Licensed Merchandise companies, new entrants, and industry chain related companies in this market with information on the revenues, sales volume, and average price for the overall market and the sub-segments across the different segments, by company, by Type, by Application, and by regions.
Market Segmentation

Scope of Licensed Merchandise Market Report

Report Metric Details
Report Name Licensed Merchandise Market
Accounted market size in 2023 US$ 275940 million
Forecasted market size in 2030 US$ 382760 million
CAGR 4.3%
Base Year 2023
Forecasted years 2024 - 2030
Segment by Type
  • Apparels
  • Toys
  • Accessories
  • Home Decoration
  • Software/Video Games
  • Food and Beverage
  • Others
Segment by Application
  • Entertainment
  • Corporate Trademarks/Brand
  • Fashion
  • Sports
  • Others
By Region
  • North America (United States, Canada)
  • Europe (Germany, France, UK, Italy, Russia) Rest of Europe
  • Nordic Countries
  • Asia-Pacific (China, Japan, South Korea)
  • Southeast Asia (India, Australia)
  • Rest of Asia
  • Latin America (Mexico, Brazil)
  • Rest of Latin America
  • Middle East & Africa (Turkey, Saudi Arabia, UAE, Rest of MEA)
By Company The Walt Disney Company, Meredith Corporation, PVH Corp., Iconix Brand Group, Authentic Brands Group, Universal Brand Development, Nickelodeon (ViacomCBS), Major League Baseball, Learfield IMG College, Sanrio, Sequential Brands Group, Hasbro, General Motors, National Basketball Association, Electrolux, National Football League, WarnerMedia, The Pokémon Company International, Procter & Gamble, Ferrari, Ralph Lauren, Mattel, Ford Motor Company, BBC Worldwide, The Hershey Company, Stanley Black & Decker, PGA Tour, National Hockey League, Sunkist Growers, WWE
Forecast units USD million in value
Report coverage Revenue and volume forecast, company share, competitive landscape, growth factors and trends

Chapter Outline

  • Chapter 1: Introduces the report scope of the report, executive summary of different market segments (by Type, by Application, etc), including the market size of each market segment, future development potential, and so on. It offers a high-level view of the current state of the market and its likely evolution in the short to mid-term, and long term.
  • Chapter 2: Introduces executive summary of global market size, regional market size, this section also introduces the market dynamics, latest developments of the market, the driving factors and restrictive factors of the market, the challenges and risks faced by companies in the industry, and the analysis of relevant policies in the industry.
  • Chapter 3: Detailed analysis of Licensed Merchandise companies’ competitive landscape, revenue market share, latest development plan, merger, and acquisition information, etc.
  • Chapter 4: Provides the analysis of various market segments by Type, covering the market size and development potential of each market segment, to help readers find the blue ocean market in different market segments.
  • Chapter 5: Provides the analysis of various market segments by Application, covering the market size and development potential of each market segment, to help readers find the blue ocean market in different downstream markets.
  • Chapter 6, 7, 8, 9, 10: North America, Europe, Asia Pacific, Latin America, Middle East and Africa segment by country. It provides a quantitative analysis of the market size and development potential of each region and its main countries and introduces the market development, future development prospects, market space, and capacity of each country in the world.
  • Chapter 11: Provides profiles of key players, introducing the basic situation of the main companies in the market in detail, including product sales, revenue, price, gross margin, product introduction, recent development, etc.
  • Chapter 12: The main points and conclusions of the report.

FAQ for this report

How fast is Licensed Merchandise Market growing?

Ans: The Licensed Merchandise Market witnessing a CAGR of 4.3% during the forecast period 2024-2030.

What is the Licensed Merchandise Market size in 2030?

Ans: The Licensed Merchandise Market size in 2030 will be US$ 382760 million.

What is the market share of major companies in Licensed Merchandise Market?

Ans: The top five players hold a share about 46%.

What is the Licensed Merchandise Market share by region?

Ans: North America is the largest market, has a share about 58%, followed by Europe and Asia-Pacific, with share 22% and 14%, separately.

Who are the main players in the Licensed Merchandise Market report?

Ans: The main players in the Licensed Merchandise Market are The Walt Disney Company, Meredith Corporation, PVH Corp., Iconix Brand Group, Authentic Brands Group, Universal Brand Development, Nickelodeon (ViacomCBS), Major League Baseball, Learfield IMG College, Sanrio, Sequential Brands Group, Hasbro, General Motors, National Basketball Association, Electrolux, National Football League, WarnerMedia, The Pokémon Company International, Procter & Gamble, Ferrari, Ralph Lauren, Mattel, Ford Motor Company, BBC Worldwide, The Hershey Company, Stanley Black & Decker, PGA Tour, National Hockey League, Sunkist Growers, WWE

What are the Application segmentation covered in the Licensed Merchandise Market report?

Ans: The Applications covered in the Licensed Merchandise Market report are Entertainment, Corporate Trademarks/Brand, Fashion, Sports, Others

What are the Type segmentation covered in the Licensed Merchandise Market report?

Ans: The Types covered in the Licensed Merchandise Market report are Apparels, Toys, Accessories, Home Decoration, Software/Video Games, Food and Beverage, Others

1 Report Overview
1.1 Study Scope
1.2 Market Analysis by Type
1.2.1 Global Licensed Merchandise Market Size Growth Rate by Type: 2019 VS 2023 VS 2030
1.2.2 Apparels
1.2.3 Toys
1.2.4 Accessories
1.2.5 Home Decoration
1.2.6 Software/Video Games
1.2.7 Food and Beverage
1.2.8 Others
1.3 Market by Application
1.3.1 Global Licensed Merchandise Market Growth by Application: 2019 VS 2023 VS 2030
1.3.2 Entertainment
1.3.3 Corporate Trademarks/Brand
1.3.4 Fashion
1.3.5 Sports
1.3.6 Others
1.4 Study Objectives
1.5 Years Considered
1.6 Years Considered
2 Global Growth Trends
2.1 Global Licensed Merchandise Market Perspective (2019-2030)
2.2 Licensed Merchandise Growth Trends by Region
2.2.1 Global Licensed Merchandise Market Size by Region: 2019 VS 2023 VS 2030
2.2.2 Licensed Merchandise Historic Market Size by Region (2019-2024)
2.2.3 Licensed Merchandise Forecasted Market Size by Region (2025-2030)
2.3 Licensed Merchandise Market Dynamics
2.3.1 Licensed Merchandise Industry Trends
2.3.2 Licensed Merchandise Market Drivers
2.3.3 Licensed Merchandise Market Challenges
2.3.4 Licensed Merchandise Market Restraints
3 Competition Landscape by Key Players
3.1 Global Top Licensed Merchandise Players by Revenue
3.1.1 Global Top Licensed Merchandise Players by Revenue (2019-2024)
3.1.2 Global Licensed Merchandise Revenue Market Share by Players (2019-2024)
3.2 Global Licensed Merchandise Market Share by Company Type (Tier 1, Tier 2, and Tier 3)
3.3 Players Covered: Ranking by Licensed Merchandise Revenue
3.4 Global Licensed Merchandise Market Concentration Ratio
3.4.1 Global Licensed Merchandise Market Concentration Ratio (CR5 and HHI)
3.4.2 Global Top 10 and Top 5 Companies by Licensed Merchandise Revenue in 2023
3.5 Licensed Merchandise Key Players Head office and Area Served
3.6 Key Players Licensed Merchandise Product Solution and Service
3.7 Date of Enter into Licensed Merchandise Market
3.8 Mergers & Acquisitions, Expansion Plans
4 Licensed Merchandise Breakdown Data by Type
4.1 Global Licensed Merchandise Historic Market Size by Type (2019-2024)
4.2 Global Licensed Merchandise Forecasted Market Size by Type (2025-2030)
5 Licensed Merchandise Breakdown Data by Application
5.1 Global Licensed Merchandise Historic Market Size by Application (2019-2024)
5.2 Global Licensed Merchandise Forecasted Market Size by Application (2025-2030)
6 North America
6.1 North America Licensed Merchandise Market Size (2019-2030)
6.2 North America Licensed Merchandise Market Growth Rate by Country: 2019 VS 2023 VS 2030
6.3 North America Licensed Merchandise Market Size by Country (2019-2024)
6.4 North America Licensed Merchandise Market Size by Country (2025-2030)
6.5 United States
6.6 Canada
7 Europe
7.1 Europe Licensed Merchandise Market Size (2019-2030)
7.2 Europe Licensed Merchandise Market Growth Rate by Country: 2019 VS 2023 VS 2030
7.3 Europe Licensed Merchandise Market Size by Country (2019-2024)
7.4 Europe Licensed Merchandise Market Size by Country (2025-2030)
7.5 Germany
7.6 France
7.7 U.K.
7.8 Italy
7.9 Russia
7.10 Nordic Countries
8 Asia-Pacific
8.1 Asia-Pacific Licensed Merchandise Market Size (2019-2030)
8.2 Asia-Pacific Licensed Merchandise Market Growth Rate by Region: 2019 VS 2023 VS 2030
8.3 Asia-Pacific Licensed Merchandise Market Size by Region (2019-2024)
8.4 Asia-Pacific Licensed Merchandise Market Size by Region (2025-2030)
8.5 China
8.6 Japan
8.7 South Korea
8.8 Southeast Asia
8.9 India
8.10 Australia
9 Latin America
9.1 Latin America Licensed Merchandise Market Size (2019-2030)
9.2 Latin America Licensed Merchandise Market Growth Rate by Country: 2019 VS 2023 VS 2030
9.3 Latin America Licensed Merchandise Market Size by Country (2019-2024)
9.4 Latin America Licensed Merchandise Market Size by Country (2025-2030)
9.5 Mexico
9.6 Brazil
10 Middle East & Africa
10.1 Middle East & Africa Licensed Merchandise Market Size (2019-2030)
10.2 Middle East & Africa Licensed Merchandise Market Growth Rate by Country: 2019 VS 2023 VS 2030
10.3 Middle East & Africa Licensed Merchandise Market Size by Country (2019-2024)
10.4 Middle East & Africa Licensed Merchandise Market Size by Country (2025-2030)
10.5 Turkey
10.6 Saudi Arabia
10.7 UAE
11 Key Players Profiles
11.1 The Walt Disney Company
11.1.1 The Walt Disney Company Company Detail
11.1.2 The Walt Disney Company Business Overview
11.1.3 The Walt Disney Company Licensed Merchandise Introduction
11.1.4 The Walt Disney Company Revenue in Licensed Merchandise Business (2019-2024)
11.1.5 The Walt Disney Company Recent Development
11.2 Meredith Corporation
11.2.1 Meredith Corporation Company Detail
11.2.2 Meredith Corporation Business Overview
11.2.3 Meredith Corporation Licensed Merchandise Introduction
11.2.4 Meredith Corporation Revenue in Licensed Merchandise Business (2019-2024)
11.2.5 Meredith Corporation Recent Development
11.3 PVH Corp.
11.3.1 PVH Corp. Company Detail
11.3.2 PVH Corp. Business Overview
11.3.3 PVH Corp. Licensed Merchandise Introduction
11.3.4 PVH Corp. Revenue in Licensed Merchandise Business (2019-2024)
11.3.5 PVH Corp. Recent Development
11.4 Iconix Brand Group
11.4.1 Iconix Brand Group Company Detail
11.4.2 Iconix Brand Group Business Overview
11.4.3 Iconix Brand Group Licensed Merchandise Introduction
11.4.4 Iconix Brand Group Revenue in Licensed Merchandise Business (2019-2024)
11.4.5 Iconix Brand Group Recent Development
11.5 Authentic Brands Group
11.5.1 Authentic Brands Group Company Detail
11.5.2 Authentic Brands Group Business Overview
11.5.3 Authentic Brands Group Licensed Merchandise Introduction
11.5.4 Authentic Brands Group Revenue in Licensed Merchandise Business (2019-2024)
11.5.5 Authentic Brands Group Recent Development
11.6 Universal Brand Development
11.6.1 Universal Brand Development Company Detail
11.6.2 Universal Brand Development Business Overview
11.6.3 Universal Brand Development Licensed Merchandise Introduction
11.6.4 Universal Brand Development Revenue in Licensed Merchandise Business (2019-2024)
11.6.5 Universal Brand Development Recent Development
11.7 Nickelodeon (ViacomCBS)
11.7.1 Nickelodeon (ViacomCBS) Company Detail
11.7.2 Nickelodeon (ViacomCBS) Business Overview
11.7.3 Nickelodeon (ViacomCBS) Licensed Merchandise Introduction
11.7.4 Nickelodeon (ViacomCBS) Revenue in Licensed Merchandise Business (2019-2024)
11.7.5 Nickelodeon (ViacomCBS) Recent Development
11.8 Major League Baseball
11.8.1 Major League Baseball Company Detail
11.8.2 Major League Baseball Business Overview
11.8.3 Major League Baseball Licensed Merchandise Introduction
11.8.4 Major League Baseball Revenue in Licensed Merchandise Business (2019-2024)
11.8.5 Major League Baseball Recent Development
11.9 Learfield IMG College
11.9.1 Learfield IMG College Company Detail
11.9.2 Learfield IMG College Business Overview
11.9.3 Learfield IMG College Licensed Merchandise Introduction
11.9.4 Learfield IMG College Revenue in Licensed Merchandise Business (2019-2024)
11.9.5 Learfield IMG College Recent Development
11.10 Sanrio
11.10.1 Sanrio Company Detail
11.10.2 Sanrio Business Overview
11.10.3 Sanrio Licensed Merchandise Introduction
11.10.4 Sanrio Revenue in Licensed Merchandise Business (2019-2024)
11.10.5 Sanrio Recent Development
11.11 Sequential Brands Group
11.11.1 Sequential Brands Group Company Detail
11.11.2 Sequential Brands Group Business Overview
11.11.3 Sequential Brands Group Licensed Merchandise Introduction
11.11.4 Sequential Brands Group Revenue in Licensed Merchandise Business (2019-2024)
11.11.5 Sequential Brands Group Recent Development
11.12 Hasbro
11.12.1 Hasbro Company Detail
11.12.2 Hasbro Business Overview
11.12.3 Hasbro Licensed Merchandise Introduction
11.12.4 Hasbro Revenue in Licensed Merchandise Business (2019-2024)
11.12.5 Hasbro Recent Development
11.13 General Motors
11.13.1 General Motors Company Detail
11.13.2 General Motors Business Overview
11.13.3 General Motors Licensed Merchandise Introduction
11.13.4 General Motors Revenue in Licensed Merchandise Business (2019-2024)
11.13.5 General Motors Recent Development
11.14 National Basketball Association
11.14.1 National Basketball Association Company Detail
11.14.2 National Basketball Association Business Overview
11.14.3 National Basketball Association Licensed Merchandise Introduction
11.14.4 National Basketball Association Revenue in Licensed Merchandise Business (2019-2024)
11.14.5 National Basketball Association Recent Development
11.15 Electrolux
11.15.1 Electrolux Company Detail
11.15.2 Electrolux Business Overview
11.15.3 Electrolux Licensed Merchandise Introduction
11.15.4 Electrolux Revenue in Licensed Merchandise Business (2019-2024)
11.15.5 Electrolux Recent Development
11.16 National Football League
11.16.1 National Football League Company Detail
11.16.2 National Football League Business Overview
11.16.3 National Football League Licensed Merchandise Introduction
11.16.4 National Football League Revenue in Licensed Merchandise Business (2019-2024)
11.16.5 National Football League Recent Development
11.17 WarnerMedia
11.17.1 WarnerMedia Company Detail
11.17.2 WarnerMedia Business Overview
11.17.3 WarnerMedia Licensed Merchandise Introduction
11.17.4 WarnerMedia Revenue in Licensed Merchandise Business (2019-2024)
11.17.5 WarnerMedia Recent Development
11.18 The Pokémon Company International
11.18.1 The Pokémon Company International Company Detail
11.18.2 The Pokémon Company International Business Overview
11.18.3 The Pokémon Company International Licensed Merchandise Introduction
11.18.4 The Pokémon Company International Revenue in Licensed Merchandise Business (2019-2024)
11.18.5 The Pokémon Company International Recent Development
11.19 Procter & Gamble
11.19.1 Procter & Gamble Company Detail
11.19.2 Procter & Gamble Business Overview
11.19.3 Procter & Gamble Licensed Merchandise Introduction
11.19.4 Procter & Gamble Revenue in Licensed Merchandise Business (2019-2024)
11.19.5 Procter & Gamble Recent Development
11.20 Ferrari
11.20.1 Ferrari Company Detail
11.20.2 Ferrari Business Overview
11.20.3 Ferrari Licensed Merchandise Introduction
11.20.4 Ferrari Revenue in Licensed Merchandise Business (2019-2024)
11.20.5 Ferrari Recent Development
11.21 Ralph Lauren
11.21.1 Ralph Lauren Company Detail
11.21.2 Ralph Lauren Business Overview
11.21.3 Ralph Lauren Licensed Merchandise Introduction
11.21.4 Ralph Lauren Revenue in Licensed Merchandise Business (2019-2024)
11.21.5 Ralph Lauren Recent Development
11.22 Mattel
11.22.1 Mattel Company Detail
11.22.2 Mattel Business Overview
11.22.3 Mattel Licensed Merchandise Introduction
11.22.4 Mattel Revenue in Licensed Merchandise Business (2019-2024)
11.22.5 Mattel Recent Development
11.23 Ford Motor Company
11.23.1 Ford Motor Company Company Detail
11.23.2 Ford Motor Company Business Overview
11.23.3 Ford Motor Company Licensed Merchandise Introduction
11.23.4 Ford Motor Company Revenue in Licensed Merchandise Business (2019-2024)
11.23.5 Ford Motor Company Recent Development
11.24 BBC Worldwide
11.24.1 BBC Worldwide Company Detail
11.24.2 BBC Worldwide Business Overview
11.24.3 BBC Worldwide Licensed Merchandise Introduction
11.24.4 BBC Worldwide Revenue in Licensed Merchandise Business (2019-2024)
11.24.5 BBC Worldwide Recent Development
11.25 The Hershey Company
11.25.1 The Hershey Company Company Detail
11.25.2 The Hershey Company Business Overview
11.25.3 The Hershey Company Licensed Merchandise Introduction
11.25.4 The Hershey Company Revenue in Licensed Merchandise Business (2019-2024)
11.25.5 The Hershey Company Recent Development
11.26 Stanley Black & Decker
11.26.1 Stanley Black & Decker Company Detail
11.26.2 Stanley Black & Decker Business Overview
11.26.3 Stanley Black & Decker Licensed Merchandise Introduction
11.26.4 Stanley Black & Decker Revenue in Licensed Merchandise Business (2019-2024)
11.26.5 Stanley Black & Decker Recent Development
11.27 PGA Tour
11.27.1 PGA Tour Company Detail
11.27.2 PGA Tour Business Overview
11.27.3 PGA Tour Licensed Merchandise Introduction
11.27.4 PGA Tour Revenue in Licensed Merchandise Business (2019-2024)
11.27.5 PGA Tour Recent Development
11.28 National Hockey League
11.28.1 National Hockey League Company Detail
11.28.2 National Hockey League Business Overview
11.28.3 National Hockey League Licensed Merchandise Introduction
11.28.4 National Hockey League Revenue in Licensed Merchandise Business (2019-2024)
11.28.5 National Hockey League Recent Development
11.29 Sunkist Growers
11.29.1 Sunkist Growers Company Detail
11.29.2 Sunkist Growers Business Overview
11.29.3 Sunkist Growers Licensed Merchandise Introduction
11.29.4 Sunkist Growers Revenue in Licensed Merchandise Business (2019-2024)
11.29.5 Sunkist Growers Recent Development
11.30 WWE
11.30.1 WWE Company Detail
11.30.2 WWE Business Overview
11.30.3 WWE Licensed Merchandise Introduction
11.30.4 WWE Revenue in Licensed Merchandise Business (2019-2024)
11.30.5 WWE Recent Development
12 Analyst's Viewpoints/Conclusions
13 Appendix
13.1 Research Methodology
13.1.1 Methodology/Research Approach
13.1.2 Data Source
13.2 Disclaimer
13.3 Author Details
List of Tables
    Table 1. Global Licensed Merchandise Market Size Growth Rate by Type (US$ Million): 2019 VS 2023 VS 2030
    Table 2. Key Players of Apparels
    Table 3. Key Players of Toys
    Table 4. Key Players of Accessories
    Table 5. Key Players of Home Decoration
    Table 6. Key Players of Software/Video Games
    Table 7. Key Players of Food and Beverage
    Table 8. Key Players of Others
    Table 9. Global Licensed Merchandise Market Size Growth by Application (US$ Million): 2019 VS 2023 VS 2030
    Table 10. Global Licensed Merchandise Market Size by Region (US$ Million): 2019 VS 2023 VS 2030
    Table 11. Global Licensed Merchandise Market Size by Region (2019-2024) & (US$ Million)
    Table 12. Global Licensed Merchandise Market Share by Region (2019-2024)
    Table 13. Global Licensed Merchandise Forecasted Market Size by Region (2025-2030) & (US$ Million)
    Table 14. Global Licensed Merchandise Market Share by Region (2025-2030)
    Table 15. Licensed Merchandise Market Trends
    Table 16. Licensed Merchandise Market Drivers
    Table 17. Licensed Merchandise Market Challenges
    Table 18. Licensed Merchandise Market Restraints
    Table 19. Global Licensed Merchandise Revenue by Players (2019-2024) & (US$ Million)
    Table 20. Global Licensed Merchandise Market Share by Players (2019-2024)
    Table 21. Global Top Licensed Merchandise Players by Company Type (Tier 1, Tier 2, and Tier 3) & (based on the Revenue in Licensed Merchandise as of 2023)
    Table 22. Ranking of Global Top Licensed Merchandise Companies by Revenue (US$ Million) in 2023
    Table 23. Global 5 Largest Players Market Share by Licensed Merchandise Revenue (CR5 and HHI) & (2019-2024)
    Table 24. Key Players Headquarters and Area Served
    Table 25. Key Players Licensed Merchandise Product Solution and Service
    Table 26. Date of Enter into Licensed Merchandise Market
    Table 27. Mergers & Acquisitions, Expansion Plans
    Table 28. Global Licensed Merchandise Market Size by Type (2019-2024) & (US$ Million)
    Table 29. Global Licensed Merchandise Revenue Market Share by Type (2019-2024)
    Table 30. Global Licensed Merchandise Forecasted Market Size by Type (2025-2030) & (US$ Million)
    Table 31. Global Licensed Merchandise Revenue Market Share by Type (2025-2030)
    Table 32. Global Licensed Merchandise Market Size by Application (2019-2024) & (US$ Million)
    Table 33. Global Licensed Merchandise Revenue Market Share by Application (2019-2024)
    Table 34. Global Licensed Merchandise Forecasted Market Size by Application (2025-2030) & (US$ Million)
    Table 35. Global Licensed Merchandise Revenue Market Share by Application (2025-2030)
    Table 36. North America Licensed Merchandise Market Size Growth Rate by Country (US$ Million): 2019 VS 2023 VS 2030
    Table 37. North America Licensed Merchandise Market Size by Country (2019-2024) & (US$ Million)
    Table 38. North America Licensed Merchandise Market Size by Country (2025-2030) & (US$ Million)
    Table 39. Europe Licensed Merchandise Market Size Growth Rate by Country (US$ Million): 2019 VS 2023 VS 2030
    Table 40. Europe Licensed Merchandise Market Size by Country (2019-2024) & (US$ Million)
    Table 41. Europe Licensed Merchandise Market Size by Country (2025-2030) & (US$ Million)
    Table 42. Asia-Pacific Licensed Merchandise Market Size Growth Rate by Region (US$ Million): 2019 VS 2023 VS 2030
    Table 43. Asia-Pacific Licensed Merchandise Market Size by Region (2019-2024) & (US$ Million)
    Table 44. Asia-Pacific Licensed Merchandise Market Size by Region (2025-2030) & (US$ Million)
    Table 45. Latin America Licensed Merchandise Market Size Growth Rate by Country (US$ Million): 2019 VS 2023 VS 2030
    Table 46. Latin America Licensed Merchandise Market Size by Country (2019-2024) & (US$ Million)
    Table 47. Latin America Licensed Merchandise Market Size by Country (2025-2030) & (US$ Million)
    Table 48. Middle East & Africa Licensed Merchandise Market Size Growth Rate by Country (US$ Million): 2019 VS 2023 VS 2030
    Table 49. Middle East & Africa Licensed Merchandise Market Size by Country (2019-2024) & (US$ Million)
    Table 50. Middle East & Africa Licensed Merchandise Market Size by Country (2025-2030) & (US$ Million)
    Table 51. The Walt Disney Company Company Detail
    Table 52. The Walt Disney Company Business Overview
    Table 53. The Walt Disney Company Licensed Merchandise Product
    Table 54. The Walt Disney Company Revenue in Licensed Merchandise Business (2019-2024) & (US$ Million)
    Table 55. The Walt Disney Company Recent Development
    Table 56. Meredith Corporation Company Detail
    Table 57. Meredith Corporation Business Overview
    Table 58. Meredith Corporation Licensed Merchandise Product
    Table 59. Meredith Corporation Revenue in Licensed Merchandise Business (2019-2024) & (US$ Million)
    Table 60. Meredith Corporation Recent Development
    Table 61. PVH Corp. Company Detail
    Table 62. PVH Corp. Business Overview
    Table 63. PVH Corp. Licensed Merchandise Product
    Table 64. PVH Corp. Revenue in Licensed Merchandise Business (2019-2024) & (US$ Million)
    Table 65. PVH Corp. Recent Development
    Table 66. Iconix Brand Group Company Detail
    Table 67. Iconix Brand Group Business Overview
    Table 68. Iconix Brand Group Licensed Merchandise Product
    Table 69. Iconix Brand Group Revenue in Licensed Merchandise Business (2019-2024) & (US$ Million)
    Table 70. Iconix Brand Group Recent Development
    Table 71. Authentic Brands Group Company Detail
    Table 72. Authentic Brands Group Business Overview
    Table 73. Authentic Brands Group Licensed Merchandise Product
    Table 74. Authentic Brands Group Revenue in Licensed Merchandise Business (2019-2024) & (US$ Million)
    Table 75. Authentic Brands Group Recent Development
    Table 76. Universal Brand Development Company Detail
    Table 77. Universal Brand Development Business Overview
    Table 78. Universal Brand Development Licensed Merchandise Product
    Table 79. Universal Brand Development Revenue in Licensed Merchandise Business (2019-2024) & (US$ Million)
    Table 80. Universal Brand Development Recent Development
    Table 81. Nickelodeon (ViacomCBS) Company Detail
    Table 82. Nickelodeon (ViacomCBS) Business Overview
    Table 83. Nickelodeon (ViacomCBS) Licensed Merchandise Product
    Table 84. Nickelodeon (ViacomCBS) Revenue in Licensed Merchandise Business (2019-2024) & (US$ Million)
    Table 85. Nickelodeon (ViacomCBS) Recent Development
    Table 86. Major League Baseball Company Detail
    Table 87. Major League Baseball Business Overview
    Table 88. Major League Baseball Licensed Merchandise Product
    Table 89. Major League Baseball Revenue in Licensed Merchandise Business (2019-2024) & (US$ Million)
    Table 90. Major League Baseball Recent Development
    Table 91. Learfield IMG College Company Detail
    Table 92. Learfield IMG College Business Overview
    Table 93. Learfield IMG College Licensed Merchandise Product
    Table 94. Learfield IMG College Revenue in Licensed Merchandise Business (2019-2024) & (US$ Million)
    Table 95. Learfield IMG College Recent Development
    Table 96. Sanrio Company Detail
    Table 97. Sanrio Business Overview
    Table 98. Sanrio Licensed Merchandise Product
    Table 99. Sanrio Revenue in Licensed Merchandise Business (2019-2024) & (US$ Million)
    Table 100. Sanrio Recent Development
    Table 101. Sequential Brands Group Company Detail
    Table 102. Sequential Brands Group Business Overview
    Table 103. Sequential Brands Group Licensed Merchandise Product
    Table 104. Sequential Brands Group Revenue in Licensed Merchandise Business (2019-2024) & (US$ Million)
    Table 105. Sequential Brands Group Recent Development
    Table 106. Hasbro Company Detail
    Table 107. Hasbro Business Overview
    Table 108. Hasbro Licensed Merchandise Product
    Table 109. Hasbro Revenue in Licensed Merchandise Business (2019-2024) & (US$ Million)
    Table 110. Hasbro Recent Development
    Table 111. General Motors Company Detail
    Table 112. General Motors Business Overview
    Table 113. General Motors Licensed Merchandise Product
    Table 114. General Motors Revenue in Licensed Merchandise Business (2019-2024) & (US$ Million)
    Table 115. General Motors Recent Development
    Table 116. National Basketball Association Company Detail
    Table 117. National Basketball Association Business Overview
    Table 118. National Basketball Association Licensed Merchandise Product
    Table 119. National Basketball Association Revenue in Licensed Merchandise Business (2019-2024) & (US$ Million)
    Table 120. National Basketball Association Recent Development
    Table 121. Electrolux Company Detail
    Table 122. Electrolux Business Overview
    Table 123. Electrolux Licensed Merchandise Product
    Table 124. Electrolux Revenue in Licensed Merchandise Business (2019-2024) & (US$ Million)
    Table 125. Electrolux Recent Development
    Table 126. National Football League Company Detail
    Table 127. National Football League Business Overview
    Table 128. National Football League Licensed Merchandise Product
    Table 129. National Football League Revenue in Licensed Merchandise Business (2019-2024) & (US$ Million)
    Table 130. National Football League Recent Development
    Table 131. WarnerMedia Company Detail
    Table 132. WarnerMedia Business Overview
    Table 133. WarnerMedia Licensed Merchandise Product
    Table 134. WarnerMedia Revenue in Licensed Merchandise Business (2019-2024) & (US$ Million)
    Table 135. WarnerMedia Recent Development
    Table 136. The Pokémon Company International Company Detail
    Table 137. The Pokémon Company International Business Overview
    Table 138. The Pokémon Company International Licensed Merchandise Product
    Table 139. The Pokémon Company International Revenue in Licensed Merchandise Business (2019-2024) & (US$ Million)
    Table 140. The Pokémon Company International Recent Development
    Table 141. Procter & Gamble Company Detail
    Table 142. Procter & Gamble Business Overview
    Table 143. Procter & Gamble Licensed Merchandise Product
    Table 144. Procter & Gamble Revenue in Licensed Merchandise Business (2019-2024) & (US$ Million)
    Table 145. Procter & Gamble Recent Development
    Table 146. Ferrari Company Detail
    Table 147. Ferrari Business Overview
    Table 148. Ferrari Licensed Merchandise Product
    Table 149. Ferrari Revenue in Licensed Merchandise Business (2019-2024) & (US$ Million)
    Table 150. Ferrari Recent Development
    Table 151. Ralph Lauren Company Detail
    Table 152. Ralph Lauren Business Overview
    Table 153. Ralph Lauren Licensed Merchandise Product
    Table 154. Ralph Lauren Revenue in Licensed Merchandise Business (2019-2024) & (US$ Million)
    Table 155. Ralph Lauren Recent Development
    Table 156. Mattel Company Detail
    Table 157. Mattel Business Overview
    Table 158. Mattel Licensed Merchandise Product
    Table 159. Mattel Revenue in Licensed Merchandise Business (2019-2024) & (US$ Million)
    Table 160. Mattel Recent Development
    Table 161. Ford Motor Company Company Detail
    Table 162. Ford Motor Company Business Overview
    Table 163. Ford Motor Company Licensed Merchandise Product
    Table 164. Ford Motor Company Revenue in Licensed Merchandise Business (2019-2024) & (US$ Million)
    Table 165. Ford Motor Company Recent Development
    Table 166. BBC Worldwide Company Detail
    Table 167. BBC Worldwide Business Overview
    Table 168. BBC Worldwide Licensed Merchandise Product
    Table 169. BBC Worldwide Revenue in Licensed Merchandise Business (2019-2024) & (US$ Million)
    Table 170. BBC Worldwide Recent Development
    Table 171. The Hershey Company Company Detail
    Table 172. The Hershey Company Business Overview
    Table 173. The Hershey Company Licensed Merchandise Product
    Table 174. The Hershey Company Revenue in Licensed Merchandise Business (2019-2024) & (US$ Million)
    Table 175. The Hershey Company Recent Development
    Table 176. Stanley Black & Decker Company Detail
    Table 177. Stanley Black & Decker Business Overview
    Table 178. Stanley Black & Decker Licensed Merchandise Product
    Table 179. Stanley Black & Decker Revenue in Licensed Merchandise Business (2019-2024) & (US$ Million)
    Table 180. Stanley Black & Decker Recent Development
    Table 181. PGA Tour Company Detail
    Table 182. PGA Tour Business Overview
    Table 183. PGA Tour Licensed Merchandise Product
    Table 184. PGA Tour Revenue in Licensed Merchandise Business (2019-2024) & (US$ Million)
    Table 185. PGA Tour Recent Development
    Table 186. National Hockey League Company Detail
    Table 187. National Hockey League Business Overview
    Table 188. National Hockey League Licensed Merchandise Product
    Table 189. National Hockey League Revenue in Licensed Merchandise Business (2019-2024) & (US$ Million)
    Table 190. National Hockey League Recent Development
    Table 191. Sunkist Growers Company Detail
    Table 192. Sunkist Growers Business Overview
    Table 193. Sunkist Growers Licensed Merchandise Product
    Table 194. Sunkist Growers Revenue in Licensed Merchandise Business (2019-2024) & (US$ Million)
    Table 195. Sunkist Growers Recent Development
    Table 196. WWE Company Detail
    Table 197. WWE Business Overview
    Table 198. WWE Licensed Merchandise Product
    Table 199. WWE Revenue in Licensed Merchandise Business (2019-2024) & (US$ Million)
    Table 200. WWE Recent Development
    Table 201. Research Programs/Design for This Report
    Table 202. Key Data Information from Secondary Sources
    Table 203. Key Data Information from Primary Sources
List of Figures
    Figure 1. Global Licensed Merchandise Market Size Comparison by Type (2024-2030) & (US$ Million)
    Figure 2. Global Licensed Merchandise Market Share by Type: 2023 VS 2030
    Figure 3. Apparels Features
    Figure 4. Toys Features
    Figure 5. Accessories Features
    Figure 6. Home Decoration Features
    Figure 7. Software/Video Games Features
    Figure 8. Food and Beverage Features
    Figure 9. Others Features
    Figure 10. Global Licensed Merchandise Market Size Comparison by Application (2024-2030) & (US$ Million)
    Figure 11. Global Licensed Merchandise Market Share by Application: 2023 VS 2030
    Figure 12. Entertainment Case Studies
    Figure 13. Corporate Trademarks/Brand Case Studies
    Figure 14. Fashion Case Studies
    Figure 15. Sports Case Studies
    Figure 16. Others Case Studies
    Figure 17. Licensed Merchandise Report Years Considered
    Figure 18. Global Licensed Merchandise Market Size (US$ Million), Year-over-Year: 2019-2030
    Figure 19. Global Licensed Merchandise Market Size, (US$ Million), 2019 VS 2023 VS 2030
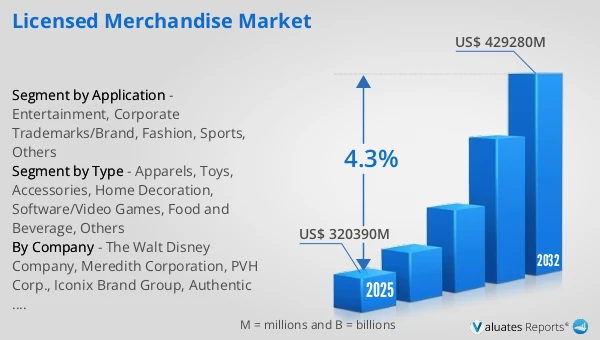
    Figure 20. Global Licensed Merchandise Market Share by Region: 2023 VS 2030
    Figure 21. Global Licensed Merchandise Market Share by Players in 2023
    Figure 22. Global Top Licensed Merchandise Players by Company Type (Tier 1, Tier 2, and Tier 3) & (based on the Revenue in Licensed Merchandise as of 2023)
    Figure 23. The Top 10 and 5 Players Market Share by Licensed Merchandise Revenue in 2023
    Figure 24. North America Licensed Merchandise Market Size YoY Growth (2019-2030) & (US$ Million)
    Figure 25. North America Licensed Merchandise Market Share by Country (2019-2030)
    Figure 26. United States Licensed Merchandise Market Size YoY Growth (2019-2030) & (US$ Million)
    Figure 27. Canada Licensed Merchandise Market Size YoY Growth (2019-2030) & (US$ Million)
    Figure 28. Europe Licensed Merchandise Market Size YoY Growth (2019-2030) & (US$ Million)
    Figure 29. Europe Licensed Merchandise Market Share by Country (2019-2030)
    Figure 30. Germany Licensed Merchandise Market Size YoY Growth (2019-2030) & (US$ Million)
    Figure 31. France Licensed Merchandise Market Size YoY Growth (2019-2030) & (US$ Million)
    Figure 32. U.K. Licensed Merchandise Market Size YoY Growth (2019-2030) & (US$ Million)
    Figure 33. Italy Licensed Merchandise Market Size YoY Growth (2019-2030) & (US$ Million)
    Figure 34. Russia Licensed Merchandise Market Size YoY Growth (2019-2030) & (US$ Million)
    Figure 35. Nordic Countries Licensed Merchandise Market Size YoY Growth (2019-2030) & (US$ Million)
    Figure 36. Asia-Pacific Licensed Merchandise Market Size YoY Growth (2019-2030) & (US$ Million)
    Figure 37. Asia-Pacific Licensed Merchandise Market Share by Region (2019-2030)
    Figure 38. China Licensed Merchandise Market Size YoY Growth (2019-2030) & (US$ Million)
    Figure 39. Japan Licensed Merchandise Market Size YoY Growth (2019-2030) & (US$ Million)
    Figure 40. South Korea Licensed Merchandise Market Size YoY Growth (2019-2030) & (US$ Million)
    Figure 41. Southeast Asia Licensed Merchandise Market Size YoY Growth (2019-2030) & (US$ Million)
    Figure 42. India Licensed Merchandise Market Size YoY Growth (2019-2030) & (US$ Million)
    Figure 43. Australia Licensed Merchandise Market Size YoY Growth (2019-2030) & (US$ Million)
    Figure 44. Latin America Licensed Merchandise Market Size YoY Growth (2019-2030) & (US$ Million)
    Figure 45. Latin America Licensed Merchandise Market Share by Country (2019-2030)
    Figure 46. Mexico Licensed Merchandise Market Size YoY Growth (2019-2030) & (US$ Million)
    Figure 47. Brazil Licensed Merchandise Market Size YoY Growth (2019-2030) & (US$ Million)
    Figure 48. Middle East & Africa Licensed Merchandise Market Size YoY Growth (2019-2030) & (US$ Million)
    Figure 49. Middle East & Africa Licensed Merchandise Market Share by Country (2019-2030)
    Figure 50. Turkey Licensed Merchandise Market Size YoY Growth (2019-2030) & (US$ Million)
    Figure 51. Saudi Arabia Licensed Merchandise Market Size YoY Growth (2019-2030) & (US$ Million)
    Figure 52. The Walt Disney Company Revenue Growth Rate in Licensed Merchandise Business (2019-2024)
    Figure 53. Meredith Corporation Revenue Growth Rate in Licensed Merchandise Business (2019-2024)
    Figure 54. PVH Corp. Revenue Growth Rate in Licensed Merchandise Business (2019-2024)
    Figure 55. Iconix Brand Group Revenue Growth Rate in Licensed Merchandise Business (2019-2024)
    Figure 56. Authentic Brands Group Revenue Growth Rate in Licensed Merchandise Business (2019-2024)
    Figure 57. Universal Brand Development Revenue Growth Rate in Licensed Merchandise Business (2019-2024)
    Figure 58. Nickelodeon (ViacomCBS) Revenue Growth Rate in Licensed Merchandise Business (2019-2024)
    Figure 59. Major League Baseball Revenue Growth Rate in Licensed Merchandise Business (2019-2024)
    Figure 60. Learfield IMG College Revenue Growth Rate in Licensed Merchandise Business (2019-2024)
    Figure 61. Sanrio Revenue Growth Rate in Licensed Merchandise Business (2019-2024)
    Figure 62. Sequential Brands Group Revenue Growth Rate in Licensed Merchandise Business (2019-2024)
    Figure 63. Hasbro Revenue Growth Rate in Licensed Merchandise Business (2019-2024)
    Figure 64. General Motors Revenue Growth Rate in Licensed Merchandise Business (2019-2024)
    Figure 65. National Basketball Association Revenue Growth Rate in Licensed Merchandise Business (2019-2024)
    Figure 66. Electrolux Revenue Growth Rate in Licensed Merchandise Business (2019-2024)
    Figure 67. National Football League Revenue Growth Rate in Licensed Merchandise Business (2019-2024)
    Figure 68. WarnerMedia Revenue Growth Rate in Licensed Merchandise Business (2019-2024)
    Figure 69. The Pokémon Company International Revenue Growth Rate in Licensed Merchandise Business (2019-2024)
    Figure 70. Procter & Gamble Revenue Growth Rate in Licensed Merchandise Business (2019-2024)
    Figure 71. Ferrari Revenue Growth Rate in Licensed Merchandise Business (2019-2024)
    Figure 72. Ralph Lauren Revenue Growth Rate in Licensed Merchandise Business (2019-2024)
    Figure 73. Mattel Revenue Growth Rate in Licensed Merchandise Business (2019-2024)
    Figure 74. Ford Motor Company Revenue Growth Rate in Licensed Merchandise Business (2019-2024)
    Figure 75. BBC Worldwide Revenue Growth Rate in Licensed Merchandise Business (2019-2024)
    Figure 76. The Hershey Company Revenue Growth Rate in Licensed Merchandise Business (2019-2024)
    Figure 77. Stanley Black & Decker Revenue Growth Rate in Licensed Merchandise Business (2019-2024)
    Figure 78. PGA Tour Revenue Growth Rate in Licensed Merchandise Business (2019-2024)
    Figure 79. National Hockey League Revenue Growth Rate in Licensed Merchandise Business (2019-2024)
    Figure 80. Sunkist Growers Revenue Growth Rate in Licensed Merchandise Business (2019-2024)
    Figure 81. WWE Revenue Growth Rate in Licensed Merchandise Business (2019-2024)
    Figure 82. Bottom-up and Top-down Approaches for This Report
    Figure 83. Data Triangulation
    Figure 84. Key Executives Interviewed
SELECT A FORMAT
Added to Cart
Electronic (PDF)

$2900

This license allows only one user to access the PDF.
Electronic (PDF)

$4350

This license allows 1 - 5 user to access the PDF, license is suitable for small groups of 5 users working together
Electronic (PDF)

$5800

This license allows users/teams in a same Enterprise to use this report, various departments within an enterpise can use this report
Add to Cart
Buy Now (15% Discount)

OUR CUSTOMER

Leap India

SIMILAR REPORTS


RELATED REPORTS

Global Spearfishing Wetsuits Market Research Report 2024

120 Pages
Type: Report
Code: QYRE-Auto-9F7820
Thu Mar 28 00:00:00 UTC 2024

Add to Cart

Global Sneakers Waterproof Spray Market Research Report 2024

120 Pages
Type: Report
Code: QYRE-Auto-4O7978
Thu Mar 28 00:00:00 UTC 2024

Add to Cart

Global Lens Holders Market Research Report 2024

120 Pages
Type: Report
Code: QYRE-Auto-14R7716
Thu Mar 28 00:00:00 UTC 2024

Add to Cart

Global Speargun Reels Market Research Report 2024

120 Pages
Type: Report
Code: QYRE-Auto-27X7471
Thu Mar 28 00:00:00 UTC 2024

Add to Cart